




Abstract
Introduction:
Cannabis is widely used for recreational and medical purposes, but its therapeutic efficacy remains unresolved for many applications as data from retrospective studies show dramatic discrepancy. We hypothesized that false self-reporting of cannabis use and lack of differentiation of heavy users from light or occasional users contribute to the conflicting outcomes.
Objective:
The goal of this study was to develop an objective biomarker of cannabis use and test how application of such biomarker impacts clinical study outcomes and dose–response measures.
Methods and Analysis:
Population pharmacokinetic (PK) models of (–)-trans-Δ9-tetrahydrocannabinol (THC) and its metabolites 11-hydroxy-Δ9-tetrahydrocannabinol (11-OH-THC) and 11-nor-9-carboxy-Δ9-tetrahydrocannabinol (11-COOH-THC) were developed based on published studies reporting cannabinoid disposition in individual subjects following intravenous administration or smoking of cannabis. Plasma 11-COOH-THC concentration distributions in different cannabis user groups smoking cannabis were generated via Monte Carlo simulations, and plasma concentration cutoff values of 11-COOH-THC were developed to differentiate light and heavy daily cannabis users in clinical studies. The developed cutoff value was then applied to a retrospective study that assessed the impact of cannabis use on T cell activation in subjects with HIV who self-reported as either nonuser or daily user of cannabis.
Results:
The developed population PK models established plasma 11-COOH-THC concentration of 73.1 μg/L as a cutoff value to identify heavy daily users, with a positive predictive value of 80% in a mixed population of equal proportions of once daily and three times a day users. The stratification allowed detection of changes in T cell activation in heavy users which was not detected based on self-reporting or detectability of plasma cannabinoids. A proof-of-concept power analysis demonstrated that implementation of such cutoff value greatly increases study power and sensitivity to detect pharmacological effects of cannabis use.
Conclusions:
This study shows that the use of plasma 11-COOH-THC concentration cutoff value as an objective measure to classify cannabis use in target populations is critical for study sensitivity and specificity and provides much needed clarity for addressing dose–response relationships and therapeutic effects of cannabis.
Introduction
Cannabis is a recreational and medicinal drug, with analgesic, anxiolytic, and mood state effects elicited by its psychoactive component (–)-trans-Δ9-tetrahydrocannabinol (THC) and its active metabolite 11-hydroxy-Δ9-tetrahydrocannabinol (11-OH-THC).1,2 THC binds to cannabinoid (CB) receptors affecting the central nervous system, circulatory system, and adaptive immune response.2,3 Cannabis may be effective in managing pain, depression, nausea, and other symptoms 2 associated with, for example, HIV infection,4,5 cancer, 6 and neuromuscular disorders. 7 In cancer patients, 24% of patients used cannabis, of which 56% were daily consumers. 6 In patients with inflammatory bowel disease (IBD) whose lifetime cannabis use is around 50%, 12–16% of patients actively use cannabis, and 25% of daily users consumed multiple times a day. 8
Despite broad use, many anecdotal therapeutic effects of cannabis remain unverified, and the impact of cannabis use on disease progression and clinical outcomes is ill-defined. Studies of cannabis effects are often performed retrospectively and rely on self-reported use of cannabis. However, the concordance between self-reporting and drug screen from biospecimens varies between 80% and 96%,9–11 including both false negative and false positive self-reporting. This confounds study populations and likely contributes to the reported variable results. A self-reporting-based retrospective study found no significant impact of prenatal THC exposure on birth weight, 12 conflicting with a similar study in which birth weight was found to be lower in users categorized based on self-reporting and positive urine tests. 13 Neither study investigated the dose dependency or impact of frequency of maternal cannabis use, although some data suggest that heavy exposure influences neurodevelopmental outcomes. 14
The subjective pharmacological effects (“high”) of THC last ∼4–5 h,15,16 suggesting that occasional (i.e., weekly) or regular (i.e., light daily) users may only experience short-term occupancy of CB receptors, whereas heavy users (i.e., more than three times per day) likely have continuous “steady-state” pharmacological activity. To define the impact of cannabis use on health outcomes, objective measures of cannabis dose and frequency of use are needed to minimize confounding effects of self-reporting biases and allow exposure–response analyses to differentiate subjects whose THC levels provide constant receptor occupancy from those whose exposure is more intermittent.
THC and its metabolites can be measured from biological matrices such as urine, whole blood, serum, plasma, hair, meconium, and oral fluids. 17 Generally urine, hair, and oral fluids are useful for qualitative confirmation of cannabis use but are not quantitatively meaningful. 17 THC and its metabolites 11-OH-THC and 11-nor-9-carboxy-Δ9-tetrahydrocannabinol (11-COOH-THC) are detectable in blood/plasma/serum shortly after smoking. 17 However, plasma THC concentration is not a good quantitative measure of cannabis use as it falls rapidly after consumption. 18 In contrast, 11-COOH-THC has a long plasma half-life and accumulates with regular use, making it a stable biomarker for determining the level of cannabis use,5,19,20 although its disposition can vary between individuals due to different consumption patterns, dose, bioavailability, and pharmacokinetics (PK). 2 The goal of this study was to develop plasma 11-COOH-THC concentration as a quantitative biomarker of cannabis use and test the sensitivity and specificity of such biomarker in classifying cannabis users.
Methods
Development of parent–metabolite PK model of THC, 11-OH-THC, and 11-COOH-THC
The PK parameters for THC and 11-COOH-THC were obtained from previous studies (Supplementary Table S1).21,22 For 11-OH-THC, no individual subject data after intravenous (iv) administration have been reported. Therefore, a fixed-effect PK model of 11-OH-THC was developed using the mean concentration–time data after iv dosing of 11-OH-THC. 23
A parent–metabolite PK model for sequential metabolism of THC to 11-OH-THC and 11-COOH-THC was constructed based on the individual compound models using MATLAB 9.4 (R2018a; MathWorks, Natick, MA) by linking the central compartments of THC, 11-OH-THC, and 11-COOH-THC (Fig. 1 and Supplementary Data S1). The linked model incorporates known clearance pathways and hepatic first pass effect of the metabolite and allows for the simulation of plasma 11-COOH-THC disposition after iv dosing or smoking of THC.
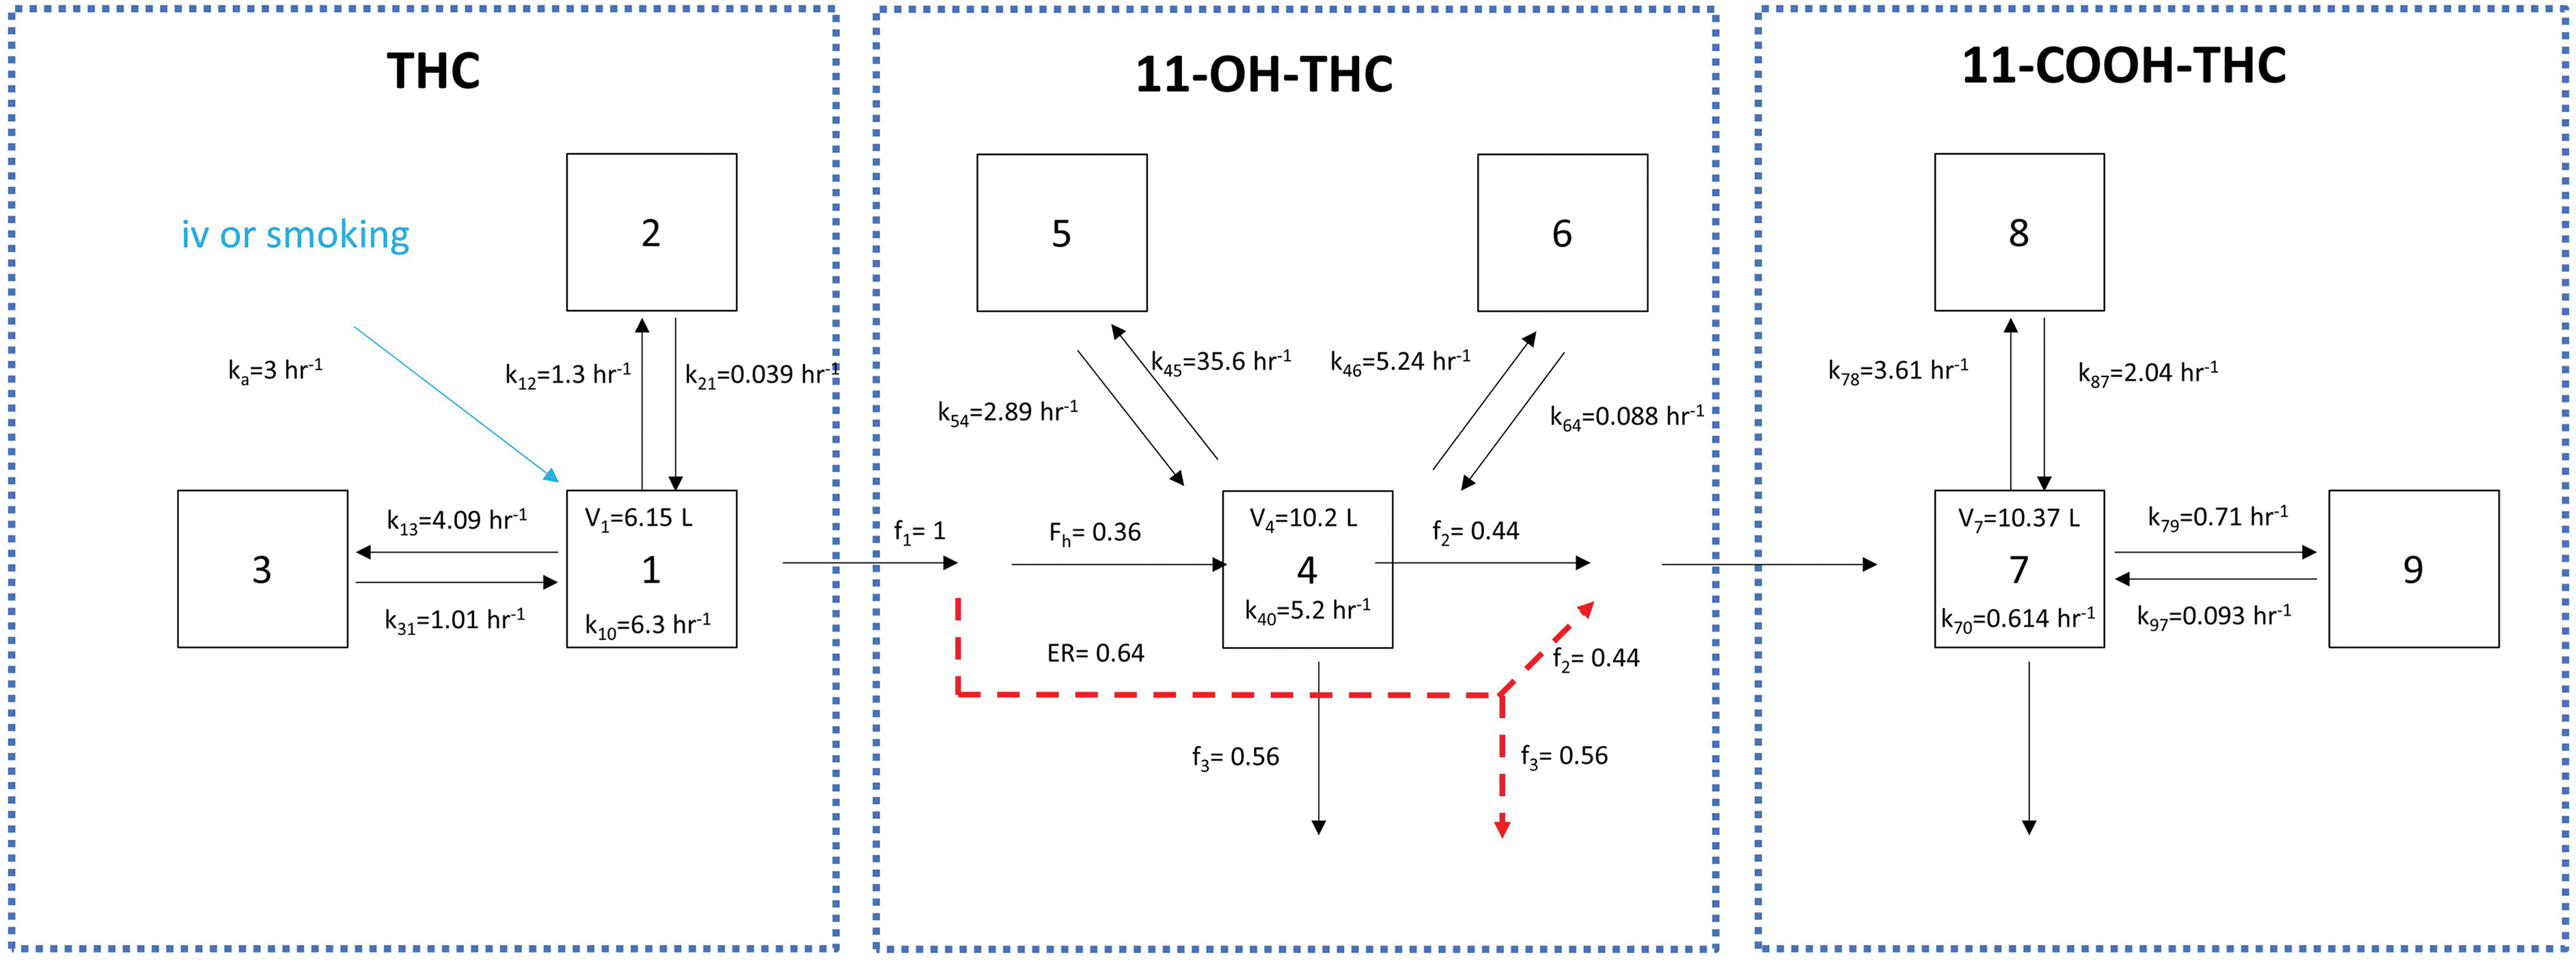
Structure of the parent–metabolite pharmacokinetic model for THC and its metabolites 11-OH-THC and 11-COOH-THC. All three compounds were modeled based on three-compartment kinetics with numbers 1–3 indicating the compartments for THC, numbers 4–6 indicating the compartments for 11-OH-THC, and numbers 7–9 indicating the compartments for 11-COOH-THC. The arrows show distribution, elimination, and metabolite formation processes with rate constants (k's) shown with the relevant units next to the arrows. The red dashed arrows indicate the 11-OH-THC formed from THC that does not escape the liver upon formation and is either metabolized to 11-COOH-THC before escaping the liver (f2) appearing in systemic circulation as 11-COOH-THC or cleared via alternative pathway (f3). The coefficients of variance (CV%) of V1, k10, V7, and k70 are 30.04%, 13.61%, 23.9%, and 43.3%, respectively. The model parameters are provided in Supplementary Table S1, and details of the model development are provided in the Supplementary Data. V1, V4, and V7 are the volume parameters for the central compartment of THC (V1), 11-OH-THC (V4), and 11-COOH-THC (V7); ER is the hepatic extraction ratio of 11-OH-THC; and Fh represents the fraction of 11-OH-THC escaping hepatic metabolism. THC, tetrahydrocannabinol. Color images are available online.
The mean absolute bioavailability of THC after smoking was calculated for occasional users (<once weekly) as 11.4% (coefficient of variation [CV]%=51.5) and for regular users (>once daily) as 24.5% (CV%=54.7) based on reported values from individual subjects.24,25 The absorption rate constant (ka) of THC from smoking cannabis was set as 3 hr−1 to be sufficiently high to allow peak concentrations of THC to occur nearly instantaneously after smoking.
Monte Carlo mixed-effect simulations of plasma THC or 11-COOH-THC concentration–time profiles in 1000 virtual subjects (either daily or occasional users of cannabis) who consumed THC via smoking or iv dosing were conducted. The simulations were compared with the observed data from individual subjects from three iv dosing studies22,25,26 and three smoking studies27–29 to test whether the model would capture individual user 11-COOH-THC concentrations. The details of the Monte Carlo simulations are included in the Supplementary Data.
Development of plasma 11-COOH-THC concentration cutoff values to identify heavy cannabis users
Monte Carlo simulations were used to generate steady-state plasma THC and 11-COOH-THC concentrations for four different user populations: once (QD), twice (BID), three times (TID), and four times (QID) a day users, assuming a dose of 60 mg THC per usage session. The 60 mg dose was based on reported average weight of a cannabis joint (0.32–0.5 g),30,31 the average THC content of 17–23% in cannabis 32 and some loss of THC in side-stream smoke and the unsmoked cigarette butt. The distributions of steady-state 11-COOH-THC concentrations over a 24-h interval in each user group (n=1000) were simulated. A uniform sampling was conducted from the simulated steady-state 11-COOH-THC concentrations. Three hypothetical compositions of usage patterns (QD:TID=3:7, 1:1, or 7:3) were created as representative mixed-user cohorts to capture variability in user populations in different studies and to address the lack of knowledge of the true user distribution.
To define cutoff values of plasma 11-COOH-THC that would differentiate heavy users (TID) from light daily users (QD), precision–recall curves were generated for three hypothetical mixed-user cohorts (distribution of users QD:TID=3:7, 1:1, or 7:3) with testing 11-COOH-THC cutoff concentrations of 1–600 μg/L with an increment of 0.1 μg/L. True positives (TP) and false positives (FP) were defined as cases where the individuals would be correctly (TP) and incorrectly (FP) classified as heavy users (TID) based on the plasma 11-COOH-THC concentration measured and the given cutoff. True negatives (TN) and false negatives (FN) were defined as the cases where plasma 11-COOH-THC samples with the given cutoff were correctly (TN) and incorrectly (FN) rejected from heavy user group. True positive rate (TPR) was calculated as TP/(TP+FN), and positive predictive value (PPV) was calculated as TP/(TP+FP). Precision–recall curves were generated with PPV versus TPR with increasing 11-COOH-THC concentration-based cutoff value in the three different population distributions considered. The 11-COOH-THC concentration cutoff value to classify TID heavy users was determined based on 80% PPV.
Impact of cannabis user classification on detecting pharmacological effects of cannabis
The impact of implementing 11-COOH-THC cutoff values on data analysis in studies that include heterogeneous users was tested using data from a retrospective study that investigated the effect of cannabis on T cell activation. 5 The study participants (HIV-1-infected, antiretroviral therapy [ART]-treated) were enrolled in the SCOPE cohort at the University of California, San Francisco. All participants gave written informed consent using protocols approved by the Committee on Human Research, University of California, San Francisco. 5
The study subjects (201 HIV-infected ART-treated subjects) self-reported as either daily (≥once every day) or no cannabis use, without further classifications into QD, BID, or TID (heavy) users. Plasma 11-COOH-THC concentrations and immune cell activation data were analyzed from each subject as previously described. 5 The study subjects were classified by three different methods: (1) self-reporting as nonuser versus daily user; (2) non-detectable versus detectable plasma 11-COOH-THC concentration; and (3) non-detectable CBs (nonuser), detectable CBs but 11-COOH-THC concentrations below the defined cutoff (73.1 μg/L), and 11-COOH-THC concentrations greater than 73.1 μg/L (heavy users). The differences in activated T cell frequencies between the defined groups were assessed using the Mann–Whitney test.
The impact of heterogeneity in study populations was explored using estimations of prospective study power and number of subjects needed to detect pharmacological effects as a proof-of-concept study. Three possible pharmacological targets/biomarkers were considered. The analysis assumed that cannabis has no effect on the pharmacological target in nonusers or QD users (nonresponders) with mean target measurement μ0=1, whereas cannabis produces varying effects in TID heavy users (responders) with different effect sizes (δ=0.25, 0.5, and 1) for different targets, resulting in mean target measurements μ1, μ2, and μ3 of 1.25, 1.5, and 2.0, respectively. All three target effects were assumed to follow normal distribution with coefficient of variance of 50%.
Three scenarios were considered: (1) subjects classified based on a perfectly performing cutoff value, and therefore, all subjects are correctly identified as responders or nonresponders; (2) subjects classified based on 11-COOH-THC detection, and therefore, nonusers are correctly identified (non-detectable 11-COOH-THC), but the responder group is a mixture of heavy users (responders, 21.5%) and non-heavy users (nonresponders, 78.5%) 5 ; and (3) subjects classified based on self-reported use 5 resulting in the nonresponder group being a mixture of responders (3.7%) and nonresponders (96.3%) due to self-reporting biases and the responder group being a mixture of responders (18.5%) and nonresponders (81.5%).
Power analysis was conducted to determine the number of subjects needed to detect the effect of cannabis on the three pharmacological outcomes by generating hypothetical target measurements in samples of random subjects (n=20, 30, 40, 60, 100, 200, 300, 600, and 1000) in each scenario. Statistical significance was tested by the Mann–Whitney test, with a nominal p-value of <0.05 considered significant. For each power analysis, 1000 iterations of random sampling and the Mann–Whitney testing were performed to mimic 1000 trials. Power was calculated as the proportion of 1000 trials that was considered significant (p<0.05).
Results
Development of plasma 11-COOH-THC concentration cutoff values
A parent–metabolite PK model (Fig. 1) was developed to simulate plasma THC and 11-COOH-THC concentrations following different usage patterns of cannabis. The model performance was tested by comparing simulated plasma THC and 11-COOH-THC concentrations in 1000 individuals taking THC via iv or smoking route with the observed data from three iv dosing studies22,25,26 and three smoking studies.27–29 All observed data22,25–29 were satisfactorily described by our model (Figs. 2–4), suggesting that the parent–metabolite PK model adequately captures the disposition and accumulation of CBs after iv and smoking with varying dosing regimens in different user populations.
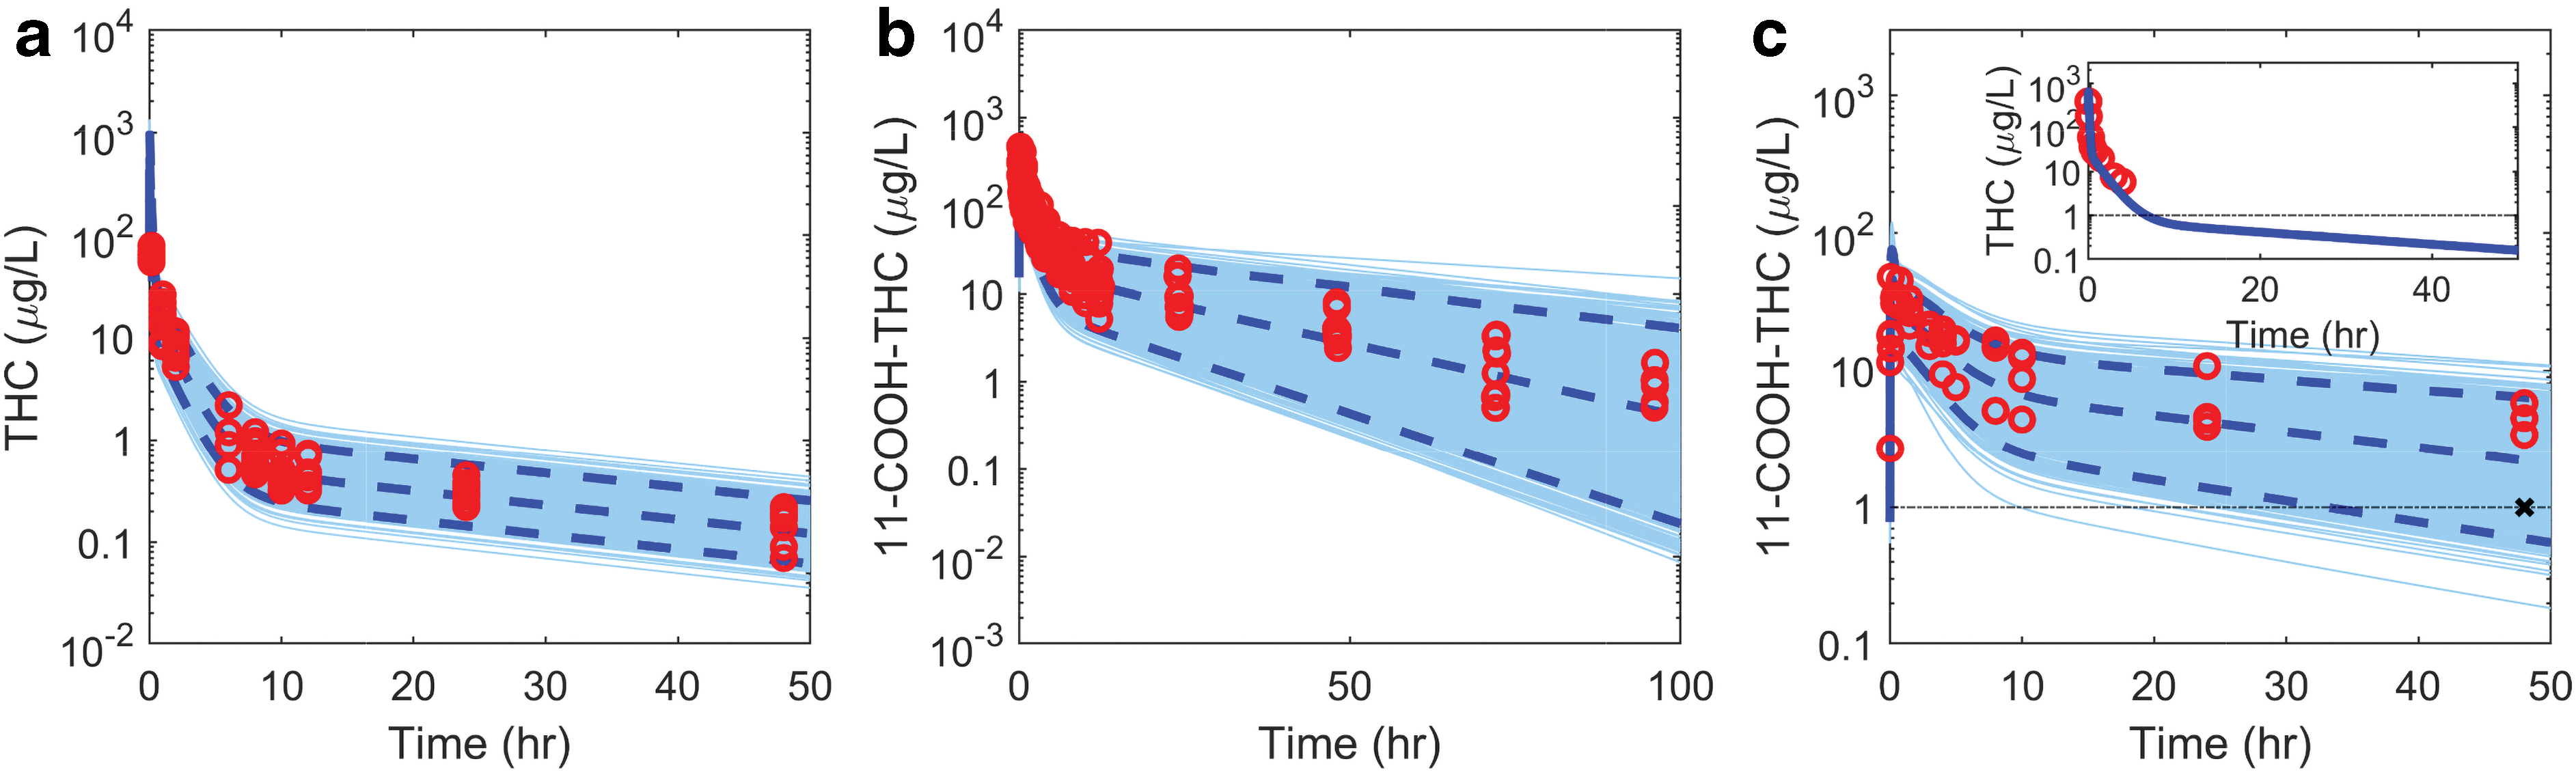
Simulation of THC and 11-COOH-THC concentrations after single iv dose of THC or 11-COOH-THC. THC and 11-COOH-THC concentrations were simulated in 1000 virtual subjects (light blue lines) following iv dosing of THC
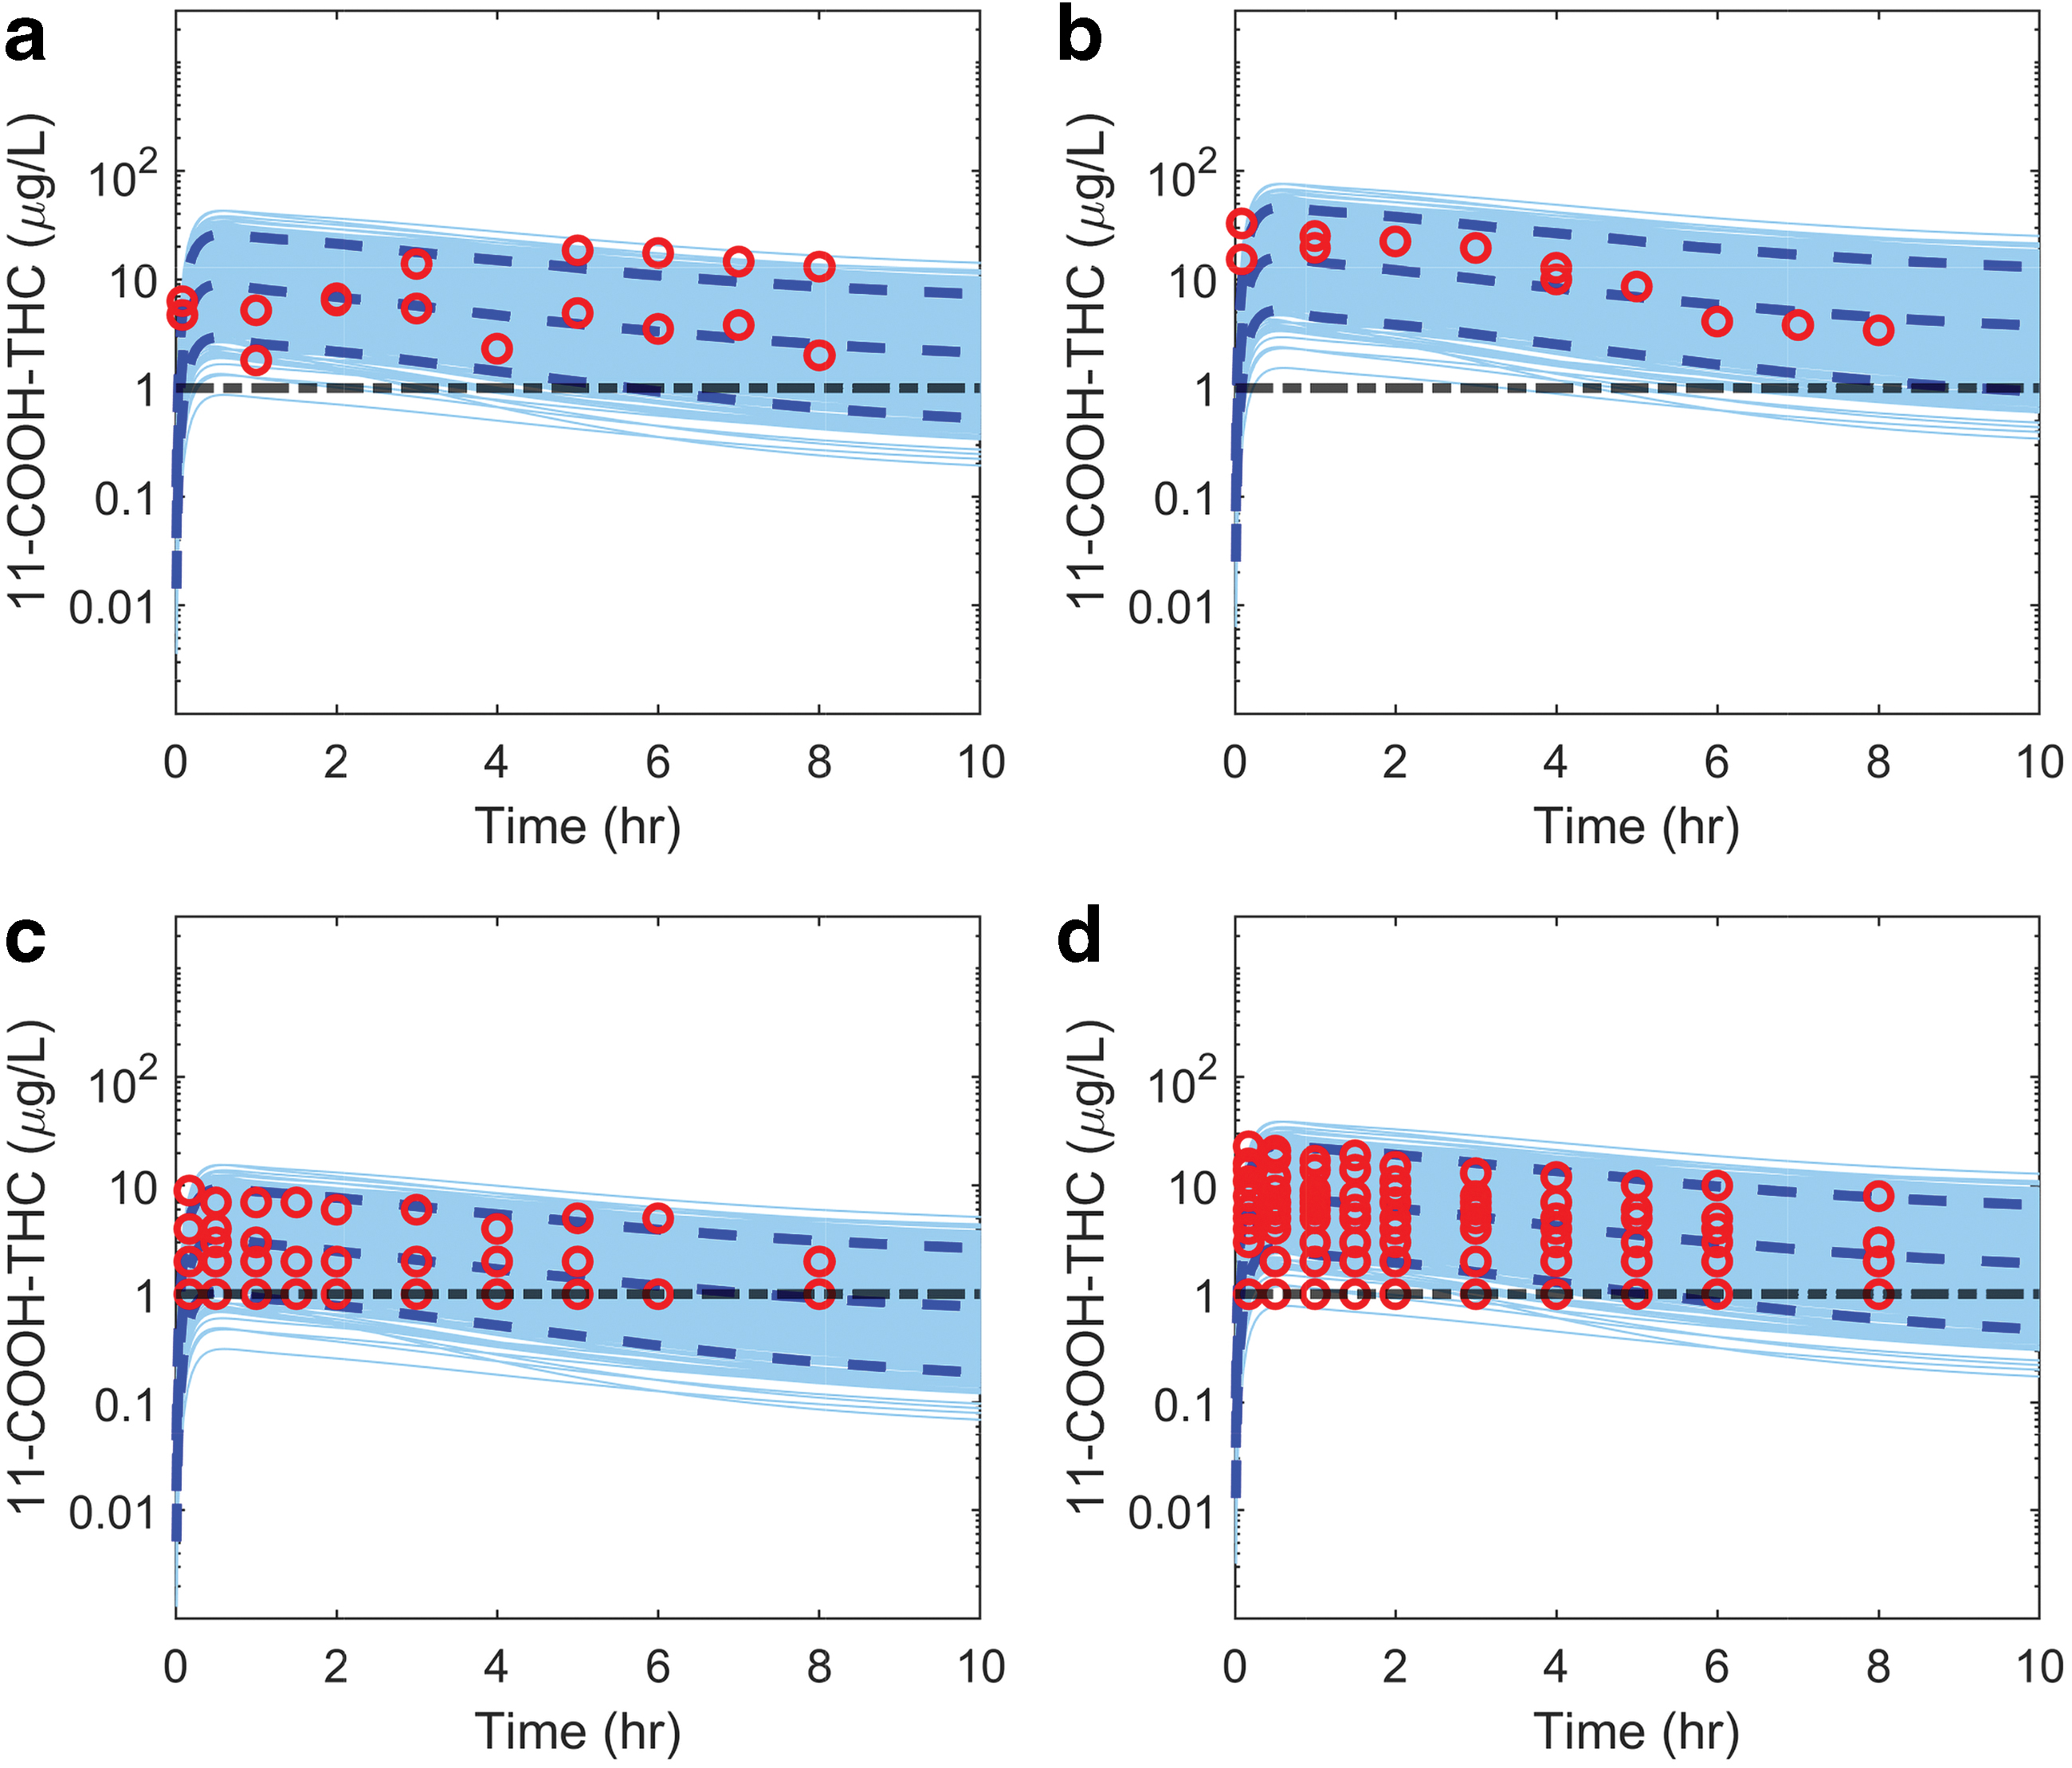
Simulated and observed plasma 11-COOH-THC concentrations in light daily users of cannabis after smoking cannabis. Plasma concentrations of 11-COOH-THC were simulated in 1000 virtual subjects (light blue lines) with the mean and 95% confidence interval shown as dashed dark blue curves. Simulations were conducted using the model shown in Figure 1, assuming THC bioavailability of 11.4% (CV% 54.7) from smoked cannabis and an absorption rate constant (ka) of 3 h−1. All simulated doses matched the reported doses in the observed data. In
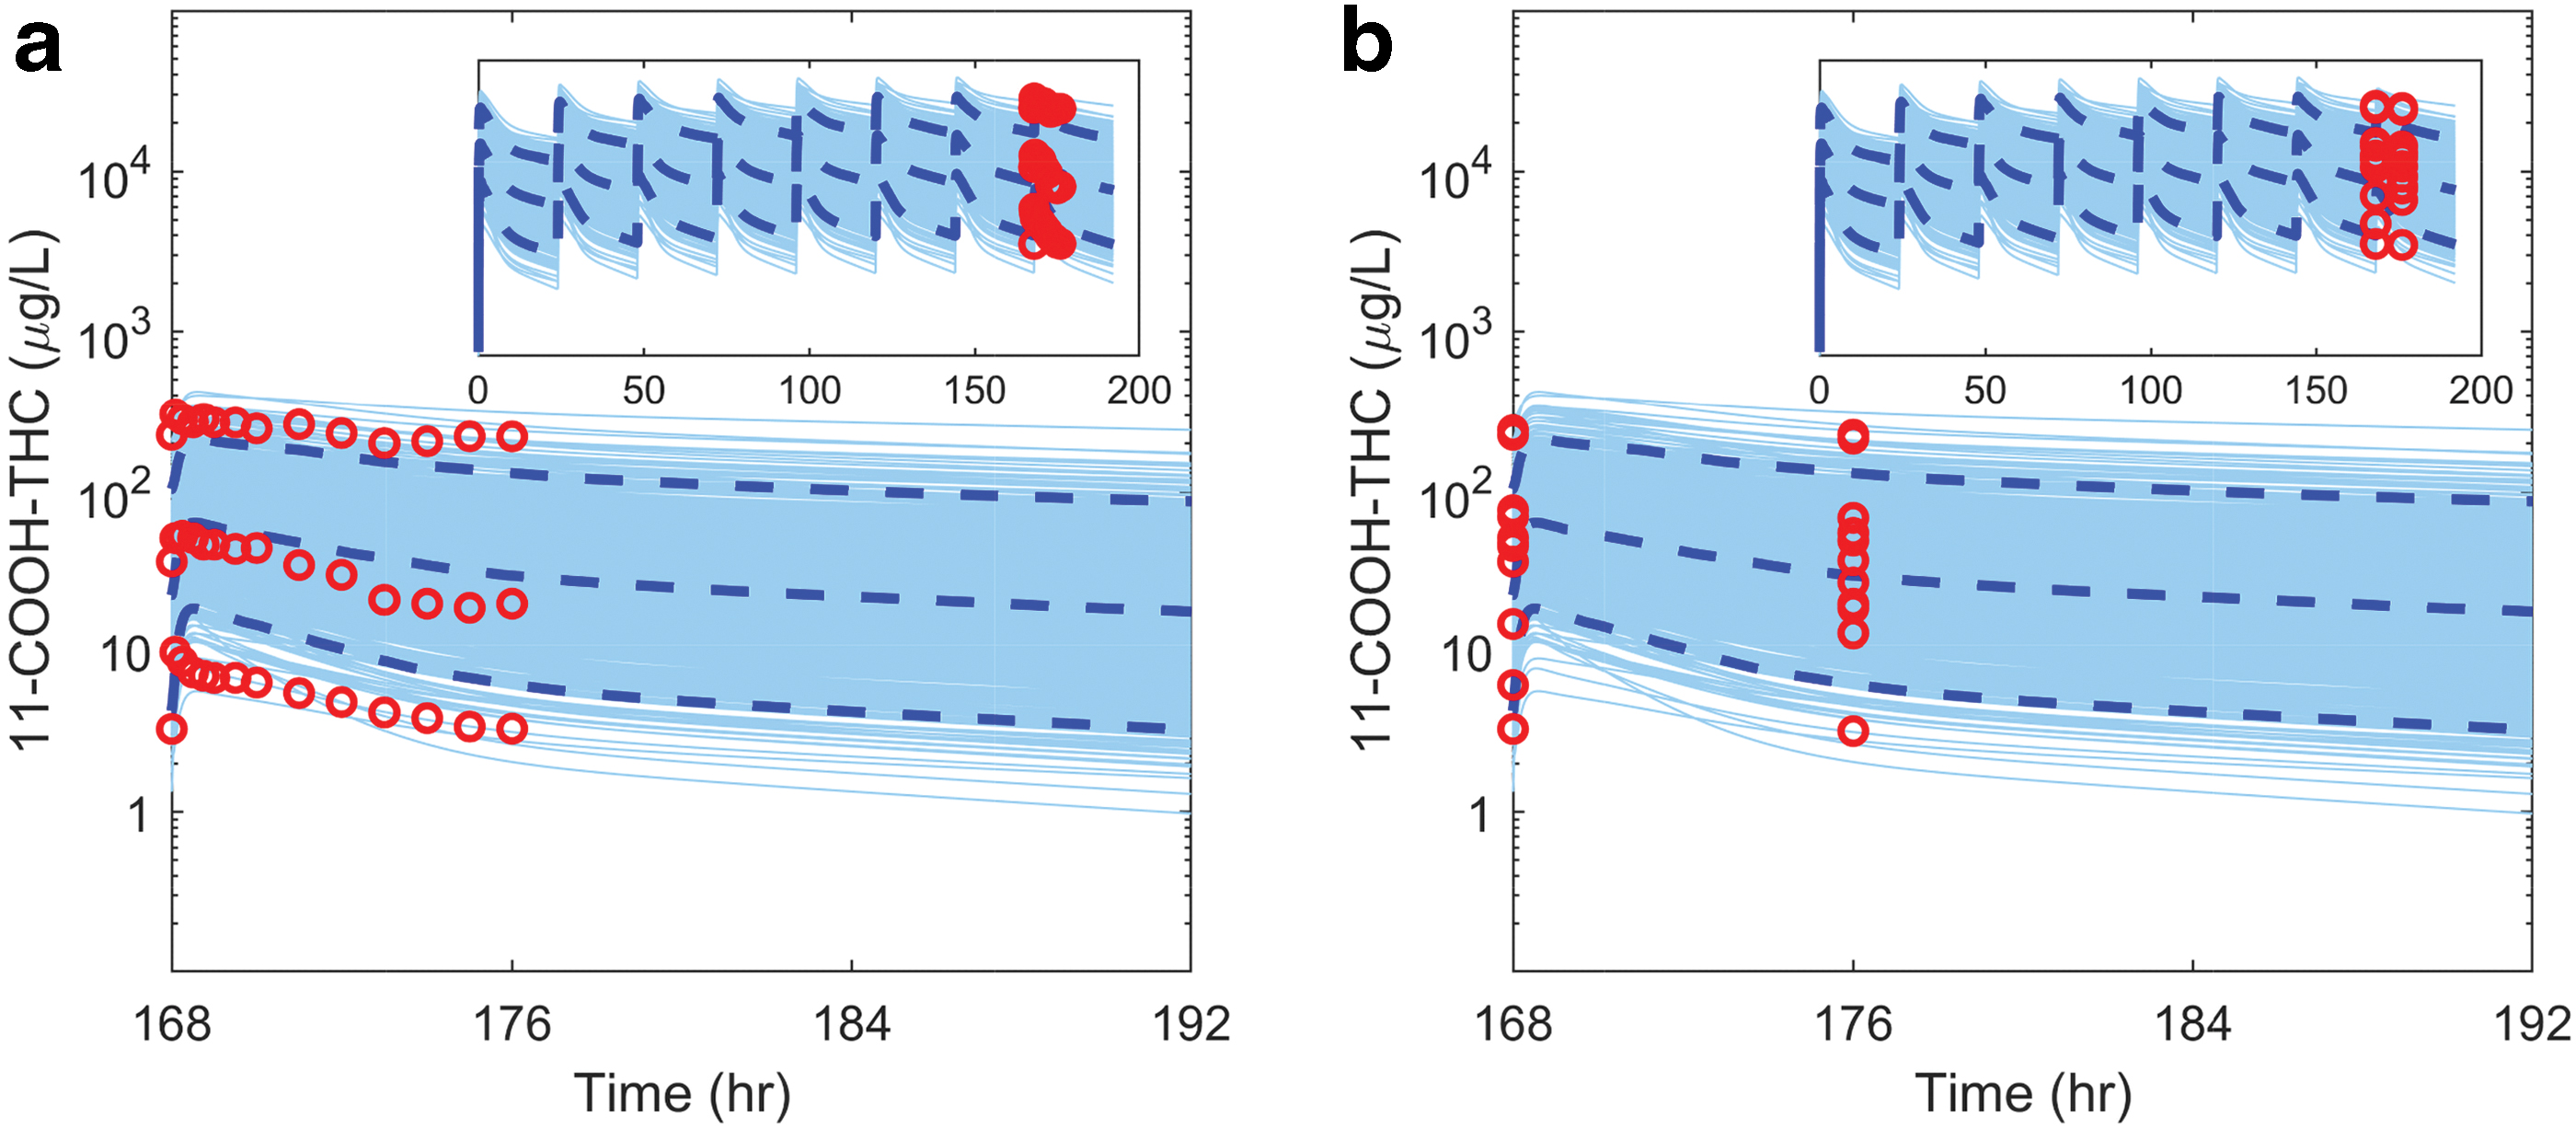
Simulation of steady-state 11-COOH-THC concentrations in a population of heavy cannabis users after smoking cannabis. The individual simulated concentrations for 11-COOH-THC in 1000 virtual subjects are shown as light blue curves, with the mean and 95% confidence interval shown as dashed dark blue curves. The observed data are shown as red circles. The simulations were generated for subjects who smoked 60 mg THC once every day for 7 days (0–168 h) to reach steady state (shown in insets), followed by smoking 33 mg THC at 168 h. The simulation results after the last THC dose (168th −192nd h) are shown together with the observed data over 8 h (red symbols) from individual
29
heavy users who admitted use of ∼2 cannabis joints on 4–25 (median 7) occasions in the week before study. Reported
29
subjects #1, #5, and #10 had continuous/longitudinal measurements available
The steady-state plasma 11-COOH-THC concentrations in QD, BID, TID, and QID user populations were simulated to characterize plasma 11-COOH-THC concentration distributions in these cannabis user groups (Fig. 5). Hypothetical populations with mixed QD and TID users were generated to mimic potential study populations (Fig. 6). Precision–recall curves were constructed for each mixed cohort to estimate the 11-COOH-THC cutoff values that would allow differentiation of TID heavy users and QD regular users (Fig. 6). The 11-COOH-THC concentration cutoff values using 80% PPV were 29.1, 73.1, and 143 μg/L in mixed populations with 3:7, 1:1, and 7:3 QD:TID ratios, respectively. This cutoff trend indicates that a higher 11-COOH-THC concentration cutoff is needed to identify the TID heavy users from a mixed population that has lower heavy user prevalence.
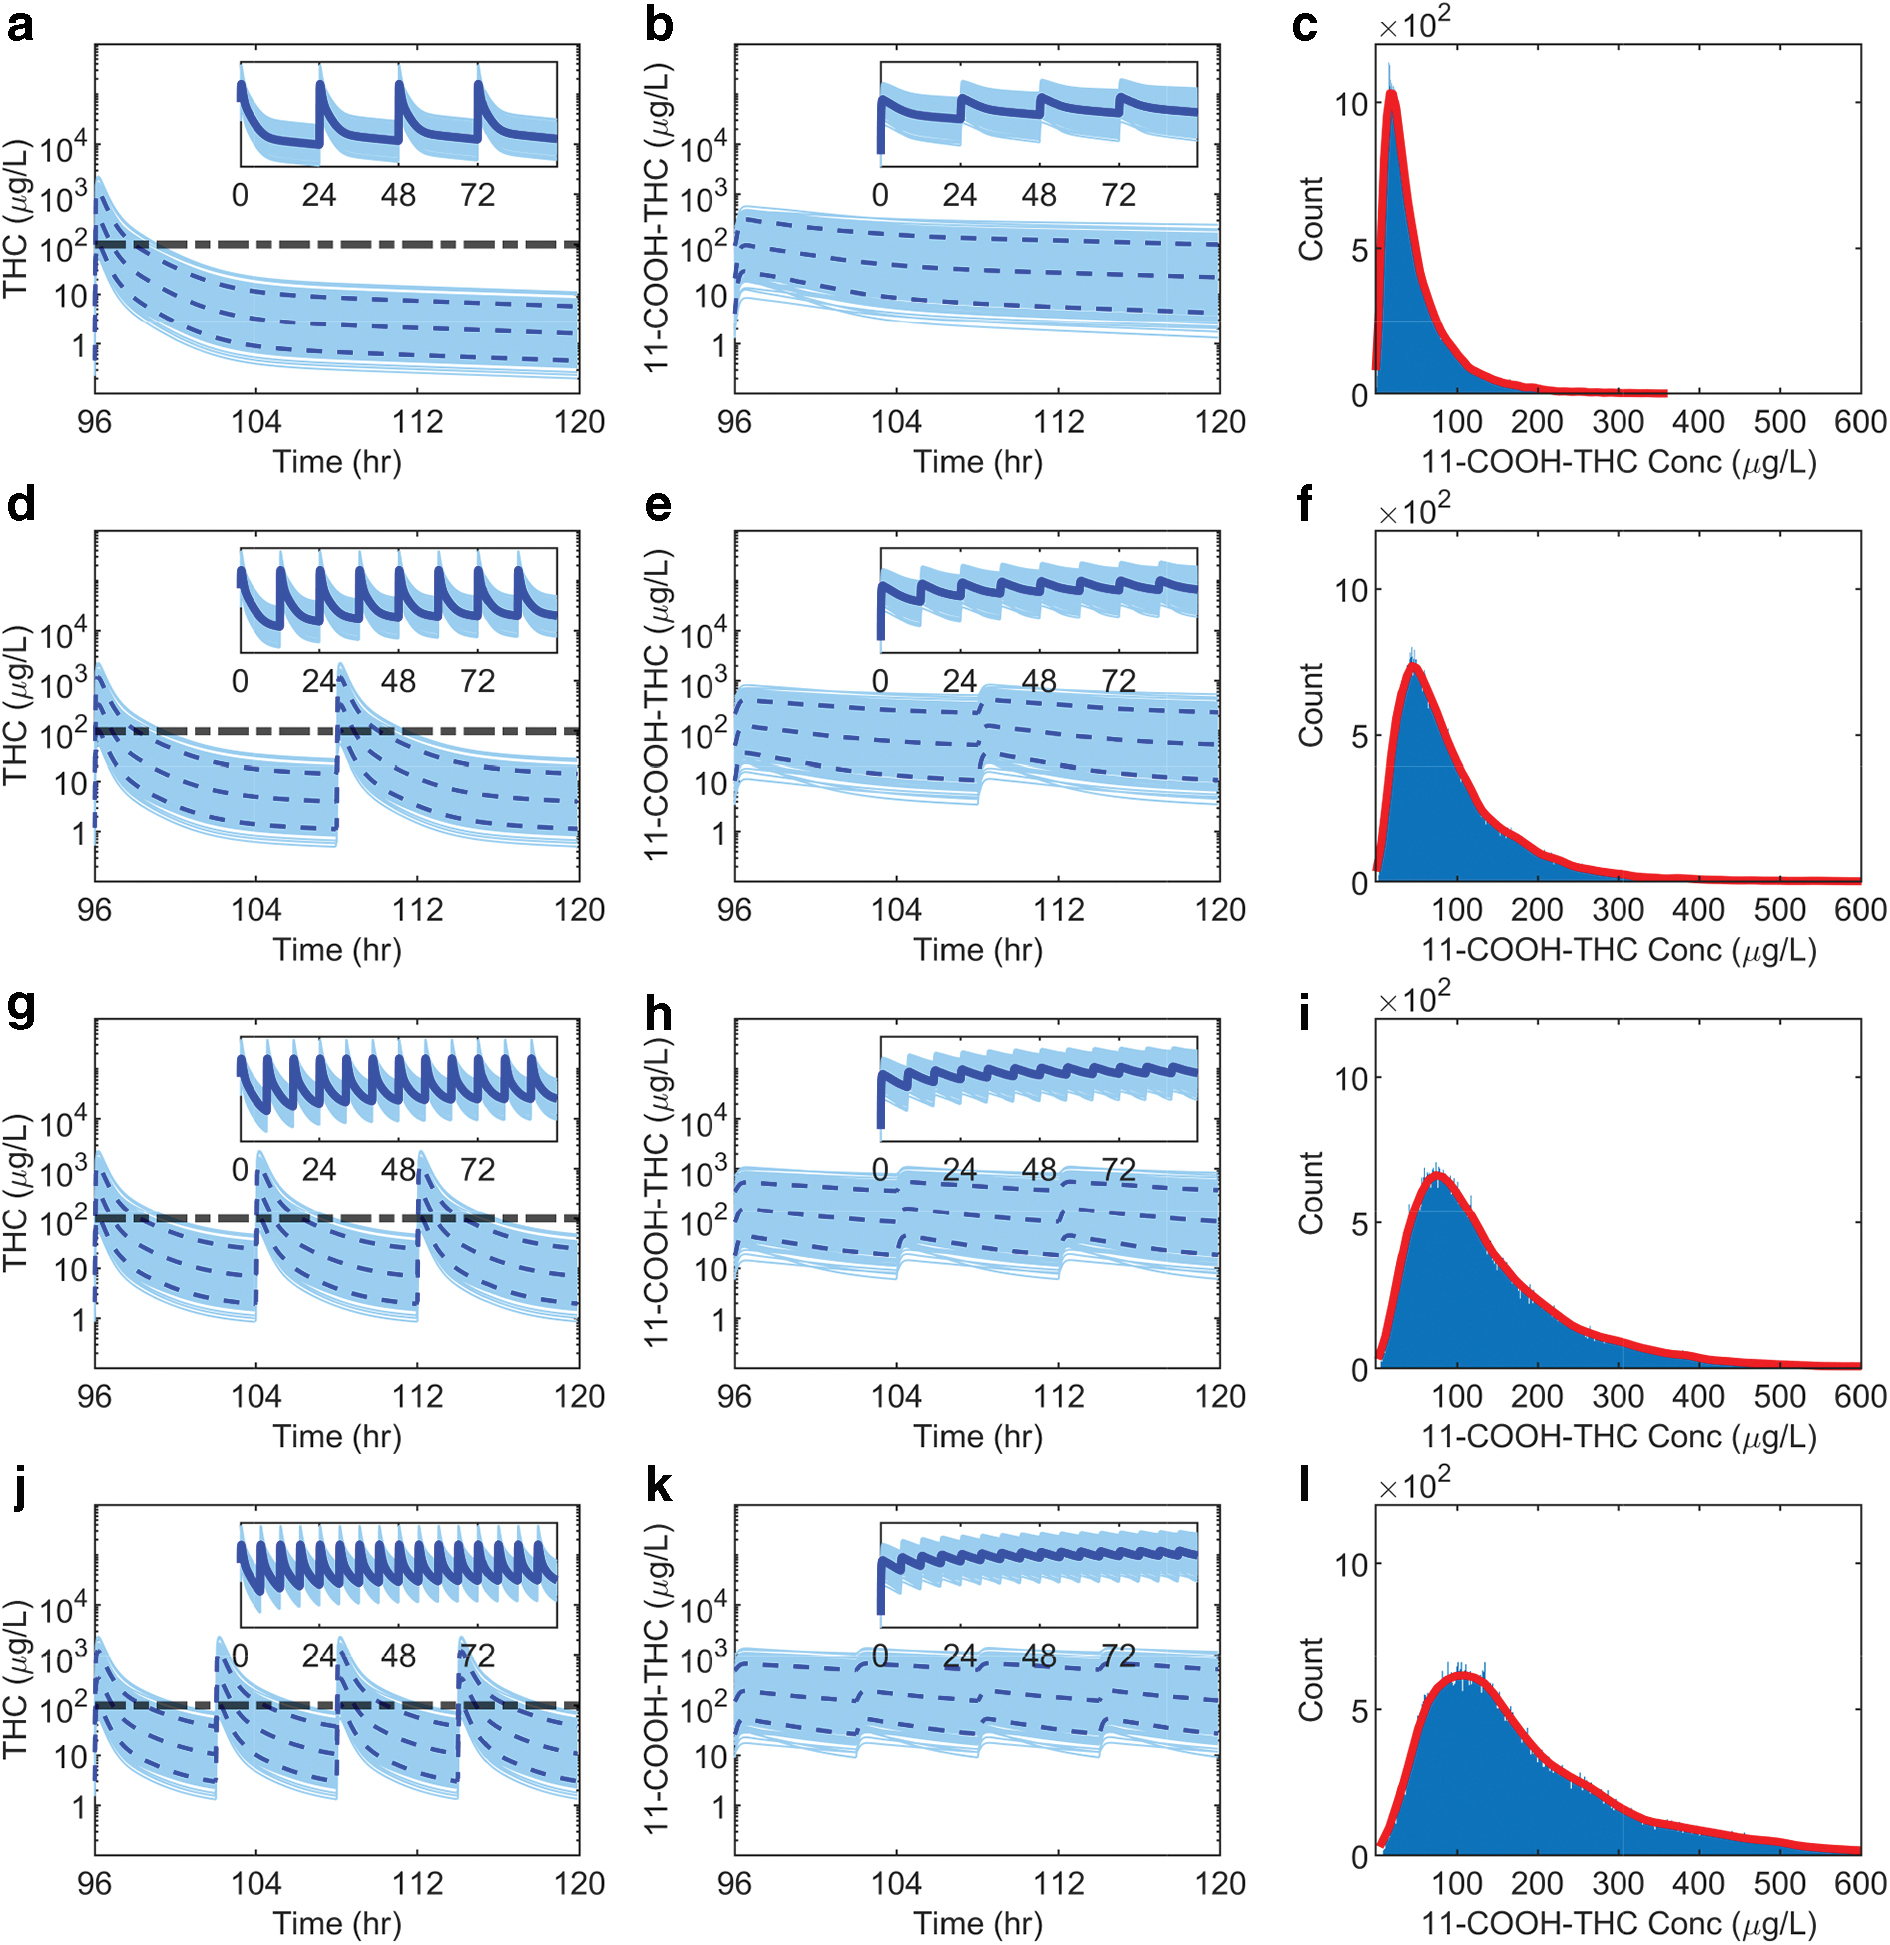
Simulated distribution of steady-state plasma cannabinoid concentrations in different populations of cannabis users.
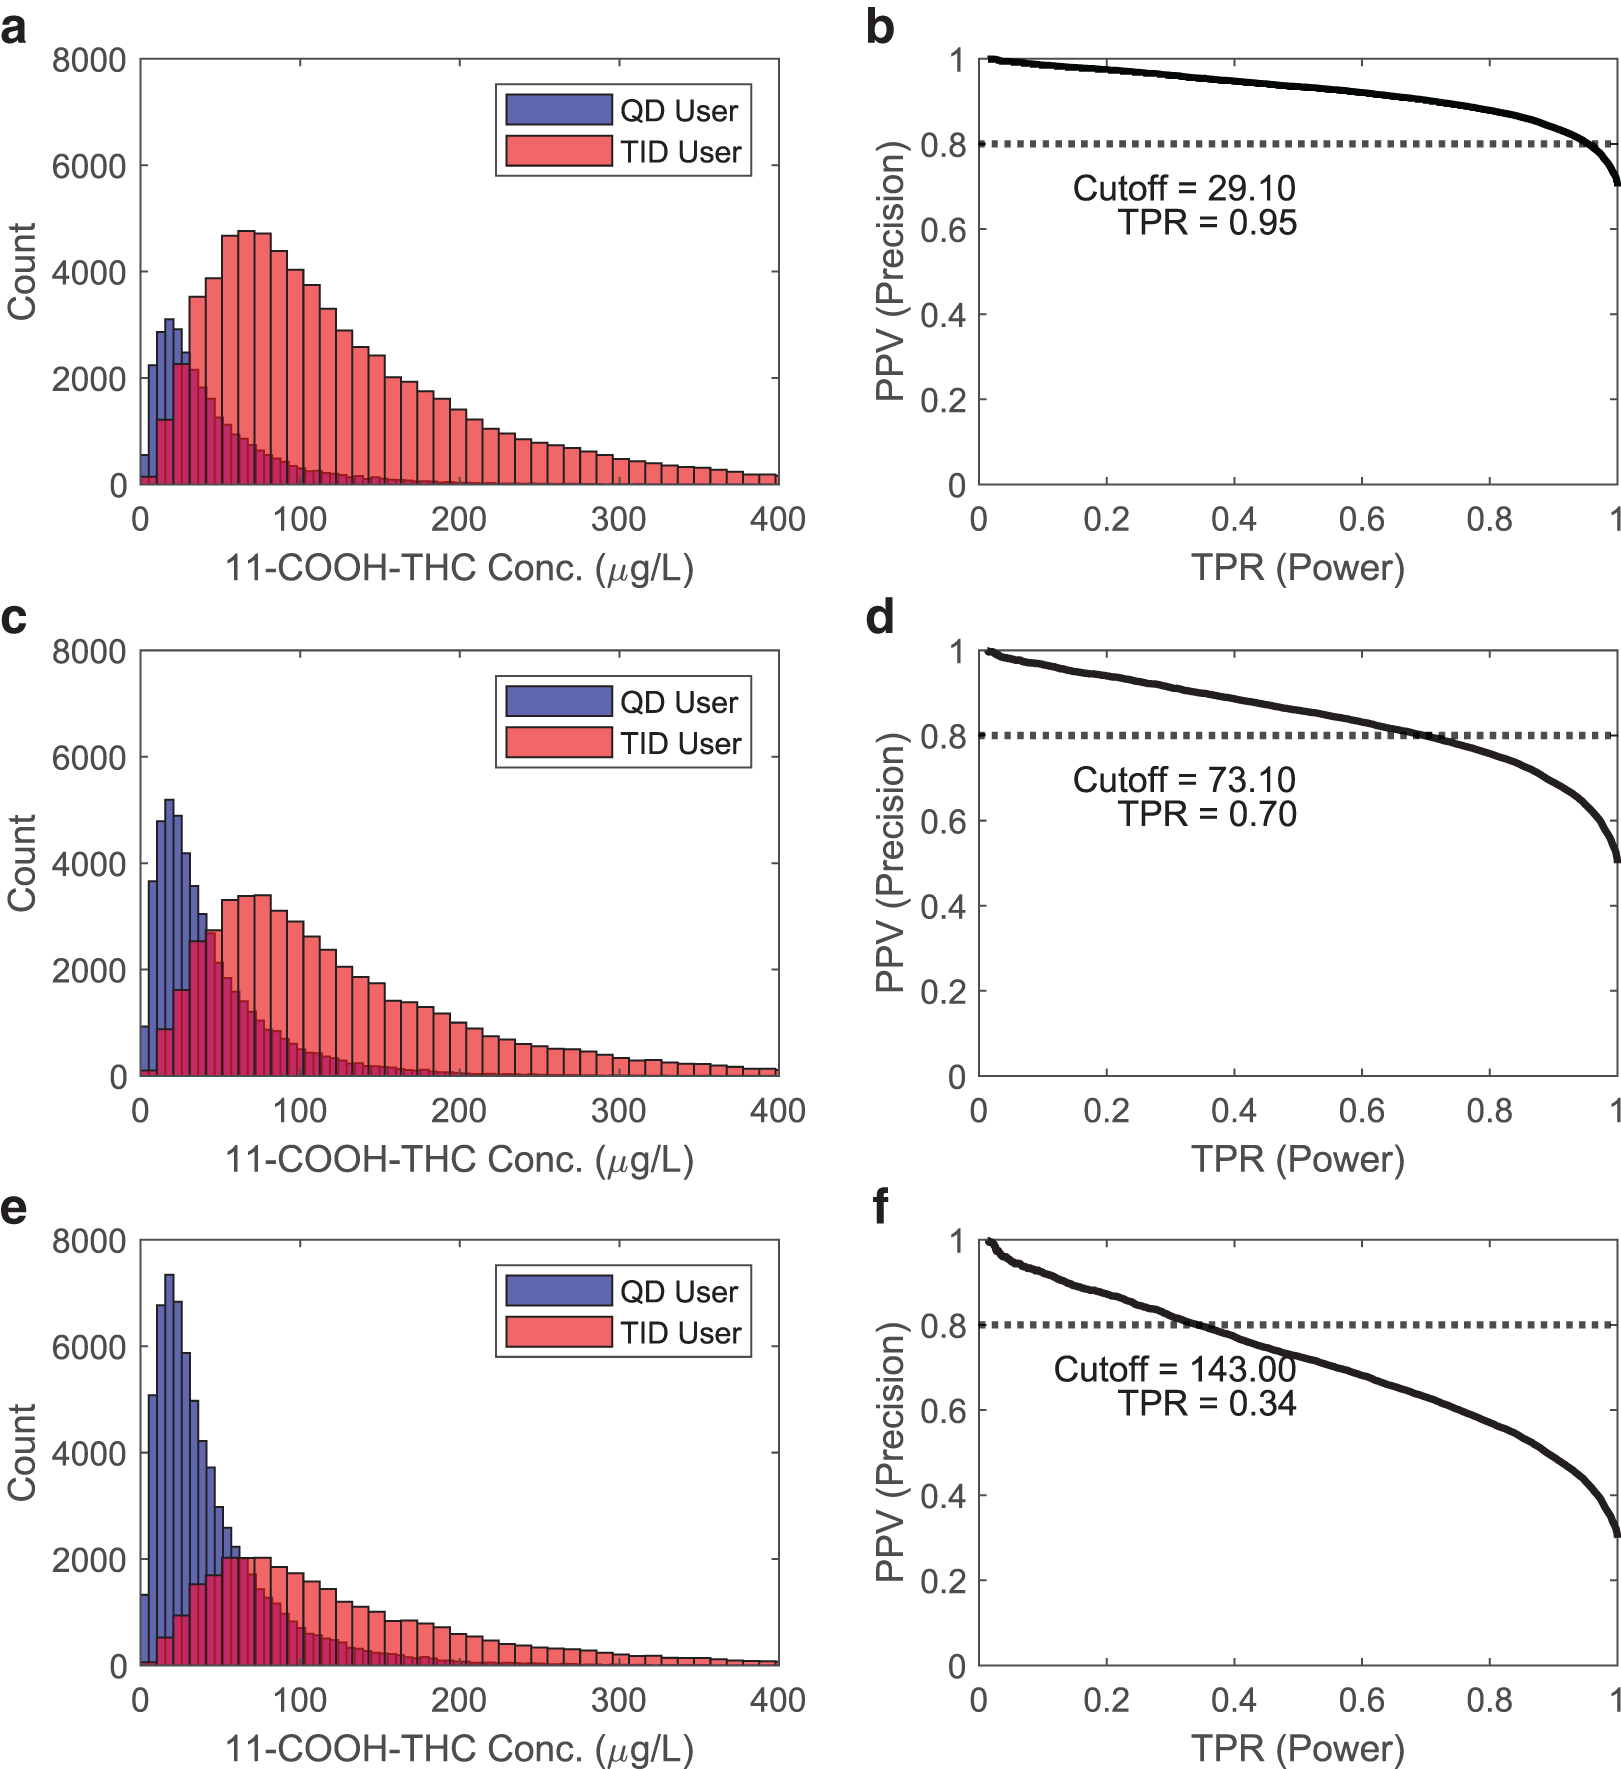
Simulated distributions of steady-state plasma 11-COOH-THC concentrations in mixed THC users. Three different user distributions were simulated and the corresponding precision–recall curves and cutoff values to discriminate TID from QD generated.
Impact of cannabis user classification
The impact of implementation of plasma 11-COOH-THC concentration-based cannabis user classifications on study outcomes was explored by analyzing CD4+ and CD8+ T cell activation data 5 in HIV-infected individuals grouped by different methods. When study participants were grouped based on either self-reported cannabis use or detection of plasma 11-COOH-THC, no differences in activated CD4+ or CD8+ T cells were detected between the groups (Fig. 7).
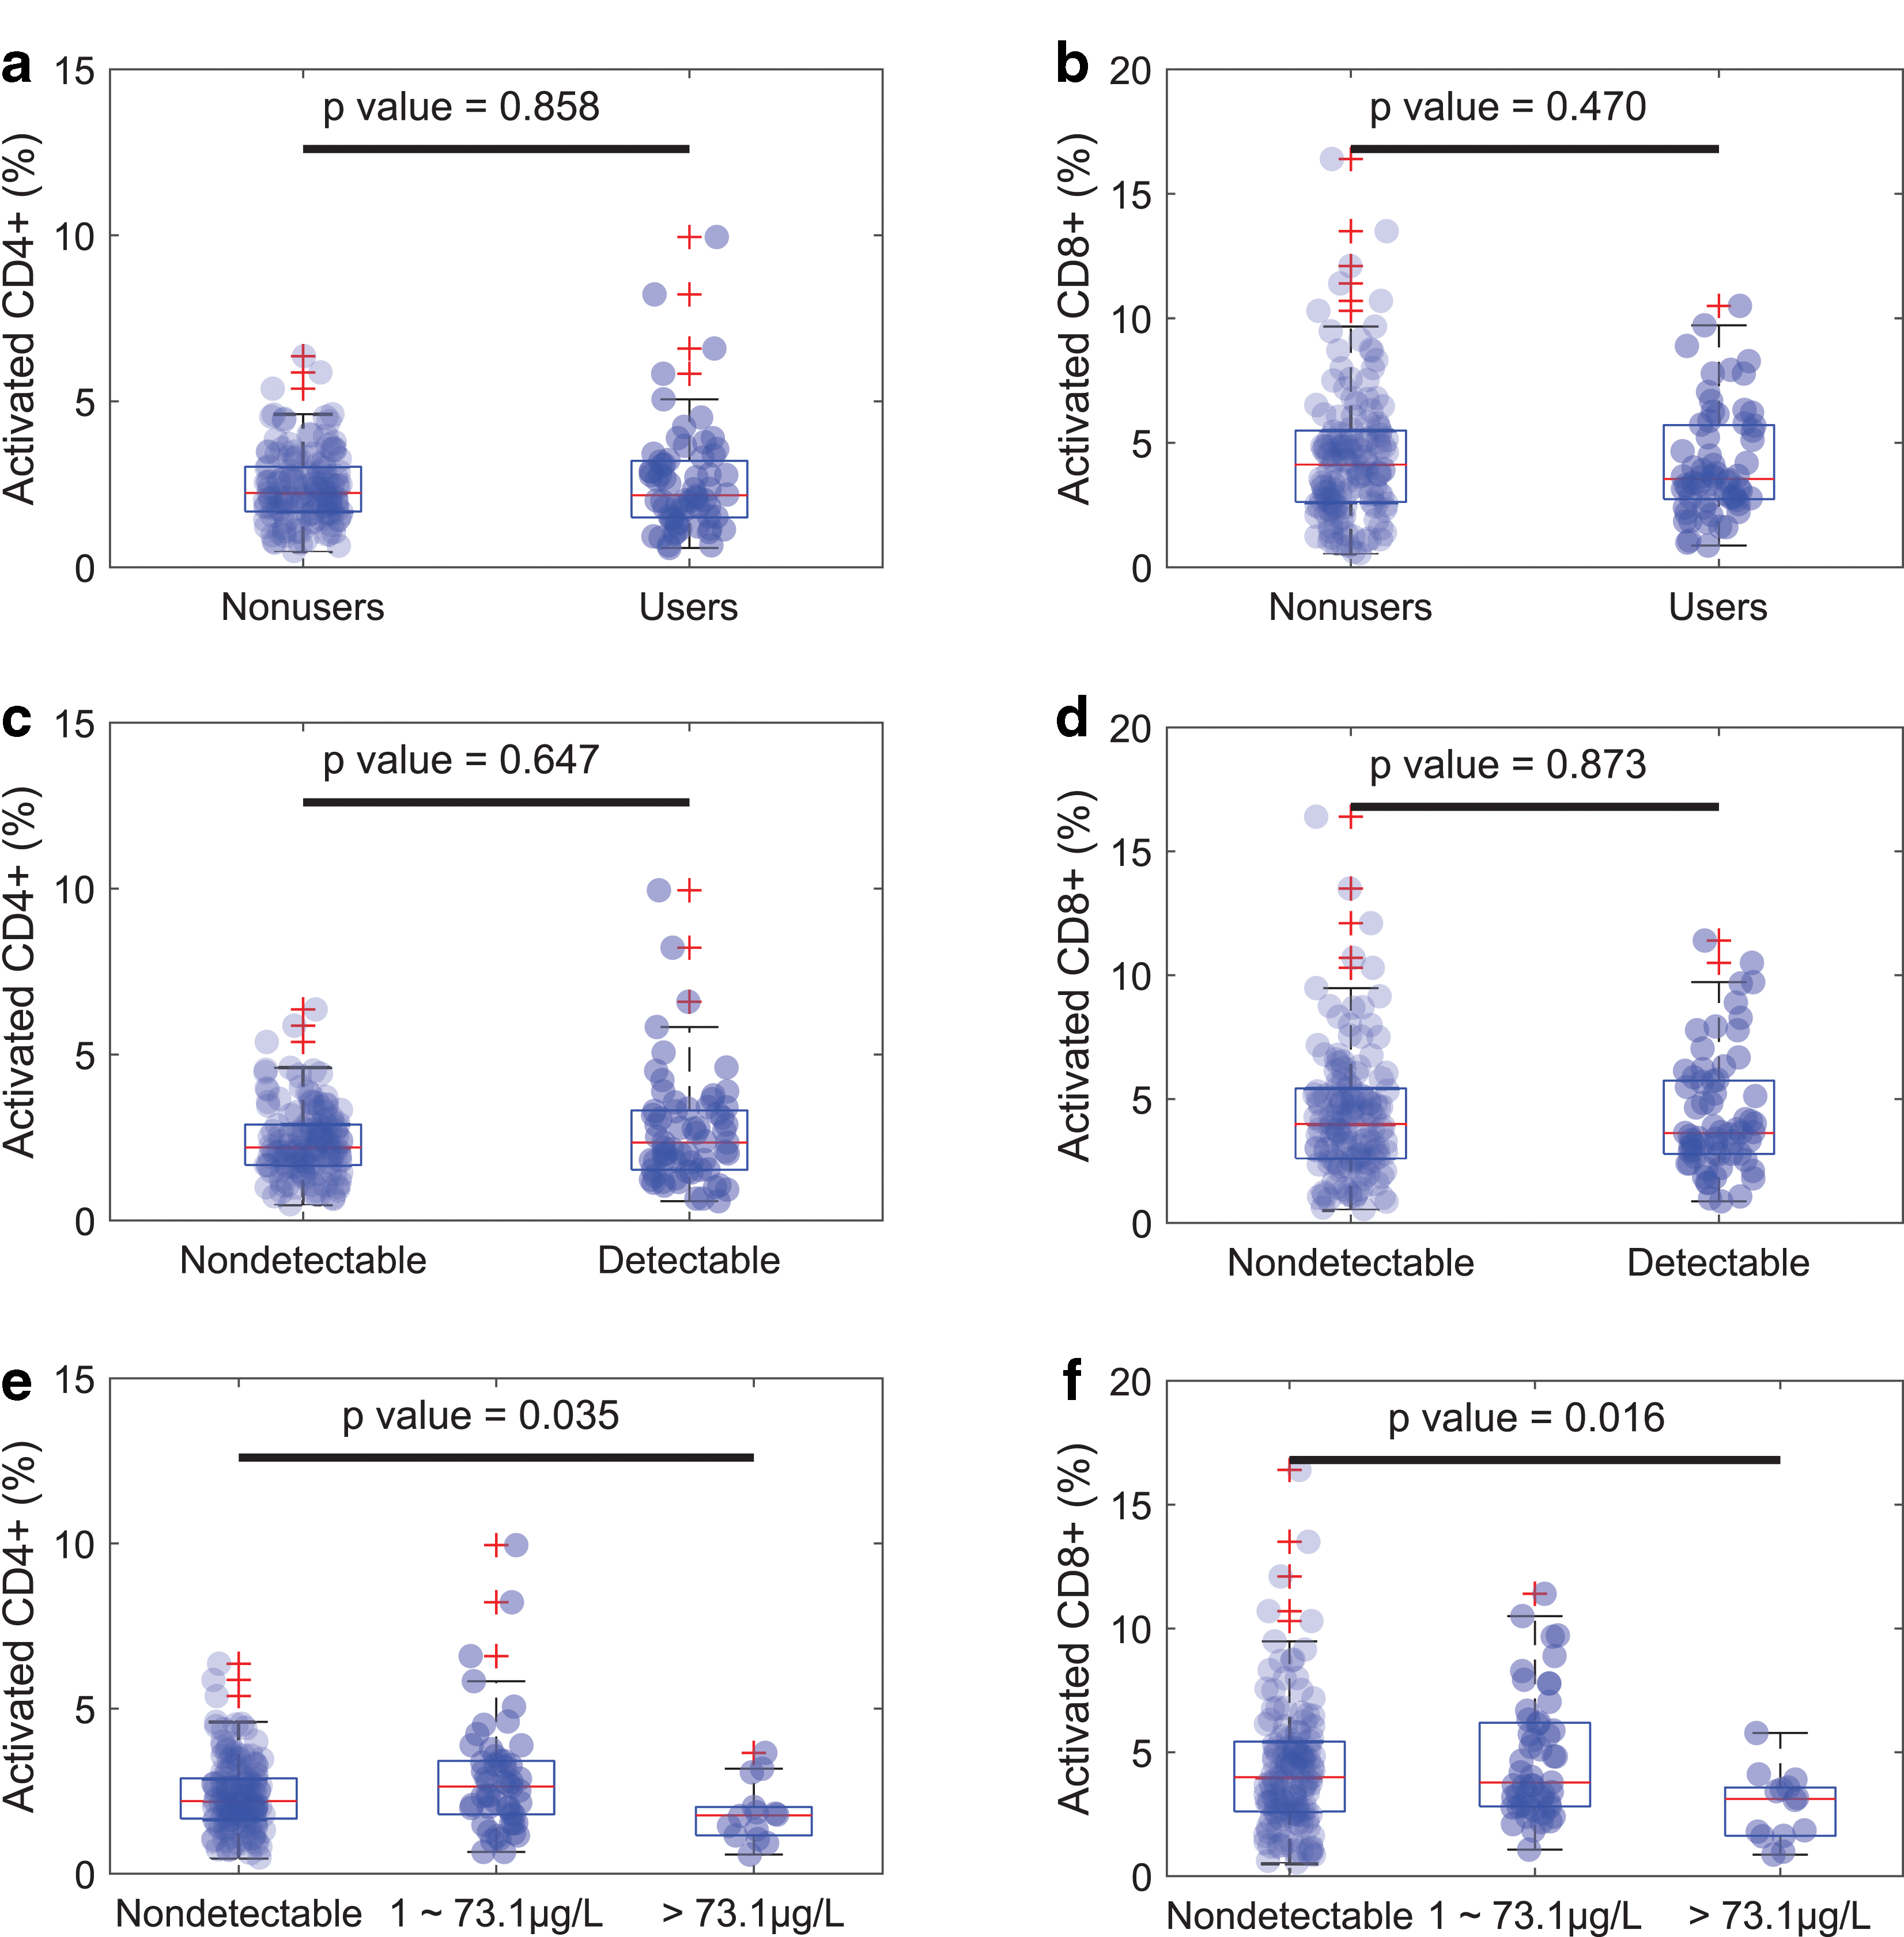
Impact of classification of study populations on detection of altered frequency of activated CD4+ and CD8+ T cells in patients with HIV.
In contrast, when study subjects were grouped to nonusers based on undetectable plasma 11-COOH-THC and to regular or heavy users based on the developed 11-COOH-THC concentration cutoff (73.1 μg/L), a significant decrease in the frequency of activated CD4+ and CD8+ (p=0.035 and 0.016) T cells was observed in the heavy cannabis users compared with nonusers. This shows that objective confirmation of usage level and acknowledgment of exposure–response relationships are critical to identifying potential pharmacological effects of cannabis use.
To assess the impact of error and variability incurred in data analysis due to self-reporting bias or qualitative measurement of cannabis use markers on study outcomes, power calculations were conducted for hypothetical situations where pharmacological effects of cannabis are only manifested in heavy users (Fig. 8). The power analyses show that if the measured outcome follows a dose–response relationship (only heavy cannabis users are responders) and light daily users (nonresponders) are combined with heavy users, detection of pharmacological effects of cannabis becomes challenging even in large studies. In some cases, true effect of heavy cannabis use may not be detectable due to the incurred variability in the mixed-user population (Fig. 8). In contrast, when heavy users (responders) are accurately identified, relatively small numbers of subjects are needed to detect effects. The power analyses of different study populations show that classification of users based on cannabis exposure can significantly improve the statistical power and reduce the number of subjects needed to detect pharmacological effects of cannabis.
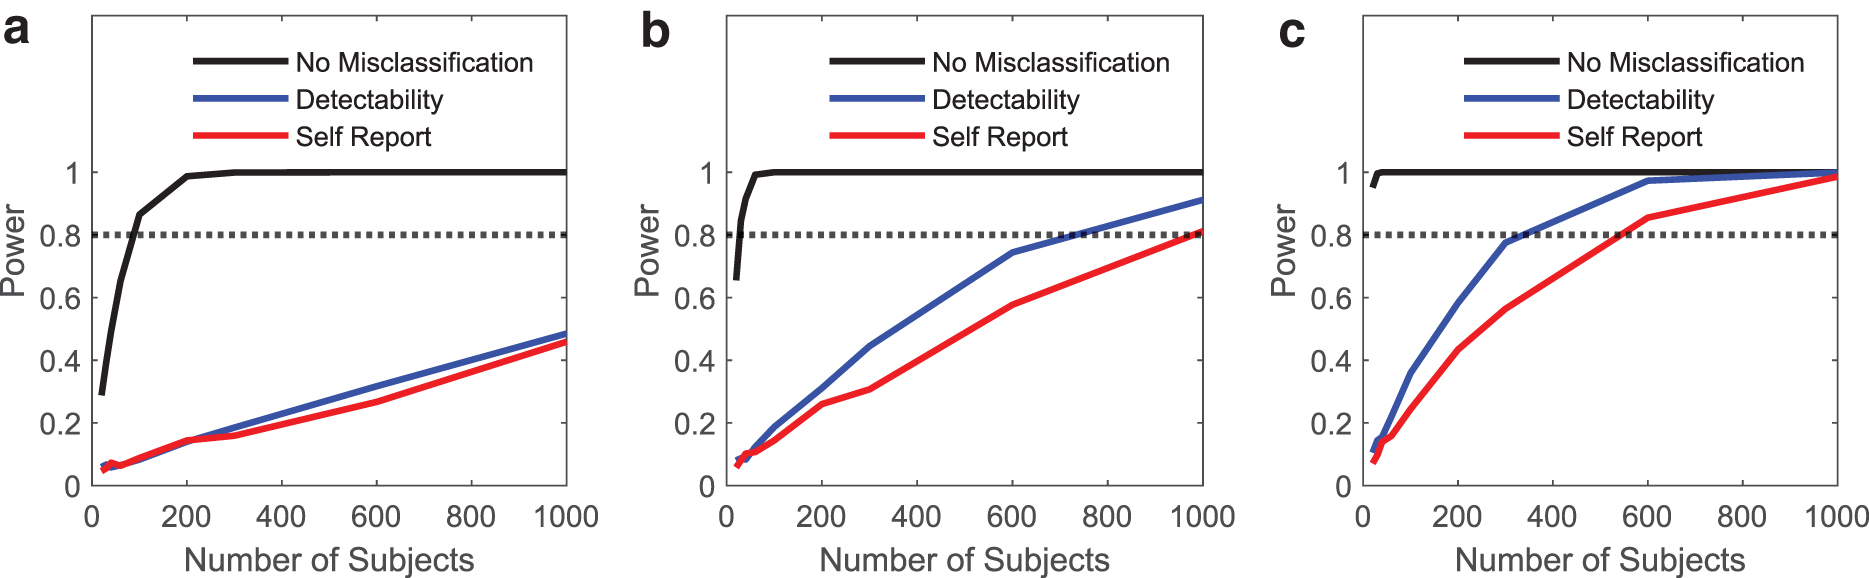
Power analyses for prospective clinical studies to detect cannabis effects in mixed usage populations. Three pharmacological effects were considered for which heavy cannabis use was assumed to produce an effect with effect sizes (δ) 0.25
Discussion
The therapeutic and toxicological effects of cannabis are controversial and ill-defined in many areas despite the prevalent use of cannabis.4,6,8 For example in IBD, a small pilot study found that chronic cannabis use decreased serum C-reactive protein to normal concentrations, 33 whereas a placebo-controlled study did not measure such dramatic decrease. 34 Similarly, investigations of the impact of cannabis use during pregnancy have yielded discrepant results on the type and severity of cannabis effects on developmental outcomes. 14 These discrepancies are likely largely explained by differences in cannabis use and how it is assessed.
The frequency and quantity of cannabis use, whether recreational or medicinal, varies considerably with heaviest users consuming more than 20 standard joint equivalents (SJE, 0.5 g of cannabis per joint) a day and ∼30% of users consuming only 1–2 SJEs a month 30 resulting in a heterogeneous user population. Many studies employ self-reporting to classify users, which is prone to high false positive (5–36%) and false negative (1–7%) rates, with an overall honest response of ∼90%.9,10 In the current study, 17% of self-reported nonusers had detectable plasma CBs. The CB detected was primarily 11-COOH-THC-glucuronide, present in 96% of these subjects followed by 11-COOH-THC (in 17%). Of self-reported daily users, 14% had no detectable plasma THC, and in these subjects, 11-COOH-THC concentrations were either undetectable (<1 μg/L, n=3) or low (1.8–7.4 μg/L, n=6). This self-reporting bias is striking as the subjects self-administered the questionnaire to avoid perception of any stigma and minimize known self-reporting bias.9,10
Our analysis, shows that reporting bias causes loss of statistical power (Figs. 7 and 8). The commonly used method of confirmation of cannabis use via detection of plasma and urinary CBs such as THC and 11-COOH-THC19,35–38 only marginally improves the power of studies testing for effects of cannabis if only heavy users show a response (Figs. 7 and 8). The qualitative classification of users/nonusers prevents assessment of dose–response relationships, a fundamental tenet of clinical pharmacology and toxicology, and results in user populations with variable THC exposures due to the dramatic variability in reported 30 usage.
Majority of clinical effects of THC are expected to follow classic dose/exposure–response relationship as shown in both animals and humans.39–43 Thus, the effects of cannabis are predicted to be greater in heavy multiple times a day users than in light once daily users or occasional users. As such, a simple user/nonuser identification is insufficient to elucidate pharmacological effects, as illustrated by the lack of detectable effects in T cell activation in HIV-infected individuals grouped based on plasma CB detection (Fig. 7). It is likely that other pharmacological outcomes are subject to similar limitations. Our results suggest that in studies that assess the effects of cannabis, study participants should be grouped based on usage level that ideally is objectively assessed based on plasma 11-COOH-THC concentrations.
This study developed cutoff values for 11-COOH-THC concentrations that would allow identification of a presumed responder group within a heterogeneous user population to enable testing of hypotheses on whether cannabis use results in a specific pharmacological outcome. The responder group in the current study was assumed to be a cannabis user group who would maintain THC concentrations above the CB receptor EC50 (Fig. 5) similar to chronic dosing of medications. A THC dose of 60 mg per consumption was used as a basis of the current model.
THC concentrations change considerably after smoking due to rapid decline in THC concentrations, the use of THC concentrations as biomarker is confounded by lack of knowledge of the time since last cannabis use. In contrast, 11-COOH-THC concentrations have minimal fluctuation in plasma concentrations after frequent cannabis use due to the long half-life of 11-COOH-THC. Hence, 11-COOH-THC was chosen as the plasma biomarker of THC exposure due to its long half-life. Several other studies have also used plasma 11-COOH-THC for categorizing cannabis use,19,29 but none has been applied for clinical studies.
In developing the 11-COOH-THC cutoff value, interindividual variability in THC and its metabolite disposition within a user population was addressed via population PK modeling, and the variability in usage patterns was considered through the Monte Carlo simulations. The developed 11-COOH-THC cutoff value was applied to a retrospective clinical data set (Fig. 7), demonstrating the importance of acknowledging dose–response effects and usage patterns in cannabis pharmacology.
The proposed modeling-based approach with specific population distribution for usage types could be expanded to enrich “true-responders” within any clinical population, although the cutoff value used should be carefully chosen based on user distribution and cannabis strength available in a given study. The cutoff value of 73.1 μg/L is optimal for populations with equal QD and TID users or under circumstances where usage patterns are not known. However, as shown in Figure 6, if a study population consists mainly of QD users or TID users, a different cutoff value should be considered assuming that inappropriate user distribution may lead to misclassification of large number of participants. To mitigate this possibility, historical data of usage patterns or self-reporting may be implemented to define cutoff values for a specific study. The developed model may not directly apply to other routes of cannabis consumption such as edibles or extended range of THC dosage levels but can be expanded with refining parameters for bioavailability, absorption rate, and first-pass metabolism. To improve the robustness of the cutoff values, data from prospective studies are needed to further validate the model-based approach.
In conclusion, these results demonstrate the feasibility of applying PK principles to infer cannabis use patterns from single plasma 11-COOH-THC concentration, in place of the standard of self-reporting. The modeling workflow and statistical approach will improve the power and rigor of studies of effects of cannabis use.
Footnotes
Author Disclosure Statement
N.I. reports consultancy agreements with Boehringer Ingelheim, Johnson & Johnson, and Xenon Pharmaceuticals; honoraria from the National Institutes of Health; and as Associate Editor with Clinical and Translational Science and Drug Metabolism and Disposition. All other authors declared no conflicts interests relating to this work.
Funding Information
This work was supported by grants from the National Institutes of Health: National Institutes of Drug Abuse grant DP1DA037979-01 to N.R.K. and P01DA032507 to N.I., and National Institute of Allergy and Infectious Diseases grant P30AI027763 to J.N.M. and K01OD024876 to J.A.M.

Abbreviations Used
References
Supplementary Material
Please find the following supplemental material available below.
For Open Access articles published under a Creative Commons License, all supplemental material carries the same license as the article it is associated with.
For non-Open Access articles published, all supplemental material carries a non-exclusive license, and permission requests for re-use of supplemental material or any part of supplemental material shall be sent directly to the copyright owner as specified in the copyright notice associated with the article.
