




Abstract
Introduction:
Autism spectrum disorder (ASD) is a group of heterogeneous neurodevelopmental conditions affecting social communication and social interaction. Medical cannabis (MC) treatment shows promising results as an approach to reduce behavioral difficulties, as determined mainly by subjective observations. We have recently shown the potential of cannabis-responsive biomarkers detected in saliva of children with ASD to objectively quantify the impact of successful MC treatment using a metabolomics approach. Since the pathology of ASD is associated with abnormal lipid metabolism, we used lipidomics on the same samples to (1) expand the repertoire of cannabis-responsive biomarkers and (2) provide preliminary insight into the role of MC on lipid metabolism.
Materials and Methods:
Saliva samples collected from children with ASD (n=15) treated with MC (both before and at the time of maximal impact of treatment) and an age-matched group of typically developing (TD) children (n=9) were subjected to untargeted lipidomics. The study was observational. Each child from the ASD group was receiving a unique individualized MC treatment regimen using off-the-shelf products as permitted by California law under physician supervision for at least 1 year. Doses of tetrahydrocannabinol (THC) ranged from 0.05 to 50 mg and cannabidiol (CBD) from 7.5 to 200 mg per treatment. The ASD group was evaluated for signs of improvement using parental brief Likert scale surveys.
Results:
Twenty-two potential lipid-based cannabis-responsive biomarkers exhibiting a shift toward the TD physiological levels in children with ASD after MC treatment were identified. Members from all five lipid subclasses known to be present in saliva were characterized. Preliminary lipid association network analysis suggests involvement of two subnetworks previously linked to (1) inflammation and/or redox regulation and (2) oxidative stress. The significant changes in sphingomyelin in this study and in N-acetyl-aspartate (NAA) previously detected in the metabolomics analysis of the same saliva samples may indicate a role of MC in neuron function.
Conclusions:
Our findings suggest that lipid metabolites in saliva can potentially serve as cannabis-responsive biomarkers and objectively quantify the impact of MC treatment, and indicate a possible mechanism of action for MC. This preliminary study requires further investigation with a larger population and appropriate clinical trial monitoring.
Introduction
Autism spectrum disorder (ASD) is characterized as a set of social interaction and communication disorders with defined stereotyped patterns of behavior. 1 As such, both screening and evaluation of treatment rely on the observation of ASD characteristics, including social interaction, language and communication deficits, and repetitive behaviors. 2 This subjective type of diagnosis is highly dependent on the expertise of a qualified clinician (developmental pediatrician, neurologist or psychologist) and on the communication abilities of the child, 3 and does not objectively assess the impact of the treatment or the underlying pathophysiology of ASD.
Organelle morphology and cellular metabolism such as mitochondria dysfunction, 4 altered lipid signaling and metabolism, 5 neuroinflammation, 6 and oxidative stress 7 have been linked with the pathophysiology of ASD. For example, abnormalities in mitochondria morphology 8 and mitochondria-endoplasmic reticulum contact sites (MERCS) that regulate lipid signaling and metabolism through physical and functional interactions 9 are associated with ASD, Parkinson's disease (PD), Alzheimer's disease (AD), and amyloid lateral sclerosis (ALS).
Lipid homeostasis is essential for maintaining proper structure and function of the central nervous system (CNS). 10 On a dry weight basis, ∼50–60% of the brain is lipids, including phospholipids, sphingolipids, and cholesterol, providing cell–cell interaction, cell adhesion and migration at the intercellular level, and membrane structure and fluidity, and signaling at the intracellular level. Lipid-based signaling includes sphingolipids, a competitive antagonist of the cannabinoid receptor 1 (CB1) 11 ; lyso-platelet-activating factor (Lyso-PAF) to mediate inflammation response 12 ; and the fatty acid (FA) amide/endocannabinoid linoleoyl ethanolamide (LEA), which activates the peroxisome proliferator-activated receptor alpha (PPARα) and weakly binds to CB1 and CB2. 13
Aberrant lipid metabolism is well documented and highly linked with ASD,5,14 and impaired lipid profiles of arachidonic acid (AA), eicosapentaenoic acid (EPA), and docosahexaenoic acid (DHA) were found in patients with ASD and in ASD animal models. This pathophysiology can be characterized by increased lipid peroxidation accompanied by decreased antioxidant capacity in which membrane phospholipids are the main target, resulting in neuronal dysfunction.
Strong linkage between lipid metabolic profiles and abnormalities of mitochondria structure and function, MERCS structure and contents, and ASD suggests lipids may be utilized as metabolic biomarkers to objectively evaluate the impact of treatment on the behavior and pathophysiology of ASD, but would require an invasive diagnostic procedure. 8
Lipidomics is a rapidly growing subfield of metabolomics in which the products of lipid metabolism are analyzed and characterized to determine their function and provide insight into the physiology and pathophysiology of biological processes.15,16 Untargeted lipidomics generates lipid profiles that detect and analyze in an unbiased approach as many lipids as possible between cohorts, treatment, and/or time points. This type of fingerprinting of lipid changes can indicate the impact of treatment on pathophysiological disorders.
The recent progress in extraction, separation, and detection techniques advanced saliva as a noninvasive diagnostic biofluid for lipidomics. Saliva is a complex fluid containing hydrophilic and hydrophobic metabolites that correlate well with plasma. 15 Metabolite concentrations in saliva are directly affected by both genetics and environmental factors such as gender, medical condition, emotional state, and physical activity. 17 FAs, glycerolipids, phospholipids, sphingolipids, and sterol lipids are the five major lipid groups in saliva, with documented abnormal content and composition in patients with diagnoses such as cystic fibrosis and Sjogren's syndrome.
Medical cannabis (MC) treatment has shown promising results in effectively treating children with ASD using a single cannabinoid, dronabinol, the synthetic form of delta-9-tetrahydrocannabinol (Delta 9 THC), 18 and whole plant extracts that contain tetrahydrocannabinol (THC) and cannabidiol (CBD). 19 However, the limitation of behavioral surveys and the lack of pharmacokinetic and pharmacodynamic data in a population with marked heterogeneity, such as ASD, often result in inconclusive findings and suggest the need for larger sample sizes.
Recently, we have demonstrated the potential of pharmacometabolomics-based cannabis-responsive biomarkers to objectively quantify the impact of MC treatment in 15 children with ASD in an observational evaluation. 20 Using untargeted lipidomics, we expanded the discovery of cannabis-responsive biomarkers to additional specific subclasses of lipid biomarkers. Our goals for this investigation were to (1) provide additional lipid-based data to support the concept that cannabis-responsive biomarkers can objectively quantify the impact of MC treatment and (2) demonstrate the importance of lipid-based cannabis-responsive biomarkers to provide insight into the mechanism of action (MOA) of active cannabinoids on symptoms of ASD.
Materials and Methods
Detailed descriptions, including participants, study design, data analysis, and behavioral evaluation, were previously described in Siani-Rose et al. 20 Only a brief description is provided below.
Participants
Ethical approval for an observational study of the ASD group, ages 6–12, treated with MC for at least 1 year and the age-matched typically developing (TD) group, was obtained from the Institutional Review Board, Ethical and Independent Review Services (ref. 20114-01X). Consent was obtained from parents of all participating children and assent was obtained from children in the TD control group.
ASD group participants were recruited through Canna-Centers Wellness & Education (Lawndale, CA) or Whole Plant Access for Autism (WPA4A, a 501c3 nonprofit company, Canyon Lake, CA). Participants were diagnosed by a qualified medical or behavioral health clinician, and treated with MC supervised by physician, as permitted by California law, with doses up to three times per day.
The inclusion criteria for the ASD group were as follows: (1) ASD diagnosed by a qualified medical or behavioral health clinician (e.g., psychologist, psychiatrist, or pediatrician); (2) MC treatment under physician supervision; (3) age between 6 and 12; and (4) ability to donate saliva without discomfort using the passive drool method and providing up to four samples. The exclusion criteria were as follows: (1) children who require cannabis more frequently than every 8 h; (2) traumatic brain injury with any known cognitive consequence or loss of consciousness for more than 5 min; and (3) diagnosed with epilepsy.
Participants in the TD group were recruited through a San Francisco online parent group and the inclusion criteria were as follows: (1) no special education needs and (2) no individual or immediate family member diagnosed with developmental disabilities.
Study design
The ASD group was not treated with MC for at least 8 h before the study, and avoided high sugar, acid and caffeine content 1 h before saliva collection (Fig. 1, Supplementary Fig. S1). Saliva samples were collected (Salimetrics, Carlsbad, CA) using the Passive Drool Collection Kit in the morning before MC treatment (“PRE”) and when treatment reached maximal impact according to parents, about 90 min later (“PEAK”). TD group provided one saliva sample in the morning. A detailed description of the study design is provided in Supplementary Data and in Siani-Rose et al. 20

Overall effect of MC treatment on z-score values of potential cannabis-responsive biomarkers. Proportion of z-score values at PRE and PEAK is indicated in dark blue (±0.5 SDEV) and light blue (±1.0 SDEV) considered physiological range, while dark red (less than −0.4 or greater than +0.4 SDEV) is significantly out of physiological range determined by the calculated value for TD group. MC, medical cannabis; SDEV, standard deviation; TD, typically developing.
Untargeted metabolic profiling of lipids (lipidomics)
Saliva samples were collected and immediately stored temporarily (up to 24 h) at −20°C, and then at −80°C. Lipidomics was performed using rapid resolution liquid chromatography–time-of-flight-mass spectrometry by Human Metabolome Technologies, Inc. (HMT, Tsuruoka, Japan) and processed as previously described. 20
Briefly, supernatant of centrifuged (2,300×g, 4°C, 5 min) samples (60 μL) and 4 μM internal standards (40 μL Milli-Q water and 300 μL methanol) were desiccated, resuspended (200 μL of 50% isopropanol and Milli-Q water), and immediately analyzed using Agilent 1200 series RRLC system SL (Agilent Technologies, Inc., Santa Clara, CA) and ODS column, 2×50 mm, 2 μm (Agilent Technologies, Inc.). Peak extraction, normalization for migration time shift and intensity, difference detection, and clustering visualization were conducted using automatic integration software MasterHands ver. 2.18.0.1 developed at Keio University developed by Sugimoto et al. 21
Data analysis
To identify potential lipidomics-based cannabis-responsive biomarkers in saliva, we: (1) identify metabolites that change [(PEAK − PRE)/PRE] using CountPatientDiffUpDowns algorithm; (2) select all metabolites that exhibit twofold change in 70% of the children with ASD; (3) sort by calculating the impact of MC treatment using the number of standard deviation (SDEV; z-scores) against the metabolite's mean value in TD control group using the ComparePatientToNeurotypic algorithm; (4) select all potential cannabis-responsive biomarkers showing beneficial impact of MC treatment, namely values >2 or −2 at PRE that changed to values lesser than 1 or −1 at PEAK; and (5) determine statistical significance at p<0.05 using paired t-test analysis.
Both CountPatientDiffUpDowns and ComparePatientToNeurotypic algorithms were developed by Cannformatics, Inc. (San Francisco, CA), and previously described in Siani-Rose et al. 20
Parents of the ASD group and TD control group completed standardized rating forms about their child's social, emotional, and behavioral functioning: The Adaptive Behavior Assessment System, Third Edition (ABAS-3) 22 ; Behavior Assessment System for Children, Third Edition (BASC-3) 23 ; and Social Responsiveness Scale, Second Edition (SRS-2). 24
The ASD group also completed brief Likert scale surveys capturing observational parent report of frequency and/or severity of pre-identified behaviors and/or social-emotional functioning at time points corresponding to saliva collection (PRE and PEAK) to assess the impact of MC treatment. A summary of standardized and observational behavioral ratings is described briefly in the Supplementary Data and in detail in Siani-Rose et al. 20
Lipid-lipid interaction and cannabinoid-lipid interaction in response to MC treatment at PRE and PEAK MC treatment were determined by lipid association network, based on the correlation analysis of all lipids (n=22) described in Table 1. z-Scores of the potential cannabis-responsive biomarkers were obtained by calculating the number of SDEVs of PRE and PEAK against the metabolite's mean value in the TD control group.
Classification of Salivary Potential Lipid Cannabis-Responsive Biomarkers
Salivary lipids were classified according to Fahy et al. 26 Potential lipid cannabis-responsive biomarkers exhibiting statistically significant changes in the study are in italics.
15(S)-HETE-2, 15-hydroxyeicosatetraenoic acid; DHA, docosahexaenoic acid; FA, fatty acid; LCAC, long-chain acylcarnitine; LEA, linoleoyl ethanolamide; LPC(18:0), lysophosphatidylcholine; LPE(18:1)-1, lysophosphatidylethanolamine-1; LPS(18:0), lysophosphatidylserine; Lyso-PAF, lyso-platelet-activating factor; Lyso-PPC, lysophosphatidylcholine; MUFA, monounsaturated fatty acid; PUFA, polyunsaturated fatty acid.
The absolute difference between the PRE z-score measurement and the PEAK z-score measurement for each participant was calculated using the Microsoft excel formula “=IF(pre>post, Min(pre,post) - Max(pre,post), Max(pre,post) - Min(pre,post)).” This formula measures absolute differences from lower z-score to a higher z-score. Results, including Šidák correction, were analyzed using Wizard 2 Version 2.0.9 (256) (Evan Miller, Chicago, IL).
Correlation between biomarkers was carried out with Wizard 2 using Pearson correlation and adjusting the p-value to account for the multiple comparisons through the Šidák correction, a more exact version of the Bonferroni correction. 25 The comparison consisted of 22 biomarkers, resulting in 231 comparisons needing adjustment. Correlation between biomarkers and cannabinoids present without potency values was carried out with Wizard 2 using Pearson correlation and adjusting the p-value to account for the multiple comparisons through the Šidák correction. The comparison consisted of 22 biomarkers compared to 6 cannabinoids, resulting in 132 comparisons needing adjustment.
Results
We previously described the ASD group participants, treatment and demographics, and TD group participants and demographics in detail. 20 A summary of the participants is provided in Supplementary Data. Briefly, the average age for the ASD and TD groups was 9.4 and 9.3 years, respectively. All children in the ASD group were under long-term MC treatment for over a year. Eighty percent of the children with ASD were treated with products containing THC (0.05–50 mg per treatment), with or without tetrahydrocannabinolic acid (THCA); and 67% with products containing CBD (7.5–200 mg per treatment), with or without cannabidiolic acid (CBDA). The majority (60%) was treated twice per day.
The ASD symptoms were confirmed by parent ratings (SRS-2), and improvement in clinical symptoms in response to MC treatment was confirmed using parent observational surveys completed at PRE and PEAK. TD group did not exhibit clinically significant symptoms consistent with ASD.
Overall impact of MC on the lipid levels of children with ASD
Untargeted lipidomics of two saliva samples collected from children with ASD (n=15) at PRE and PEAK and one saliva sample from TD group (n=9) detected 145 metabolites, in which 100 were classified as lipids and an additional 6 as hydrophobic metabolites, including cortisone, piperine, and riboflavin, described in Supplementary Table S1 (Siani-Rose et al. 20 ). Using CountPatientDiffUpDowns and ComparePatientToNeurotypic algorithms, we identified in our dataset 22 potential lipid-based ASD cannabis-responsive biomarkers, of which 10 (46%) exhibited significant change (p<0.05) (Table 1). Each of these 22 potential biomarkers was identified in 10–15 children with ASD, giving a total of 293 data points.
For each subject with ASD, z-score represents the number of SDEVs of the biomarker levels above or below the mean value of the TD group. Per Figure 1, the z-score range ±0.5 SDEV (dark blue) increased from 13% of lipid metabolites at PRE to 31% at PEAK. For the z-score range beyond 4 SDEVS (red), a decrease from 18% PRE to 5% PEAK was observed. In aggregate, this indicates an overall tightening toward the TD physiologic range with MC treatment. The overall change represents the impact of MC to drive potential lipid cannabis-responsive biomarkers toward the TD physiological levels (±0.5 SDEV).
All the identified 100 lipid metabolites were grouped into 5 lipid classes/subclasses according to Fahy et al. 26 : (1) FAs (58%); (2) phospholipids (26%); (3) sphingolipids (12%); (4) glycerolipids (3%); and sterol lipids (1%) (Table 1).
The 22 potential lipid-based cannabis-responsive biomarkers were detected in all 5 lipid classes/subclasses described above with 4 dominant groups: (1) FAs (40%); (2) phospholipids (23%); (3) sphingolipids (23%); and (4) sterol lipids (5%). Among the potential lipid-based cannabis-responsive biomarkers exhibiting statistically significant changes (p<0.05), the distribution was as follows: (1) FAs (40%), (2) phospholipids (20%), (3) sphingolipids (30%), and (4) sterol lipids (10%).
The comparison between total lipids (metabolite distribution column 1, Table 1) and the statistically significant potential cannabis-responsive biomarkers (metabolite distribution column 3, Table 1) suggests that sphingolipids (12–30%) and sterol lipids (1–10%) respond favorably to MC treatment.
Impact of MC on different classes/subclasses of lipids
Within the statistical limitation of the small sample size in this study, we considered (1) physiological range: −2 SDEV > z-score <2 SDEV and (2) significant: −4 SDEV < z-score >4 SDEV.
Sphingolipids
Sphingolipids are a structurally heterogeneous class of lipids that are highly abundant in the CNS and involved in membrane structure, signaling, regulation, inflammation, neurodegeneration, and CNS development. 27 In this study, we identified five sphingolipid potential cannabis-responsive biomarkers (Table 1). As shown in Figure 2, six subjects (A2, A8, A13, A15, A16, and A18) exhibited high levels (>2 SDEV) of four or five potential cannabis-responsive biomarkers at PRE, while subjects A1 and A3 exhibited low levels (less than −2 SDEV) of sphinganine (SPG). MC treatment reduced the levels of potential cannabis-responsive biomarkers in 94% of subjects at PEAK, but did not affect subject A11's high levels of SPG and sphingosine (d18:1).
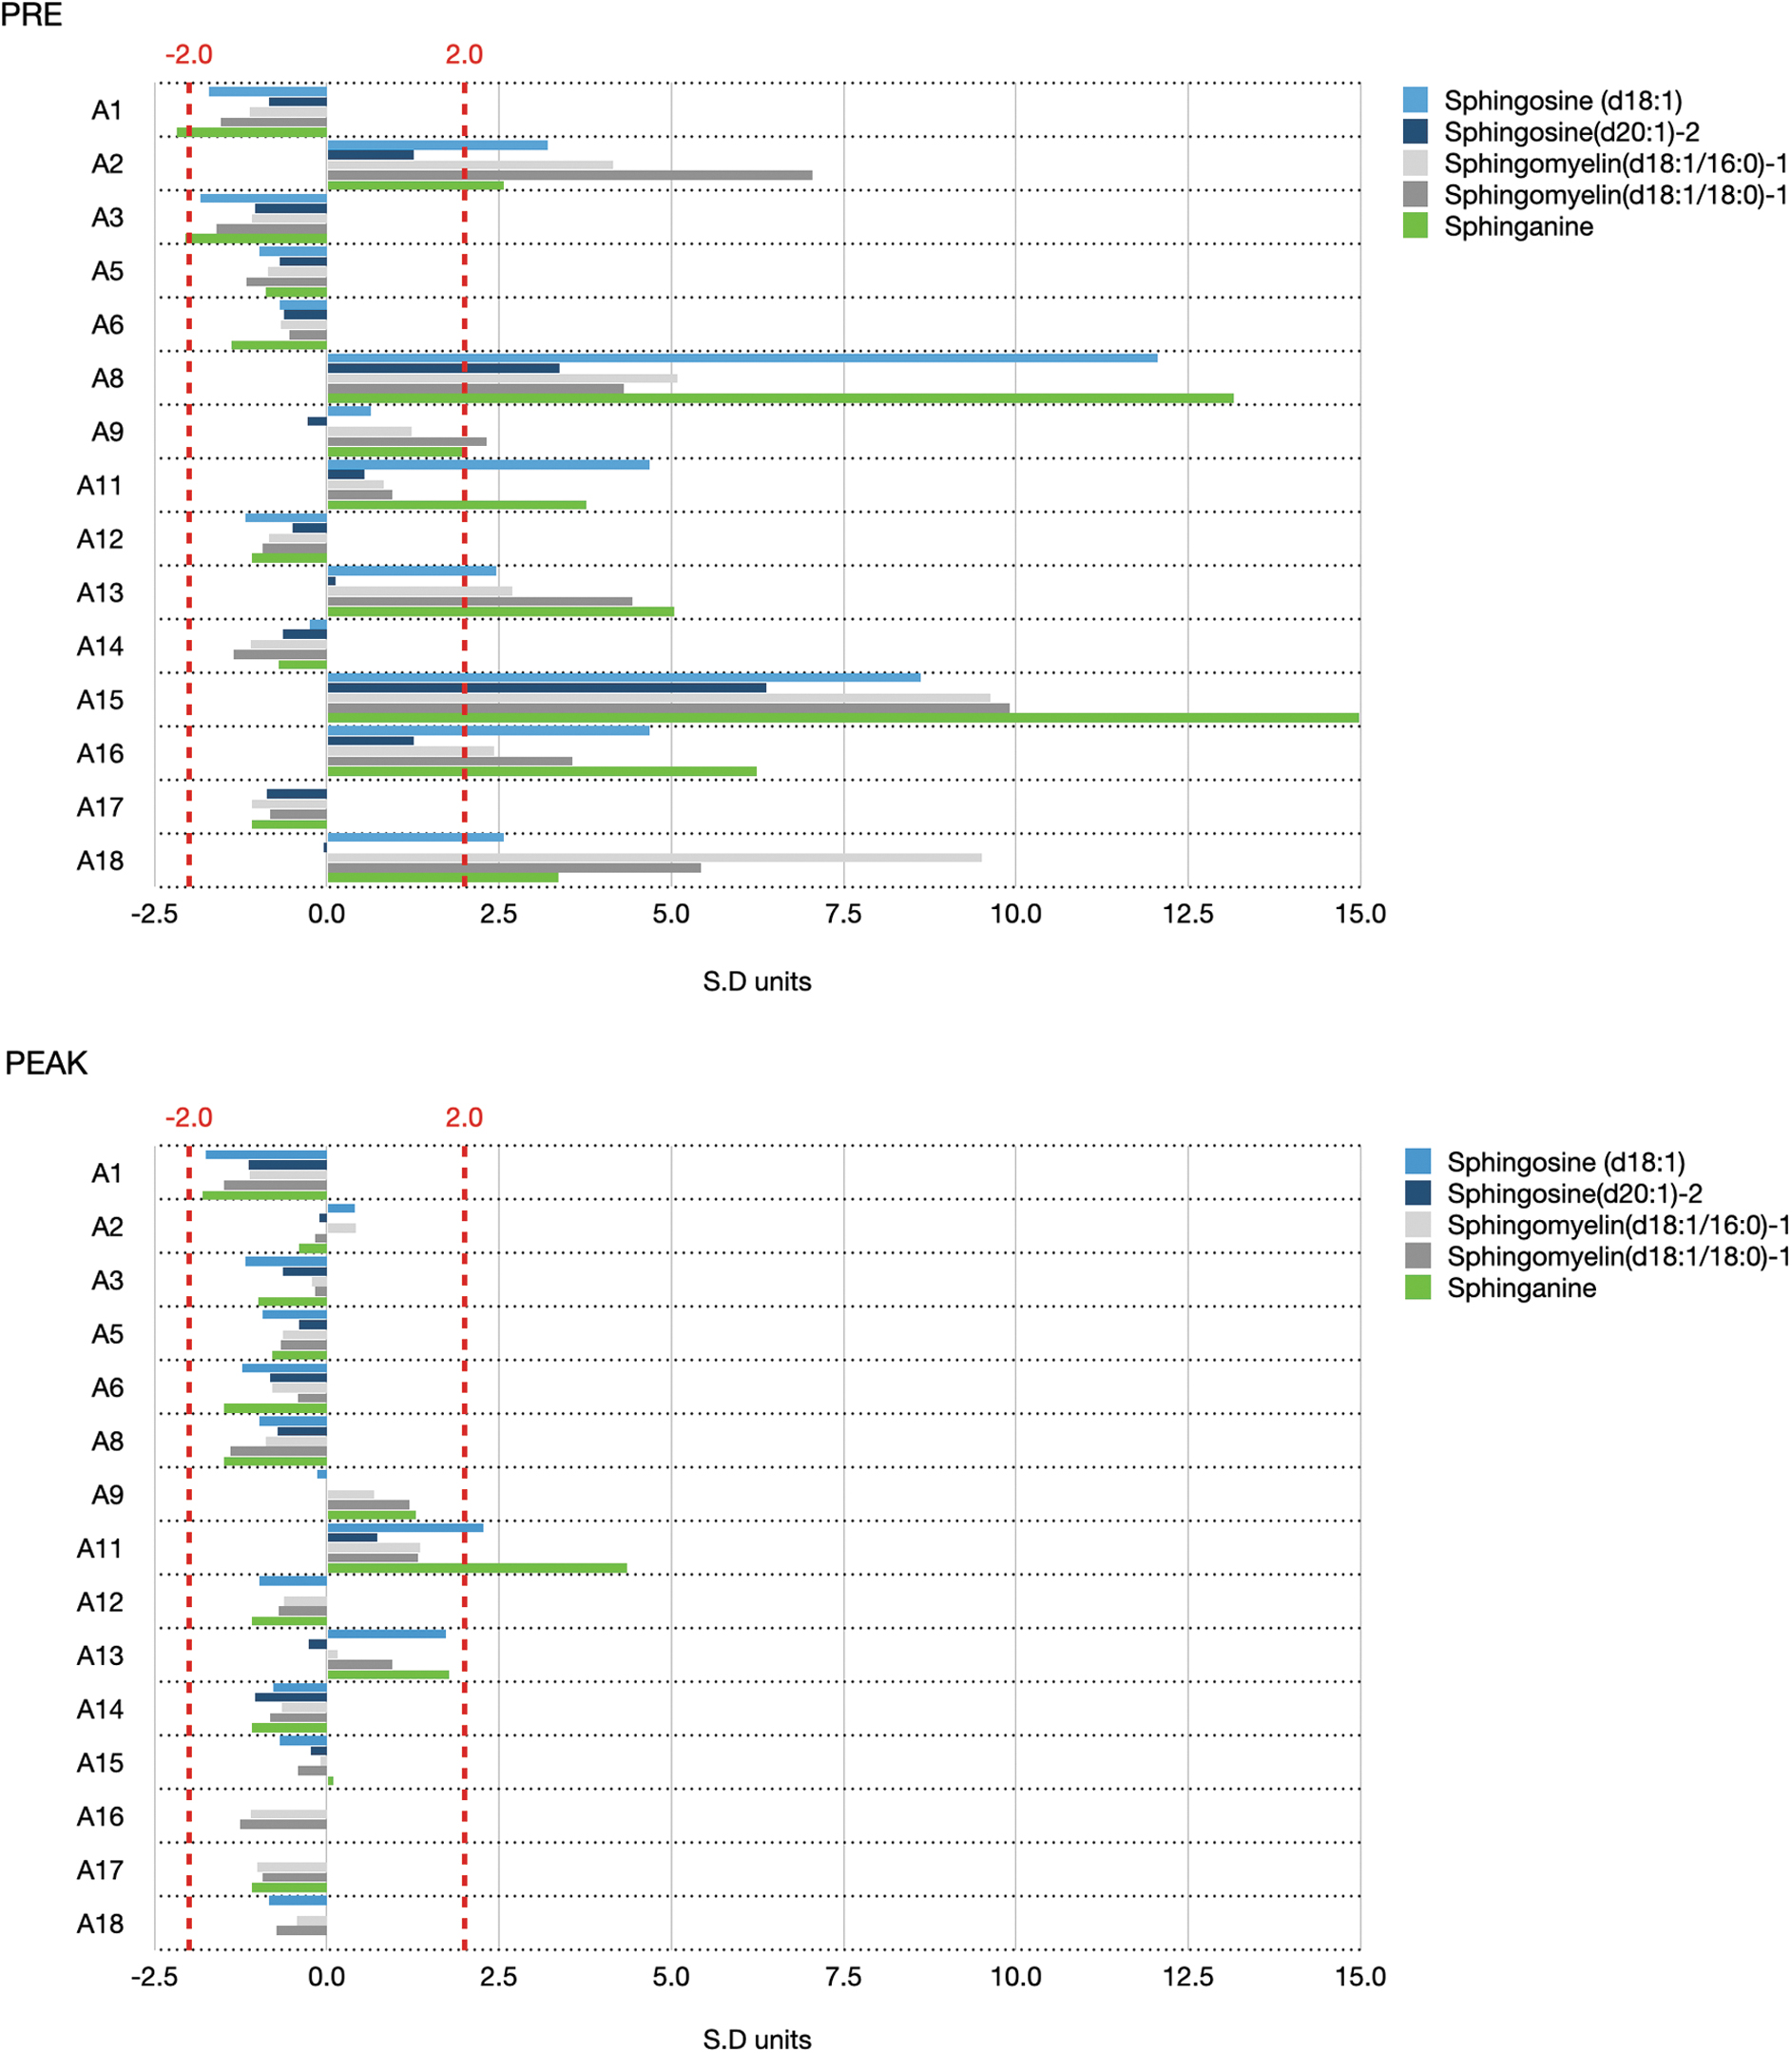
Effect of MC treatment on z-score values of potential sphingolipid class of cannabis-responsive biomarkers. Changes in SDEV units detected in each child with ASD PRE (upper panel) and PEAK (lower panel) medical cannabis treatment are shown. Dashed red lines indicate ±2 SDEV units from the average of the TD group. ASD, autism spectrum disorder.
Three sphingolipids [sphingosine (d18:1), sphingomyelin (d18:1/16:0)-1, and sphingomyelin (d18:1/18:0)-1] exhibited a significant decrease in response to MC treatment (p<0.05) in 46% of participants. MC treatment also slightly increased the low levels of SPG in subjects A1 and A3. In combination, this indicates a unique regulatory impact of MC in which biomarker levels increase or decrease toward TD physiological levels at PEAK.
Phospholipids
Phospholipids are a highly abundant diverse amphiphilic component of the cell membrane that facilitate transport and storage of lipids and are involved in signal transduction. 28 Five members of the phospholipid class were identified in this study as potential cannabis-responsive biomarkers, including lysophosphatidylserine [LPS(18:0)] and LysoPAF(16:0), which both exhibit statistically significant changes in response to MC treatment (Table 1). At PRE, high levels above TD physiological range (3–31 SDEV) in most of the phospholipids were observed in three subjects (A2, A16, and A18), while high levels of one or two phospholipids were detected in six additional subjects (A6, A8, A9, A13, A15, and A17) (Fig. 3).

Effect of MC treatment on z-score values of potential phospholipid class of cannabis-responsive biomarkers. Changes in SDEV units detected in each child with ASD PRE (upper panel) and PEAK (lower panel) medical cannabis treatment are shown. Dashed red lines indicate ±2 SDEV units from the average of the TD group.
Lower levels (below the TD physiological range, but greater than −2 SDEV) were detected in 88% of all the potential biomarkers in the additional six subjects (A1, A3, A5, A11, A12, and A14), with the exception of lysophosphatidylethanolamine-1 [LPE(18:1)-1] and lysophosphatidylcholine (Lyso-PPC) in subject A11 and LPS(18:0) in A14. MC treatment at PEAK shifted subjects A2, A6, A8, A15, A16, A17, and A18 toward TD physiological levels, while subject A13 exhibited significantly increased LPS(18:0) and Lyso-PPC. PEAK levels in subjects A1, A3, A5, A11, A12, and A14 remained low within the TD physiological levels.
Thus, those with PRE levels within the TD physiological levels remained there. Only potential phospholipid cannabis-responsive biomarkers above or below physiological levels (3–31 SDEV) at PRE shifted into the TD physiological range at PEAK.
Fatty acids
FAs, the building blocks of lipids, are a major component of saliva. 17 We identified nine potential cannabis-responsive biomarkers that are monounsaturated fatty acids (MUFAs), polyunsaturated fatty acids (PUFAs), polyunsaturated fatty acylethanolamine (LEA), and two long-chain acylcarnitine (LCAC) (Table 1).
High levels of palmitoyl-carnitine (light blue; 2–23 SDEV) and oleoyl-carnitine (dark blue; 3–16 SDEV) detected at PRE in 47% of subjects (A2, A8, A9, A13, A15, A16, and A18) were significantly reduced (p=0.014 and p=0.013, respectively) at PEAK to TD physiological levels in six subjects (A8, A9, A15, A16, and A18) (Fig. 4). They were reduced, but remained slightly high (bellow 3 SDEV) in both subjects A2 and A13 (oleoyl-carnitine only). Subject A11 showed a slight increase in the levels of palmitoyl-carnitine at PEAK, from TD physiological levels to 2.9 SDEV.
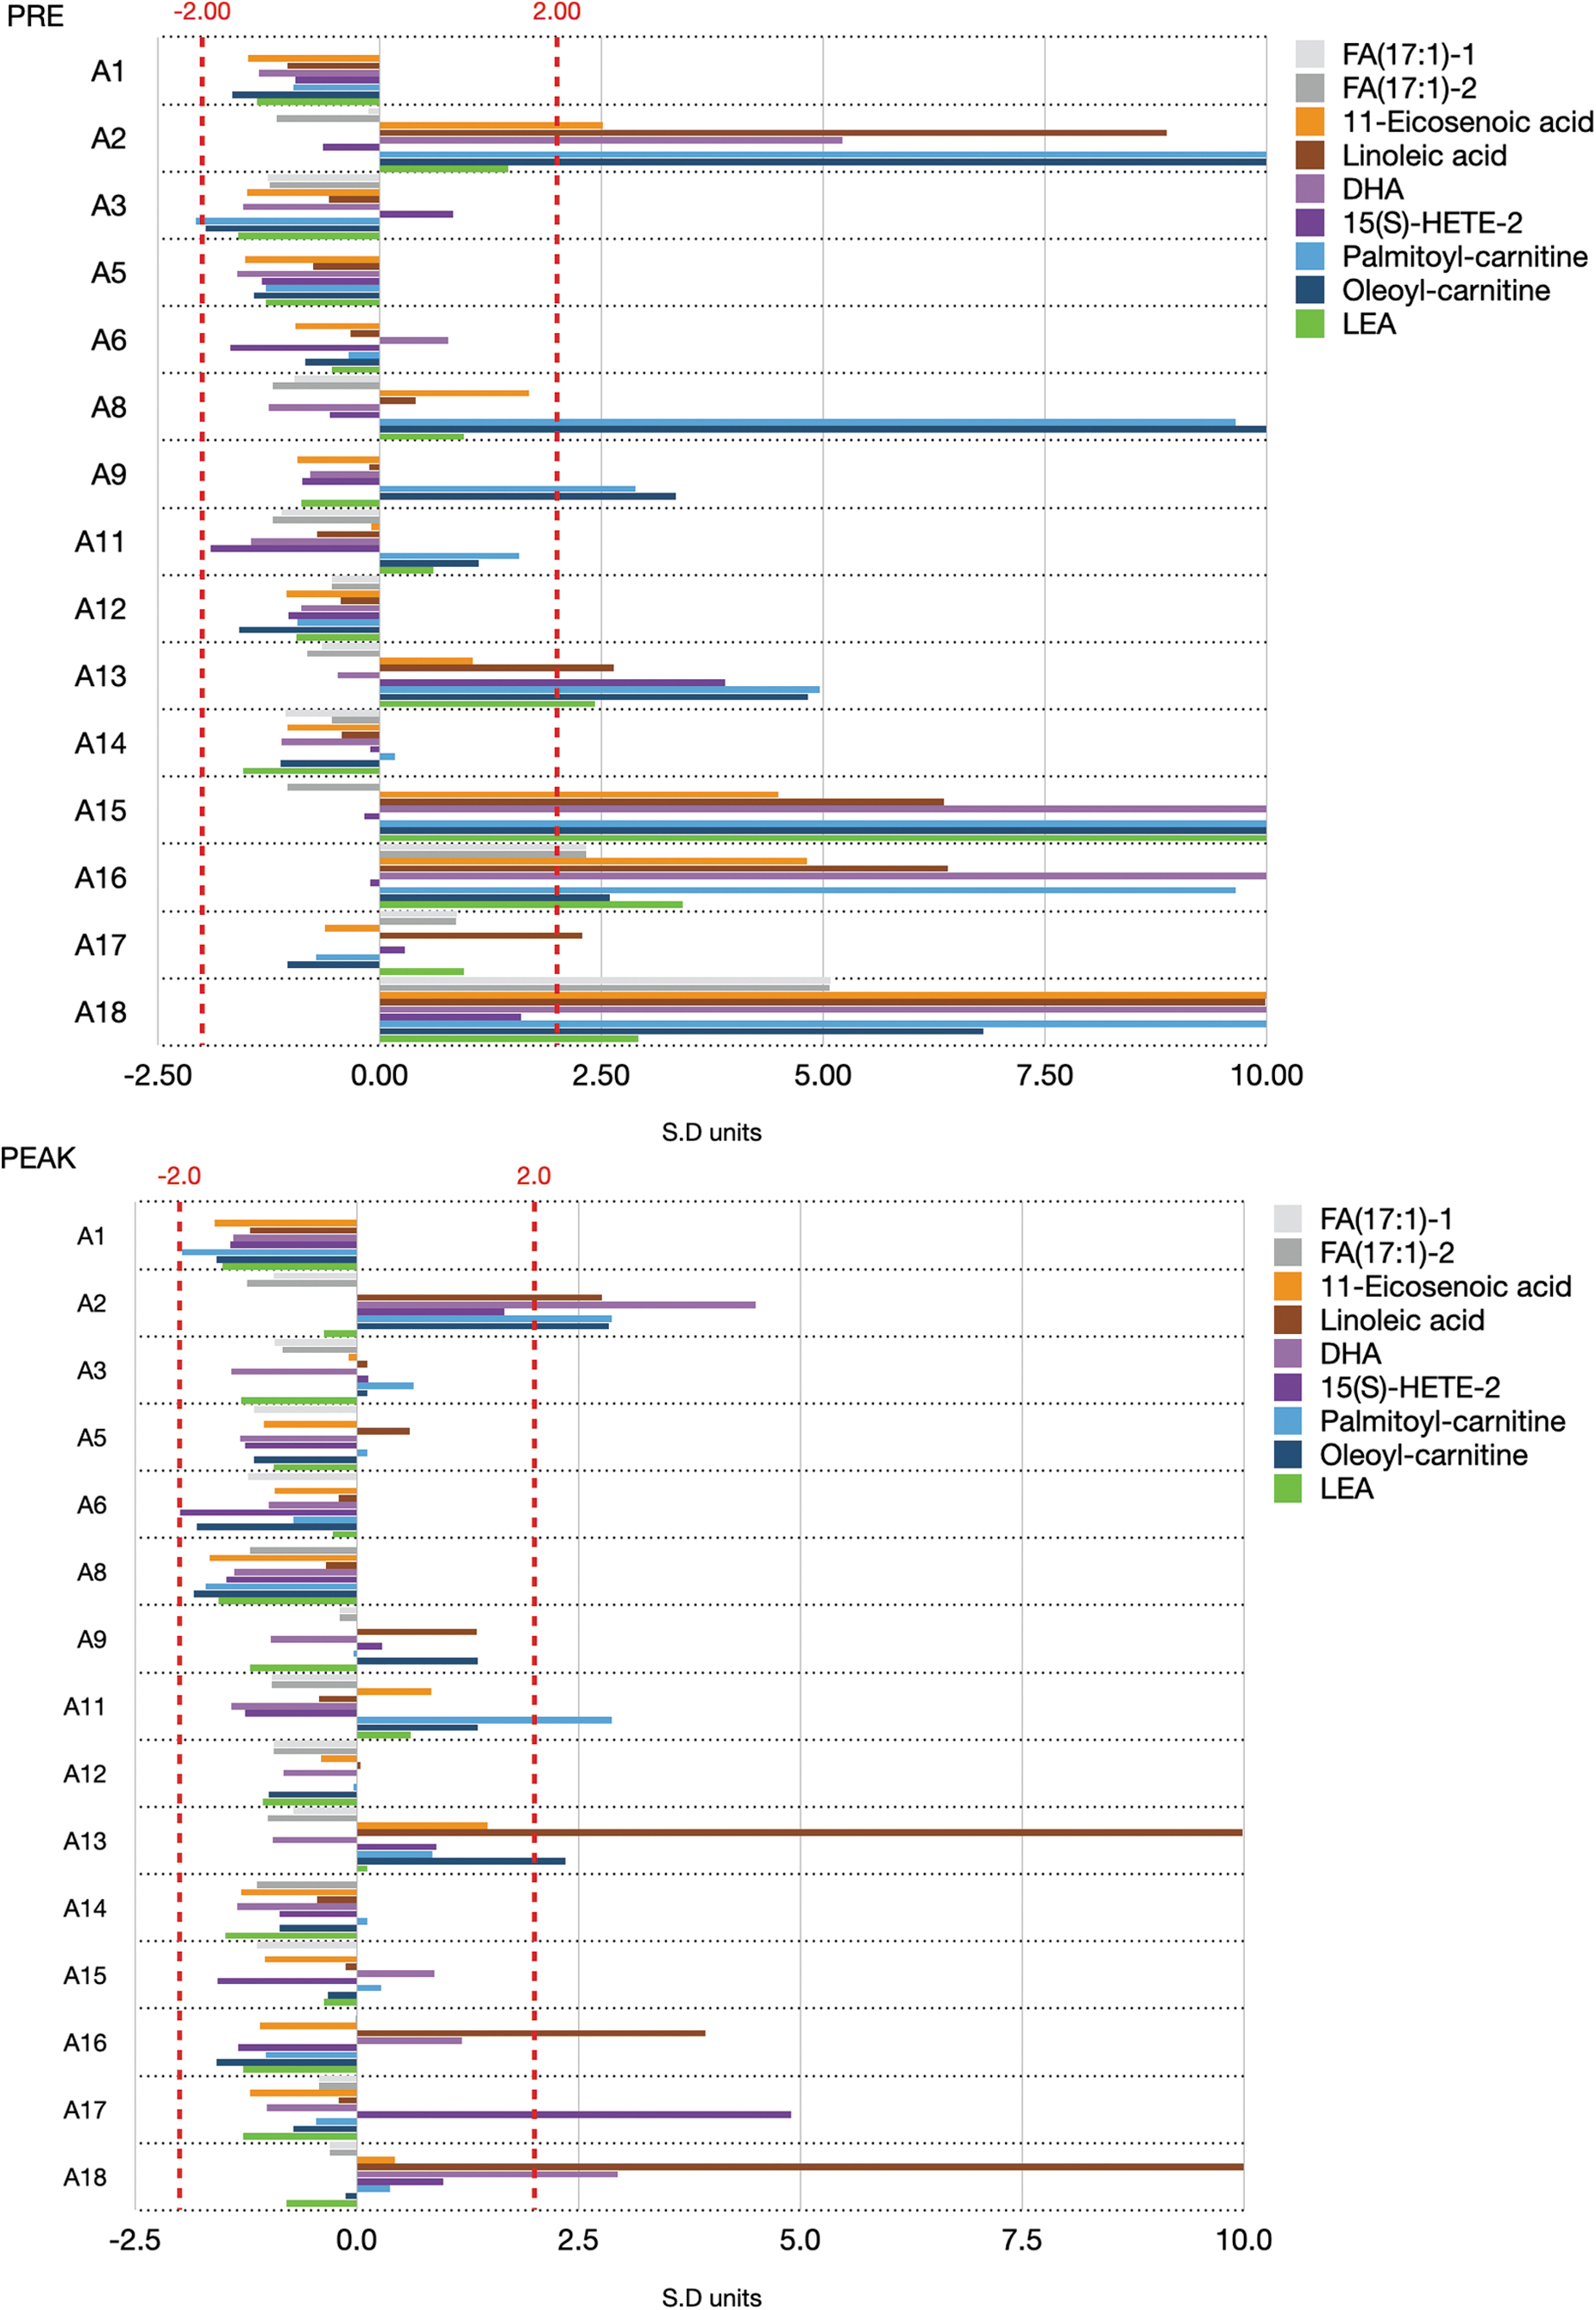
Effect of MC treatment on z-score values of potential fatty acid class of cannabis-responsive biomarkers. Changes in SDEV units detected in each child with ASD PRE (upper panel) and PEAK (lower panel) medical cannabis treatment are shown. Dashed red lines indicate ±2 SD units from the average of the TD group.
11-Eicosenoic acid (orange), linoleic acid (rust), and DHA (pink) exhibited a similar pattern of high levels at PRE in subjects A2, A15, A16, and A18 ranging from 2 to 27 SDEV. MC treatment effectively reduced 11-eicosenoic acid levels in all subjects at PEAK. The linoleic acid ethanolamide-conjugated derivative, LEA, detected in high levels in subjects A13, A15, A16, and A18 at PRE, was significantly reduced (p=0.023) in all subjects at PEAK below mean value within the TD physiological range.
Other lipids
About 92% of subjects exhibited TD physiological range of triglyceride trilaurin-1 and trilaurin-3 levels at both PRE and PEAK (not shown). Elevated trilaurin-1 and trilaurin-3 z-score levels detected in patient A17 at PRE (4.6 and 2.8, respectively) were reduced to TD physiological range at PEAK (−0.4 and −0.3, respectively). The sterol lipid member cholesterol sulfate (CS) was significantly higher in A8 and A16 (z-score: 2.5 and 2.0, respectively) and slightly high in A2, A9, and A15 (z-score: 2.5 and 2.0, respectively) at PRE, reduced into the TD physiological range at PEAK (not shown). CS exhibited a significant trend (p=0.014) in shifting the levels at PRE toward the TD range at PEAK in 87% of subjects within the physiological range, but below the TD mean.
Discussion
Lipid function in a variety of intercellular and intracellular biological processes providing cells and organelles with structure, energy source, and signaling, and as communication. 29 As a well-classified group of biomolecules, with known roles in metabolism and catabolism, lipids are gradually becoming an important biomarker subclass in diagnostics and personalized medicine. 30 Altered lipid metabolism reflecting a range of dynamic responses to pathophysiological changes is well documented in neurodegenerative disorders, including AD, PD, Huntington's disease (HD), ALS and multiple sclerosis (MS), neuropsychiatric disorders (depression and schizophrenia), neurological disorders (ASD, seizure, and migraine), and brain injuries (stroke).5,31
We used saliva as a noninvasive complex biofluid matrix to evaluate lipid changes in response to successful MC treatment, as determined by physician observation and parental behavior assessment (Supplementary Data). Like blood, saliva is a “mirror of the body's health,” 32 and can accurately reflect pharmacodynamic 33 and pharmacokinetic 34 properties of a medical treatment. It contains five out of the eight major lipid groups, including FAs, glycerolipids, phospholipids, sphingolipids, and sterol lipids; and lacks prenol lipids, saccharolipids, and polyketides. 17
In this study, we detected all five subclasses of lipids known in saliva and identified members of these subclasses as potential cannabis-responsive biomarkers (Table 1). These subclasses were recently described as biomarkers of brain disorders. 31 According to Agatonovic-Kustrin et al., 15 phospholipids (24%) and sphingolipids (17%) are the two major subclasses of lipids found in saliva in healthy populations.
By comparison, we found a similar distribution of phospholipids at PRE (26%), slightly decreasing at PEAK (23%), while the sphingolipid fraction was lower at PRE (12%) and significantly higher at PEAK (23%) (Table 1). All five sphingolipids identified in this study responded to MC treatment (Fig. 2) by shifting the levels of 94% of the metabolites outside the TD physiological range at PRE to the TD physiological range at peak. The relatively large number of potential cannabis-responsive biomarkers that respond to MC treatment (Table 1) and the magnitude of the impact (Fig. 2) indicate that sphingolipids are a main target for MC treatment.
Sphingomyelin is an essential subclass of sphingolipid promoting membrane interactions within the myelin sheath surrounding nerves and their axons. 35 It is a major lipid biomarker identified at high levels in neurodegenerative disorders (AD, PD, HD, and ALS), neuropsychiatric disorders (depression and schizophrenia), neurological disorders (migraine), and brain injuries (stroke). 31 Bent et al. 36 demonstrated that high levels of seven sphingomyelin metabolites, identified in urine samples of children with ASD, decreased post-intervention with sulforaphane, a supplement with indirect antioxidant effects. These changes were associated with improved behavioral symptoms.
In our study, there appear to be two groups of children: one exhibiting high levels (>2.0 SDEV above TD mean) of sphingomyelins (subjects: A2, A8, A9, A13, A15, A16, and A18) at PRE that shift toward TD mean at PEAK and a second already exhibiting TD physiological levels (<2.0 SDEV from TD mean) that remain in this range, effectively not responding to MC treatment (Fig. 2).
According to the KEGG pathway: hsa04071 sphingolipid signaling pathway (https://www.genome.jp/entry/hsa04071), sphingomyelins and their metabolic products ceramide and sphigosine-1-phosphaste (S1P) have a second messenger function in several signaling pathways. Ceramide is generated from membrane sphingomyelin by sphingomyelinase and is further metabolized by ceramidase to yield sphingosine, which produces S1P through sphingosine kinases, and from SPG through ceramide synthase 1 and sphingolipid 4-desaturase. Ceramide, S1P, and SPG have been shown to regulate cellular responses to stress, including neuronal apoptosis in AD, ASD, and other neurological disorders. 31
Impaired sphingomyelin profiles are documented and can result in abnormalities in morphology of dendrites in autism, which can affect neuron function. 37 We have recently shown MC treatment modulates the levels of N-acetyl-aspartate (NAA), a metabolite synthesized solely by neuronal mitochondria and indirectly regulating energy production. 20 These results suggest further investigation to determine whether the reduction of high levels of sphingosines and NAA in children with ASD exhibiting nonphysiological levels benefits from MC treatment. It is also important to determine if MC treatment directly or indirectly affects antioxidant capacity and mitochondrial function.
The sphingosines [SGS(20:1)-2 and SGS(18:1)] and SPG represent the two groups within the subclass of sphingosine (sphingosine and sphingomyelin) and dihydrosphingosine (SPG). Both sphingosine and dihydrosphingosine groups are essential in multiple biological processes, including membrane structure, signal transduction, and brain development, and are also involved in demyelination. 38
Sphingosine and its phosphorylated form sphingosine phosphate were found at elevated levels in AD, PD, HD, MS, and schizophrenia, 31 while SPG was detected in high levels only in MS. In this study, sphingosines and SPG exhibited similar patterns, namely high levels in subjects A2, A8, A11, A13, A15, A16, and A18. In addition, slightly higher levels than the TD mean were observed in A1 and A3 for SPG.
To obtain further insights into the impact of MC on potential lipid-based cannabis-responsive biomarkers within the limitations of this observational evaluation (small sample size and the personalized MC treatment of each participant), we conducted a correlation-based network analysis of lipid profiles 39 of PRE versus PEAK samples.
Metabolic pathways can be described as the movement of metabolites from entry point (substrate) to an exit point (product) through a network of processing steps. A metabolic pathway can contain multiple networks. The current knowledge regarding lipids includes (1) classification 26 ; (2) specific cellular and subcellular compartment localization 40 ; (3) metabolic and signaling networks 39 ; and (4) role in homeostasis and pathophysiology, 41 and the advanced lipidomics bioinformatics tools, 42 including functional biomarkers. 15 These provide an opportunity to analyze and propose a preliminary lipid metabolic network in response to MC treatment.
Figure 5 describes MC treatment-dependent relationships using pairwise correlations over all potential lipid-based cannabis-responsive biomarkers described in Table 1. We identified a subnetwork of seven potential biomarkers with linkage to neuropsychiatric and neurodegenerative disorders, including three FAs, two sphingomyelins, and two phospholipids (Fig. 5A).

Possible cannabis regulation of lipid cannabis-responsive biomarkers. Maps of subnetwork
High levels of acylcarnitines in patients with ASD, 43 eicosenoic acid in patients with schizophrenia, 44 Lyso-PAF in posterior/entorhinal cortex of AD patients, sphingomyelin in chronic stress and in an antidepressant-treated mouse model, 45 and LPE in a cognitive impairment rat model 46 were associated with mitochondrial fatty acid beta-oxidation and peroxisomal disorders and may suggest a role for inflammation and/or redox regulation.
The second subnetwork (Fig. 5B) consists of two sphingosines [SGS(20:1)-2 and SGS(18:1)] and SPG, representing the two groups in the subclasses sphingosine (sphingosine and sphingomyelin) and dihydrosphingosine (SPG). Both sphingosine and dihydrosphingosine groups are involved in demyelination in MS. 38 Together with CS, the third member of this subnetwork, SGSs and SPG were all linked to the oxidative stress-induced neurodegenerative pathology in MS.47,48
We also identified two potential lipid-based cannabis-responsive biomarkers LEA (p=0.023) and DHA (p=0.041) (Table 1) exhibiting significant changes in response to MC treatment and linked to anti-inflammatory activity. These biomarkers are not interconnected to the subgroups identified in Figure 5A. LEA, an endocannabinoid that exhibits a weak binding property to CB1 and CB2, 13 has a suggested role in CNS inflammation response by the transient receptor potential cation channel subfamily V member 1 (TRPV1). 49 DHA is a highly abundant bioactive omega-3-PUFA in the brain exhibiting anti-inflammatory activity at the intracellular and the humoral immune system levels in rats with traumatic brain injury. 50
Limitations
Although we successfully identify potential lipid-based cannabis-responsive biomarkers exhibiting significant changes after MC, the following limitations should be considered in this observational evaluation: first, the small sample size of children with ASD successfully treated with MC did not cover the heterogeneity of the ASD population, and thus cannot suggest that MC provides a treatment for all clinical phenotypes of ASD. Second, each child is a single case treated with unique cannabinoid content and regimen. Thus, association of biomarkers with cannabinoids is limited to the presence of cannabinoids and not to the potency or regimen. Third, we conducted an observational study where samples and surveys were taken in a single day for each patient.
Since the child's behavior is influenced by environmental factors and varies from day to day, samples and surveys may not represent the full range of behaviors for each child. Fourth, children were treated with prescribed off-the-shelf MC supplied by the parents. Some doses were measured using a dropper, which may not be accurate. Fifth, cannabinoid potency and content were not verified by the authors. Sixth, the current analysis assumes that all the potential cannabis-responsive biomarkers have equal impact.
Increasing the number of participants will allow stratification and focus on specific biomarkers related to the metabolic pathways affected by ASD and the clinical phenotype. Seventh, since the biomarkers were detected in saliva, we cannot rule out that the biomarker changes observed are not in their physiological context.
Conclusions
This exploratory research demonstrates that salivary lipidomics can serve as a powerful tool to identify and quantify lipid-based biomarkers that respond to MC treatment in children with ASD. Members from all the five known lipid subclasses were identified in saliva, including monounsaturated and polyunsaturated FAs, phospholipids, sphingolipids, glycerolipids, and sterol lipids. The relative changes in the biomarker distribution pattern at PRE and PEAK suggest that MC mainly affects the sphingolipid subclass. Changes observed in two sphingomyelin potential cannabis-responsive biomarkers together with changes in NAA previously detected in the polar fraction of these saliva samples 20 may suggest MC improves neuron signaling, regulation, and/or proper myelination in children with ASD.
Potential lipid-based cannabis-responsive biomarkers are pharmacodynamic/response-type biomarkers allowing objective evaluation of the impact of MC treatment on children with ASD and possible MOA. Within the limitation of this size and type of this study, correlation-based network analysis of lipid profiles in response to MC treatment provides additional tools to identify groups with potential interconnections that may indicate roles in mitochondrial dysfunction, oxidative stress, and neuroinflammation, all previously reported to be associated with ASD.
Increasing the sample size and looking at longer term clinical intervention will support generation of accurate lipid-based cannabis-responsive biomarkers, the optimization of MC treatment, and the understanding of the underlying MOA of MC treatment in ASD.
Footnotes
Authors' Contributions
M.S.-R., R.M., S.C., B.G., D.A., M.T., and I.K. designed the study and prepared the article; M.S.-R., R.M., S.C., and I.K. analyzed the data; and M.S.-R. and I.K. performed the experiments and collected the data.
Acknowledgments
The study authors wish to recognize the contribution of Cannformatics, Inc. cofounder Mr. Kenneth Epstein. Mr. Epstein managed participant communications and sample collection. We are deeply grateful to the children and their families who participated in this study. We also thank Mr. Ray Mirzabegian from Canniatric (San Fernando, CA), and Mrs. Rhonda Moeller and Mrs. Jenni Mai from WPA4A for their financial support and assistance.
Author Disclosure Statement
M.S.-R., R.M., and I.K. are employees of Cannformatics, Inc. S.C., B.G., D.A., and M.T. are advisors to Cannformatics, Inc. S.C. is an Assistant Professor at the Department of Pediatrics, University of California San Francisco, Benioff Children's Hospitals. B.G. is the owner and Medical Director of Canna-Centers Wellness & Education. D.A. is an Integrative Oncologist at the Department of Medicine and Professor Emeritus of Medicine, University of California San Francisco; Scientific Advisor to Clever Leaves, Lumen, Maui Grown Therapies; and Speaker Honorarium at GW Pharmaceuticals. M.T. is an Emergency Medicine Physician in Sunnyvale, TX.
Funding Information
This research was funded by Cannformatics, Inc., and financially supported by Canniatric and WPA4A.

Abbreviations Used
References
Supplementary Material
Please find the following supplemental material available below.
For Open Access articles published under a Creative Commons License, all supplemental material carries the same license as the article it is associated with.
For non-Open Access articles published, all supplemental material carries a non-exclusive license, and permission requests for re-use of supplemental material or any part of supplemental material shall be sent directly to the copyright owner as specified in the copyright notice associated with the article.
