




Abstract
Introduction:
The use of Cannabis sativa L. in health care requires stringent care for the optimal production of the bioactive compounds. However, plant phenotypes and the content of secondary metabolites, such as phytocannabinoids, are strongly influenced by external factors, such as nutrient availability. It has been shown that phytocannabinoids can exhibit selective cytotoxicity against various cancer cell lines while protecting healthy tissue from apoptosis.
Research Aim:
This study aimed to clarify the cytotoxic effect of cannabis extracts on colorectal cell lines by identifying the main active compounds and determining their abundance and activity across all developmental stages of medical cannabis plants cultivated under hydroponic conditions.
Materials and Methods:
Dimethyl sulfoxide extracts of medical cannabis plants bearing the genotype classified as chemotype I were analyzed by high-performance liquid chromatography, and their cytotoxic activity was determined by measuring cell viability by methylthiazolyldiphenyl-tetrazolium bromide assay on the human colon cancer cell lines, Caco-2 and HT-29, and the normal human epithelial cell line, CCD 841 CoN.
Results:
The most abundant phytocannabinoid in cannabis extracts was tetrahydrocannabinolic acid (THCA). Its maximum concentrations were reached from the 7th to the 13th plant vegetation week, depending on the nutritional cycle and treatment. Almost all extracts were cytotoxic to the human colorectal cancer (CRC) cell line HT-29 at lower concentrations than the other cell lines. The phytocannabinoids that most affected the cytotoxicity of individual extracts on HT-29 were cannabigerol, Δ9-tetrahydrocannabinol, cannabidiol, cannabigerolic acid, and THCA. The tested model showed almost 70% influence of these cannabinoids. However, THCA alone influenced the cytotoxicity of individual extracts by nearly 65%.
Conclusions:
Phytocannabinoid extracts from plants of the THCA-dominant chemotype interacted synergistically and showed selective cytotoxicity against the CRC cell line, HT-29. This positive extract response indicates possible therapeutic value.
Introduction
Colorectal cancer (CRC) is one of the most common cancers worldwide. Despite the fact that health systems have been improved and screening programs have been implemented recently, every year, one to two million new cases are diagnosed, making CRC the third most common cancer diagnosis and the fourth most common cause of cancer-related deaths. 1 Thus, many scientific teams are trying to find new active compounds with cytostatic and cytotoxic effects.
Studies have already shown that phytocannabinoids and prenylated polyketides of mixed biosynthetic origin 2 can prevent proliferation, angiogenesis, and metastasis, and induce apoptosis in various types of human cancers, including breast, 3 pancreatic, 4 prostate, 5 and intestinal.6,7 Acting through cannabinoid receptor and nonreceptor signaling pathways, phytocannabinoids exhibit specific cytotoxicity against tumor cells and simultaneously protect healthy tissue from apoptosis. 8 Until recently, phytocannabinoids had been predominantly used to treat nausea and vomiting in cancer patients undergoing chemotherapy. There is growing experimental evidence in vitro and in animal models supporting the anticancer activity of individual cannabinoids through modulation of key cell signaling pathways involved in the control of cancer cell proliferation and survival, inhibition of angiogenesis, and reduction of metastasis in various types of tumors.9,10
Nevertheless, their utilization in oncology is likely to be limited, for now, because clinical evidence is still lacking. Research is hampered by variability and insufficient standardization in trial design, drug formulation, and pharmacodynamics.11,12 The success of such treatments will depend on the dose, the individual, the tumor stage, and many other circumstances.13,14
The use of cannabis in health care and pharmacy puts strict demands on growers raising plants with optimal production of the required compounds. 15 Cultivation can be done either by growing in soil or hydroponically. 16 In hydroponic cultivation, nutrients are supplied in an aqueous solution directly to the plant's roots fixed in an inert growing medium. 17 At present, basic research information on regulation of the biosynthesis of secondary metabolites of Cannabis sativa L. is lacking due to legal restrictions in most countries. 18 Concerning internal and external factors influencing the phytocannabinoid spectrum, the main determining internal factors are the plant's genotype and vegetation or harvest phase. 19 However, plant phenotypes are also strongly influenced by external factors such as light, 20 carbon dioxide level, 21 irrigation, 22 and nutrition. 23
In this study, we focused on the cytotoxicity of extracts of hydroponically grown medical cannabis of chemotype I, which had a Δ 9 -tetrahydrocannabinolic acid/cannabidiolic acid (THCA/CBDA) ratio (>>1.0), at different stages of plant maturity collected throughout the vegetative cycle.
The following hypotheses were proposed: (1) the spectrum and concentration of individual phytocannabinoids in extracts will change during the vegetation cycle of plants cultivated under hydroponic conditions; (2) cannabis extracts will exhibit selective cytotoxicity on specific human intestinal cell lines; and (3) the cytotoxicity of individual extracts will vary during the plant's vegetation cycle cultivated under hydroponic conditions.
To test the hypotheses on a sufficiently large dataset and precisely control the expected responses, we monitored the cytotoxicity of cannabis extracts on three cell lines within 13 vegetation weeks of hydroponically grown cannabis in four nutrient treatments and two nutrient systems. The first hydroponic system was a recirculating nutrient solution, and the second was a “drain-to-waste” system.
Materials and Methods
Plants and treatments
The plants used in the experiments came from the vegetative propagation of mother plants of the medical cannabis genotype with the working name, “McLove,” classified as chemotype I, which has a high THCA/CBDA ratio (≫1.0). The fresh cuttings were cultivated for 21 days in rockwool cubes. Rooted clones were moved to a growing room, where test plants were grown hydroponically in Euro Pebbles (expanded clay) on tables in a room with controlled light, temperature, and relative humidity. Plant density was 27.5 plants per m2 (55 plants/table/treatment). The light mode was set to 18 h of light and 6 h of darkness. The vegetative phase lasted 7 days, after which the cultivation regimen was adjusted to the generative phase. The light period was reset to 12 h light and 12 h dark.
Plants were subjected to three enhanced nutritional treatments with two different nutrient cycles, recirculation, and drain to waste, compared with control treatment A (AT) (Table 1). In the recirculation cycle (1C), fresh nutrient solution was added every week and recirculated for 1 week with no addition of other nutrients, and the pH was adjusted to 5.9 daily. 24
Nutrient Composition of Control (AT) and Enhanced Treatments (BT, CT, DT): Solutions (mg/L)
Control treatment (AT).
Enhanced treatment B (BT) with the addition of amino acids.
Enhanced treatment C (CT) with the addition of P, K, and Fe.
Enhanced treatment D (DT) with the addition of amino acids, P, K, and Fe.
Control (AT) and enhanced treatments (BT, CT, DT).
Demineralized water.
In the drain-to-waste nutrient cycle (2C), the spent solution went to a separate waste tank and was no longer mixed with a fresh nutrient solution. The enhanced treatments were set up for both nutritional cycles. The enhanced treatment B (BT) received an amino acid biostimulant (composition previously described) 25 added from the 2nd week for the last 24 h at a volume of 2 mL/L before changing the nutrient solution. The enhanced treatment C (CT) received increased amounts of P (P2O5), K (K2O), and Fe (chelated) added from the 5th week. The enhanced treatment D (DT) received a mixture of the two enhanced treatments (BT and CT) (Table 1). The new nutrient solution was prepared with reverse osmosis water every 7 days from the first day of the experiment. From the 10th week, plants were irrigated with demineralized water.
Sampling of plant material
Three plants were harvested continuously from each treatment group every 7 days during the entire vegetative cycle. Plant samples were divided into leaves, stems, and flowers. The flowers were then separately dried at 25°C to constant moisture (8–10%). A reference amount was dried at 105°C to constant weight to determine the dry matter. Subsequently, the flowers (including the leaves until the 4th week) were frozen in liquid nitrogen and ground in a mortar and pestle.
Extraction and identification of phytocannabinoids
Phytocannabinoids from homogenized flowers (including the leaves until the 4th week) were extracted by the optimized method of dynamic maceration. 26 Samples (0.30 g) from each experimental group were mixed with 10 mL of 96% ethanol and macerated for 1 h at room temperature with constant stirring at 300 rpm. Mixtures were then filtered, and the filtrates were collected. The flowers were removed from the filter and mixed with another 10 mL of solvent. This step was repeated twice, and the filtrates were pooled. Aliquots of 20 mL of each sample were dried in a vacuum evaporator (Heidolph 4000, Germany) to constant weight.
Subsequently, the dried matter was dissolved in dimethyl sulfoxide (DMSO) to a final concentration of 8.129 mg/mL. Aliquots of 0.5 mL of each sample were diluted to 10 mL with DMSO and filtered through a nylon syringe filter (0.22 μm) into vials. Samples of the extracts were injected into a high-performance liquid chromatography system equipped with diode array detection (Agilent 1260; Agilent Technologies, Inc., USA) and a Luna® C18 column (2) 250×3 mm2, particle size 3 μm (Phenomenex, USA).
The isocratic mobile phase consisted of acetonitrile/H2O (31:9, v/v) with 0.1% HCOOH (v/v) and 0.1 M NH4HCO2 (without pH adjustment). The flow rate was 0.55 mL/min and temperature was 37°C. The sample injection volume was 8 μL, and UV detection was at 275 nm. 27 The instrument was externally calibrated using THCA from 0.3 to 100 mg/L and other phytocannabinoids, 0.3–10 mg/L (Sigma-Aldrich, Czech Republic) as standards. Data were analyzed using OpenLAB CDS software, ChemStation Edition, Rev. C.01.5, and are presented as mean±standard deviation.
Cell cultures
Human CRC cell lines Caco-2 (ATCC HTB 37), HT-29 (ATCC HTB 38), and normal human colon epithelial cell line CCD 841 CoN (ATCC CRL 1790) (ATCC, Rockville, MD, USA) were cultured in Eagle's Minimal Essential Medium (EMEM) supplemented with 10% fetal bovine serum, 1% sodium bicarbonate, 1% sodium pyruvate, 5 mM glutamine, 1% MEM nonessential amino acids (without CCD 841 CoN), and 1% penicillin–streptomycin solution (10,000 units/mL of penicillin and 10 mg/mL of streptomycin) (Biowest, Nuaille, France). Cells were incubated at 37°C with 5% CO2 and media were replenished every 2–3 days, with passaging every 7 days.
Cytotoxicity assay
Cell viability was measured using the methylthiazolyldiphenyl-tetrazolium bromide (MTT) cytotoxicity assay originally developed by Mosmann (1983) 28 with modification according to Doskočil et al. 29 Briefly, Caco-2 and HT-29 cells were seeded in 96-well plates at a density of 2.5×10³ per well and CCD 841 CoN cells were seeded at 2.5×10⁵ cells/well in a 96-well plate for 24 h. Samples were added in double serial dilution (4–128 μg/mL, originally in DMSO) for 72 h.
Thereafter, the MTT reagent (1 mg/mL) in EMEM was added to the wells and incubated for 2 h at 37°C with 5% CO2. The medium with MTT was removed, and cells were dissolved in 100 μL of DMSO. The absorbance was measured at 555 nm using a Tecan Infinite M200 spectrometer (Tecan Group, Männedorf, Switzerland), and the percent viability (IC50 value) was calculated and compared with negative control, cells in complete culture medium with DMSO vehicle only. Three independent experiments (two replicates each) were performed for every test. Data are presented as mean±standard deviation. The solvents did not affect the viability of normal or CRC cell lines at the tested concentration (≤1%).
Statistical analyses
Measured data were statistically analyzed with STATISTICA software suite (version 14, 2020; TIBCO Software, Inc., Palo Alto, California, USA) using multifactor linear regression. The explanatory variables were the values for measured cannabinoid concentrations, while the dependent variables were percent viability of Caco-2, HT-29, and CCD 841 CoN cells.
The base models included all the explanatory variables and were further enhanced by removing statistically nonrelevant variables using stepwise selection. A combination of both forward-stepwise and backward-stepwise adjustments was performed to establish a set of most relevant explanatory variables. The significance of each variable was measured by a standard t-test with a p-value <0.05 as a threshold. The overall model's statistical significance was verified using the F-test, and each model's goodness of fit was ascertained with the adjusted R-squared statistic. We also evaluated the residuals (differences between observed and predicted values) for selected models to determine if they followed a normal distribution using the Shapiro–Wilk test aided by observations of the respective Q–Q plots.
Results
Cannabinoid content in cannabis extracts
The content of cannabinoids in cannabis extracts was measured after individual treatments (AT, BT, CT, DT) in both nutritional cycles (1C, 2C) every week for the entire vegetation cycle (13 weeks). Seventeen phytocannabinoids were identified and measured. The ten with the highest concentration are described in this study.
As this is chemotype I, the most abundant cannabinoid in plants and subsequently also in cannabis extracts was THCA. THCA content in plants increased with time, and its maximum concentration was reached at full maturity of the plants, from the 7th to the 13th week, depending on the nutritional cycle and treatment (Table 2). The highest average concentration of THCA in the cannabis extract was achieved in 1C of AT at week 13 (2029±157 μg/mL). The concentration of THCA decarboxylation products such as Δ 9 -tetrahydrocannabinol (Δ 9 -THC) and Δ 8 -tetrahydrocannabinol (Δ 8 -THC) and THCA oxidative degradation products, such as cannabinolic acid, increased proportionally with the THCA content. Furthermore, the concentration of cannabichromenic acid gradually decreased in proportion to the age of the plant. Other phytocannabinoids did not show a consistent trend over time.
Cannabinoid Content (μg/mL) in Cannabis Extracts from Different Treatments (AT, BT, CT, DT) of both Nutritional Cycles (1C, 2C) by Vegetation Weeks (1–13)
Recirculation cycle.
Drain-to-waste cycle.
Control (AT) and enhanced treatments (BT, CT, DT).
Control treatment (AT).
Enhanced treatment C (CT) with the addition of P, K, and Fe.
Enhanced treatment B (BT) with the addition of amino acids.
Enhanced treatment D (DT) with the addition of amino acids, P, K, and Fe.
Cytotoxicity of cannabis extracts
Cannabis cytotoxicity was tested on three cell lines. The tested extracts showed no cytotoxic effect on the Caco-2 cell line. For this reason, it was not considered further. Almost all extracts were cytotoxic to cell line HT-29 at lower concentrations than other cell lines (Table 3). The selective cytotoxicity of the extracts was compared with the normal cell line CCD 841 CoN, where in most cases, a much higher extract concentration was required for IC50. The most effective extracts on HT-29 were from the final weeks of growth, where the lowest average concentration of cannabis extract was achieved in 1C of AT at week 13 (31.6±5.0 μg/mL).
Inhibitory Concentrations (IC50, μg/mL) of Cannabinoids from Cannabis Extracts on Selected Cell Line Types
The bold ratio values below 0.5 mean a strong selectivity index.
Human colorectal cell line.
Normal human colon epithelial cell line.
Selectivity Index as the ratio of IC50 of cancer cell line HT-29 to that of normal cell line CCD 841 CoN.
Recirculation cycle.
Drain-to-waste cycle.
Control (AT) and enhanced treatments (BT, CT, DT).
Control treatment (AT).
Enhanced treatment C (CT) with the addition of P, K, and Fe.
Enhanced treatment B (BT) with the addition of amino acids.
Enhanced treatment D (DT) with the addition of amino acids, P, K, and Fe.
Statistical evaluation of the dependence of cytotoxicity on individual phytocannabinoids
The statistical analysis was based on a linear regression model of the dependence of the IC50 value of CRC cell line HT-29 on concentrations of individual cannabinoids in cannabis extracts. The phytocannabinoids that most influenced the cytotoxicity of individual extracts on HT-29 according to the p-value were cannabigerol (CBG) and Δ 9 -THC (Table 4).
Regression Summary for Dependent Variable, HT-29
b* indicates standardized beta coefficient that indicates the relative change of the variable.
Bold value indicates the variables that are statistically significant based on the p-values.
Based on forward and backward stepwise selections, a custom model was created that included all crucial variables from the group of cannabinoids in individual cannabis extracts (Table 5). In addition to the already mentioned CBG and Δ 9 -THC, cannabidiol (CBD), cannabigerolic acid (CBGA), and THCA were also included. This model showed almost 70% influence by these phytocannabinoids. Graphic processing of the custom model was performed (Fig. 1). Based on the t test, we found that THCA had the strongest cytotoxic effects on HT-29. Therefore, a model was created with THCA as the only variable, and it was proven to affect the cytotoxicity of individual extracts by almost 65% (Table 6).
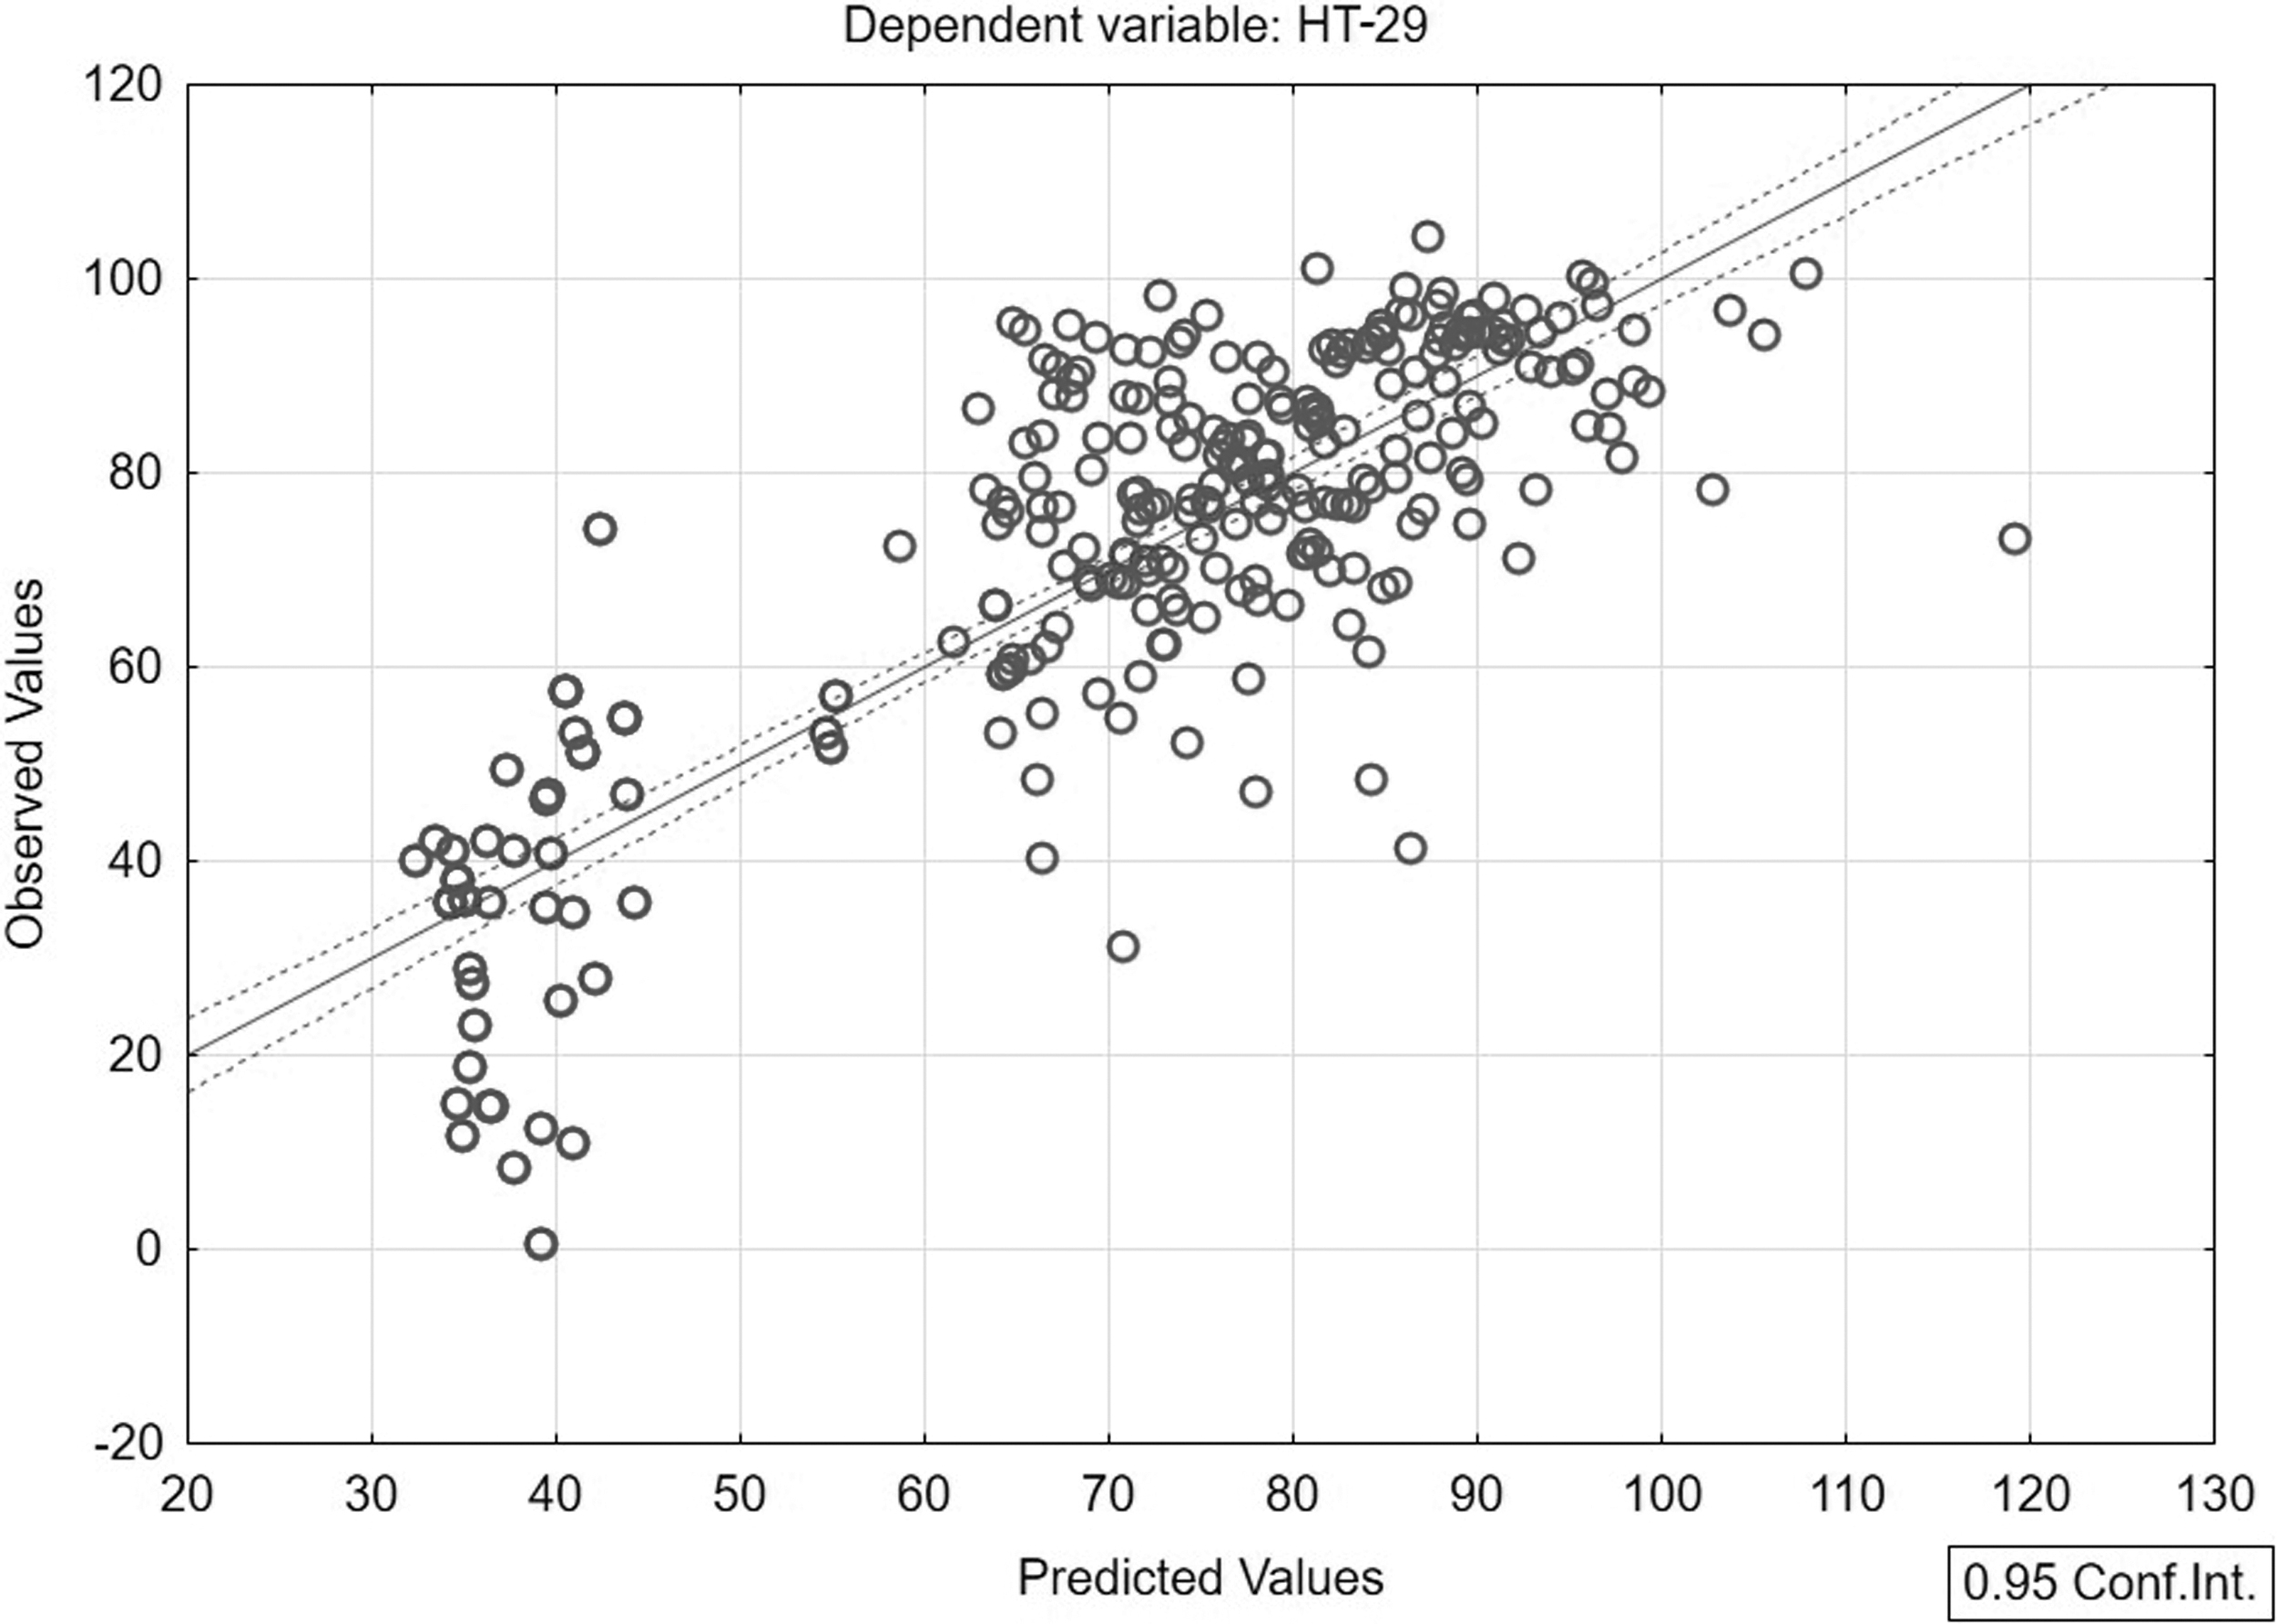
Custom model of predicted versus observed values.
Custom Model of Regression Summary for Dependent Variable, HT-29
b* indicates standardized beta coefficient that indicates the relative change of the variable.
Bold value indicates the variables that are statistically significant based on the p-values.
Tetrahydrocannabinolic Acid Model of Regression Summary for Dependent Variable, HT-29
b* indicates standardized beta coefficient that indicates the relative change of the variable.
Bold value indicates the variables that are statistically significant based on the p-values.
Since the maximum IC50 value at which cytotoxicity was tested was 128 μg/mL, inverted values were used in our model. Thus, an IC50 value >128 μg/mL was designated as 0 and the higher the inverted values obtained for individual extracts, the more cytotoxic they were. This model was not applied to the CRC cell line Caco-2 or to the normal human colon epithelial cell line, CCD 841 CoN, because many of the extracts required concentrations of >128 μg/mL to reach IC50.
Discussion
Cannabis research has developed in recent years,30,31 but mostly toward CBD strains, so-called hemp, with the psychoactive component in the form of Δ 9 -THC at a concentration less than 0.3%. 32 Currently, there is still a lack of basic research information on the regulation of the biosynthesis of THCA and the secondary metabolites in the THCA-predominant chemotype of medical cannabis, and its pharmaceutical potential because of legal restrictions in most countries. 18
This study provides evidence of selective cytotoxic activity of C. sativa extracts against colon cancer cells across all plant vegetation stages (1st–13th week), different treatments (AT, BT, CT, DT), and nutritional cycles (1C, 2C). This variety of medical cannabis is classified as chemical phenotype I, in which THCA is the main active component. 33 Depending on the time when the plants were harvested, these cannabis extracts also contain a large amount of THCA decarboxylation products in the form of Δ 9 -THC and its thermodynamically more stable isomer Δ 8 -THC. 34
Furthermore, there is a large concentration of CBGA, the primary precursor of phytocannabinoid biosynthesis, and its decarboxylation product CBG, and also, a significant amount of CBD (Table 2). Cannabinoids are mainly found in the form of acids in plants. 23 The larger amount of decarboxylated phytocannabinoids contained in these extracts was probably due to the evaporation of ethanol in a vacuum evaporator and the subsequent dissolving of the dry matter in DMSO.35–37 However, from a statistical point of view, this contributed to the more significant heterogeneity of the cannabis extracts and the subsequent proof of their possible effect.
Phytocannabinoids act by modulating signaling pathways critical to controlling cell proliferation and survival. Many in vitro, ex vivo, and in vivo experiments have shown that phytocannabinoids inhibit cancer cell proliferation and induce their apoptosis.38–42 Cannabis extracts showed the highest selective cytotoxicity according to IC50 against HT-29 CRC cell line in the last weeks of vegetation (Table 3), when the THCA concentration also reached its maximum depending on the nutritional cycle and treatment. THCA alone contributed to the selective cytotoxicity of cannabis extracts against HT-29 by almost 65% (Table 6).
Several cell line-based experiments have shown that THCA interacts with various molecular targets and exhibits potential neuroprotective, anti-inflammatory, immunomodulatory, cytotoxic, and antineoplastic properties.43–45 In addition, several in vivo studies showed that this compound exhibits pharmacological effects in rodents, possibly by the involvement of cannabinoid type 1 (CB1) receptors. 44 There was also an effort to include all important variables from the cannabinoid group in individual cannabis extracts.
Based on forward and backward stepwise selections, we obtained the other phytocannabinoids, CBGA, CBG, CBD, and Δ 9 -THC. These four phytocannabinoids contributed an additional 5% to selective cytotoxicity. Altogether, these five phytocannabinoids influenced the cytotoxicity effect of the extracts by almost 70% (Table 5). This confirms the previously proposed synergism between the active compounds in the cannabis plant. Therefore, the unrefined content of flower extracts with their cocktail of various extracted compounds may have an advantage over the activity of isolated compounds. 46 Mixtures of different phytocannabinoids of C. sativa show a specific interaction for cellular cytotoxic activity and are more biologically active than single phytocannabinoids.39–41
Conclusions
This study provides evidence of selective cytotoxic activity of C. sativa extracts from a THCA-predominant chemotype against CRC cell lines at all vegetative stages (1st–13th week), different nutritional cycles (1C, 2C), and treatments (AT, BT, CT, DT). Cannabis extracts showed the highest selective cytotoxicity effect, according to IC50, against HT-29 CRC cells in the last weeks of growth, when THCA concentration also reached its maximum depending on the nutritional cycle and treatment. THCA alone contributed almost 65% to the selective cytotoxicity effect of cannabis extracts against HT-29. CBGA, CBG, CBD, and Δ 9 -THC contributed an additional 5% to the selective cytotoxicity. Altogether, these five mentioned phytocannabinoids affected the cytotoxicity of the extracts by almost 70%. This confirms the previously proposed synergistic or additive effect between cannabinoid compounds produced by medical cannabis plants.
Footnotes
Acknowledgments
The authors thank Dr. Gary Bentley of On the Mark Scientific Editing for editing and improving the article's English.
Authors' Contributions
M.M. designed the study, wrote the article, controlled the cultivation scheme, and performed physiological, chemical, and data analyses. I.D. coordinated and executed the cytotoxicity assay and data analysis. J.P. and M.U. performed the statistical data processing. L.P. performed chemical analyses. P.K. and B.L. performed the cytotoxicity assay. A.K. provided sample dilution and filtration. P.T. supervised the study.
Author Disclosure Statement
The authors declare that the research was conducted without any commercial or financial relationships that could be construed as a potential conflict of interest.
Funding Information
This work was partly supported by the Internal Grant Agency of the Faculty of Economics and Management CZU Prague, grant no. 20171023. The METROFOOD-CZ research infrastructure project (MEYS Grant No.: LM2018100) included access to its facilities.