




Abstract
Abstract
Reprogramming of somatic cells to generate induced pluripotent stem cells (iPSCs) has considerable latency and generates epigenetically distinct partially and fully reprogrammed clones. To understand the molecular basis of reprogramming and to distinguish the partially reprogrammed iPSC clones (pre-iPSCs), we analyzed several of these clones for their molecular signatures. Using a combination of markers that are expressed at different stages of reprogramming, we found that the partially reprogrammed stable clones have significant morphological and molecular heterogeneity in their response to transition to the fully pluripotent state. The pre-iPSCs had significant levels of OCT4 expression but exhibited variable levels of mesenchymal-to-epithelial transition. These novel molecular signatures that we identified would help in using these cells to understand the molecular mechanisms in the late of stages of reprogramming. Although morphologically similar mouse iPSC clones showed significant heterogeneity, the human iPSC clones isolated initially on the basis of morphology were highly homogeneous with respect to the levels of pluripotency.
Introduction
I
The process of reprogramming proceeds through distinct stages brought about by the coordinated action of the four transcription factors used for reprogramming (Hochedlinger and Plath, 2009; Huang et al., 2009; Papp and Plath, 2013; Samavarchi-Tehrani et al., 2010). The initial stages of reprogramming are characterized by gross changes at the molecular and morphological levels that destabilize the mesenchymal phenotype of fibroblasts to an epithelial-like state. Subsequently, a subset of stable cells activates the core pluripotency-associated genes leading to transgene independence and the maintenance and establishment of the endogenous pluripotency network (David and Polo, 2014; Hansson et al., 2012; Polo et al., 2012). Other final molecular changes include complete decondensation of chromatin as in ESCs (Papp and Plath, 2013; Polo et al., 2012), reactivation of an inactive X chromosome (Fussner et al., 2011; Tchieu et al., 2010), and erasure of the epigenetic memory of the somatic cell of origin (Kim et al., 2010; Polo et al., 2010).
The majority of the cells that express the reprogramming factors do not complete reprogramming due to the molecular barriers in each step, resulting in a significant reduction in the efficiency of the process. The efficiency of reprogramming can be improved significantly by including additional factors that help the cells transit through these barriers. Apoptosis, senescence, and cell cycle arrest occur in the early stages of reprogramming, and their suppression results in higher reprogramming efficiency (Banito et al., 2009; Kawamura et al., 2009). The sustained expression of somatic cell pathways and suppression of mesenchymal-to-epithelial transition (MET) are two major barriers in the initial stages of reprogramming (Li et al., 2010; Samavarchi-Tehrani et al., 2010). Suppression of the transforming growth factor-β (TGF-β) pathway or activation of the bone morphogenetic protein (BMP) pathway promote MET and increase reprogramming efficiency (Ichida et al., 2009; Samavarchi-Tehrani et al., 2010). The class of partially reprogrammed cells that successfully pass through the initial stages and fail to activate the endogenous pluripotency genes are referred to as pre-iPSCs (Theunissen et al., 2011). Inhibition of TGFβ or mitogen-activated protein kinase and extracellular signal-regulated kinases (MEK-ERK) signaling pathways, treatment with ascorbic acid and other small molecules that affect epigenetic modifications, and ectopic expression of NANOG have been shown to facilitate the transition of pre-iPSCs to the pluripotent state (Esteban et al., 2010; Maherali and Hochedlinger, 2009; Silva, 2009; Silva et al., 2008; Yuan et al., 2011). The morphology and proliferative and biosynthetic properties of pre-iPSCs are similar to iPSCs and, therefore, they are valuable tools to study the barriers and enhancers of the late stages of reprogramming (Mikkelsen et al., 2008; Plath and Lowry, 2011; Silva et al., 2008; Sridharan et al., 2009).
In this study, we analyzed retroviral transgene silencing and expression of pluripotency genes in the iPSC and the pre-iPSC clones that were isolated initially on the basis of mESC-like morphology to understand molecular heterogeneity. Subsequent analysis of the pre-iPSC clones suggested further heterogeneity with variable levels of somatic and embryonic gene expression and their response to small molecules and culture conditions that favor a transition of pre-iPSCs to fully pluripotent state. We identified that mouse pre-iPSCs were in an OCT4+NANOG− intermediate stage with differential expression of mesenchymal and epithelial genes. However, although human somatic cell reprogramming generates several partially reprogrammed colonies, those that are isolated on the basis of their typical morphology do not show significant heterogeneity in their pluripotency levels.
Materials and Methods
Cell culture
Mouse MEFs were derived from embryos at 13.5 days postcoitus (d.p.c.) obtained from C57BL/6 (B6) and 129S4-Pou5f1tm1Jae/J mouse strains. MEFs, SNL and Plat-E cells were cultured in Dulbecco's Modified Eagle Medium (DMEM) containing 10% fetal bovine serum (FBS) at 37°C and 5% CO2. MEFs and SNL feeder cells were cultured on gelatin-coated plates. The iPSCs were cultured in FBS-miPSC medium containing DMEM supplemented with 1 mM sodium pyruvate, 2 mM
In small molecule treatment experiments, FBS-miPSC medium was supplemented with 50 μM of vitamin C (Vc; Sigma A4034), 0.5 mM sodium butyrate (NaBu; Sigma B5887), 0.5 mM valproic acid (VPA; Sigma P4543), 20 nM trichostatin A (TSA; Invivogen met-TSA), or 0.5 μM 5-azacytidine (5-AzaC; Sigma A2385). Adult human dermal fibroblasts (AHDFs) from Cascade Biologicals were grown in alpha-minimum essential medium (α-MEM) with 20% heat-inactivated FBS at 37°C and 5% CO2. Human iPSC colonies were maintained in a medium containing DMEM-F12 with 20% KOSR, 2 mM
Generation of miPSC clones
For the generation of miPSCs, the isolated MEFs were subjected to retroviral transduction before passage 2. Plat-E cells were seeded at a density of 1.3 × 10⁶ cells/well of a six-well dish, and after 24 h and they were transfected individually with the plasmids, pMXs-Oct4 (Addgene-13366), pMXs Sox2 (Addgene-13367), pMXs-c-Myc (Addgene-13372) pMXs-Klf4 (Addgene-13370), and pMXs-mRFP1 (Addgene-21315) using X-tremeGENE HP DNA Transfection Reagent (Roche). The viral supernatants were collected 48 h after transfection and were filtered through 0.45-μm syringe filters. The viral titer was determined using a QuickTiter™ Retrovirus Quantitation Kit from Cell Biolabs Inc (VPK-120).
For transduction, 4.7 × 10¹³ VP/mL of individual retroviruses were mixed and supplemented with 4 μg/mL Polybrene to transduce 1.8 × 10⁴ MEFs plated in a well of a six-well dish. After 5 days, the transduced MEFs were dissociated using 0.05% trypsin, and 5 × 10³ cells were seeded onto mitotically inactive SNL feeder cell layers plated at the density of 1.5 × 10⁵ cells/well of a six-well dish with FBS-miPSC medium. The cells were cultured in FBS-miPSC medium until the colonies emerged. The medium was replenished on every alternative day. From days 13 to 15, miPSC colonies with typical ESC-like morphology were marked under an inverted microscope and handpicked under sterile conditions. The clones were carefully dissociated using 0.05% trypsin and plated in 48-well plates containing SNL feeder cells in FBS-miPSC medium. The miPSC clones were maintained for 10–16 passages, and the mRFP (red fluorescent protein) status of the clones was monitored periodically using a fluorescent microscope (Leica DMI6000 B).
Generation of human iPSC clones
For the generation of human iPSCs, AHDF cells were first transduced with lentiviruses carrying pLenti6/UbC/mSlc7a1 (Addgene-17224) coding for the mouse receptor Slc7a1 (Takahashi et al., 2007) and followed by transduction with retroviruses, as described above for the generation of miPSC clones. The plasmids used were pMXs-mRFP1 (Addgene-21315), pMXs-hOCT3/4 (Addgene-17217), pMXs-hSOX2 (Addgene-17218), pMXs-hKLF4 (Addgene-17219), and pMXs-c-MYC (Addgene-17220). On day 4 following transduction, the cells were seeded on mitomycin C–treated SNL feeder cells in fibroblast medium and 2 days later the culture was switched to hiPSC medium. The cells were fed with hiPSC medium daily and observed for the formation of colonies with morphology resembling human embryonic stem cells (hESCs). RFP expression status of the emerging colonies was observed to monitor transgene silencing. For derivation of hiPSC lines, from day 14 to 18, the large colonies with hESC-like morphology were marked under an inverted microscope, handpicked using a micropipette, dissociated mechanically into smaller clumps, and plated on 12-well plates with an SNL feeder cell layer in hiPSC medium. Subsequently, individual hiPSC lines were scaled up on SNL feeder cell layers by passaging them using 1 mg/mL Collagenase IV (Gibco).
Flow cytometry
The single-cell suspensions of miPSCs obtained after treatment with trypsin were incubated with fluorescence-conjugated antibodies for 30 min at 37°C in the dark. After incubation, the cells were washed twice with phosphate-buffered saline (PBS) and resuspended in 2 mL of FBS-miPSC medium. Analysis and sorting of the cells expressing these markers were performed using a FACSAria III cell sorter (BD Biosciences). The antibodies used were SSEA-1-FITC and CD44-FITC purchased from BD Biosciences.
Immunofluorescence
The colonies and the embryoid bodies (EBs) were washed with PBS and fixed with 4% paraformaldehyde for 20 min. The fixed cells were then washed with PBS and then blocked in PBS containing 1% bovine serum albumin (BSA; Sigma) and 5% goat serum (Vector Labs) for 45 min. For intracellular protein analysis, 0.1% Triton X-100 (Sigma) was used in the blocking buffer for cell permeabilization. Primary antibodies used included anti-mouse SSEA1 (Millipore), anti-mouse OCT4 (Abcam), anti-mouse AFP antibody (R&D), anti-mouse smooth muscle actin antibody (Abcam), anti-mouse β-tubulin antibody (Millipore), anti-human SSEA-4 (Millipore), anti-human TRA-1-60 (SantaCruz), anti-human TRA-1-81 (SantaCruz), anti-human NANOG (Cell Signaling), anti-human OCT4 (Cell Signaling), anti-human SOX2 (Cell Signaling), and anti-human LIN28 (Cell Signaling). For anti-mouse NANOG immunostaining, a fluorescence-conjugated antibody (e-Biosciences) was used. These antibodies were diluted as per the manufacturer's recommendations in 1× PBS containing 1% BSA and incubated overnight at 4°C. After washing, the cells were incubated with goat secondary antibody against mouse or rabbit immunoglobulin G (IgG) conjugated with Alexa Fluor 488 and Alexa Fluor 594 (Life Technologies) in PBS containing 1% BSA for 1 h followed by washing with 1× PBS. Cells were then imaged using a fluorescence microscope (Leica) with appropriate filters.
Western blotting
Cell lysates were prepared from pre-iPSCs, iPSCs, and R1ESCs using RIPA buffer [150 mM sodium chloride, 1% NP-40, 0.5% sodium deoxycholate, 0.1% sodium dodecyl sulfate (SDS), 50 mM Tris, pH 8.0, and protease inhibitors (cOmplete™ Protease Inhibitor Cocktail, Roche)]. A 20μg amount of the cell lysate was loaded and separated in 4–20% mini-PROTEAN® TGX™Gel (Bio-Rad), and the separated proteins were transferred to an Immobilon-P polyvinylidene fluoride (PVDF) membrane (Millipore). After blocking, the membrane was incubated with E-cadherin (BD Bioscience) and β-actin (Sigma) antibodies and subsequently with horseradish peroxidase– (HRP) conjugated anti-mouse secondary antibodies. Detection was performed with Supersignal® West Femto Luminol solution (Thermo).
Gene expression analysis by real-time PCR
Single-cell suspensions of miPSCs and hiPSCs were obtained by treating the colonies with 0.05% trypsin (Gibco) for 2–3 min and then with an equal volume of DMEM containing 10% FBS. miPSCs were collected by centrifugation (800 rpm for 5 min at 37°C), and the pellet was resuspended in miPSC medium. For the removal of SNL feeder cells, the resuspended cells were seeded on a 35-mm dish and incubated at 37°C and 5% CO2 for 20 min, and the floating cells, which mostly contained miPSCs, were harvested. For the complete removal of feeder cells from RFP+ pre-iPSCs (type III clones), the colonies maintained on the feeders were trypsinized and RFP+ cells were flow sorted. Feeder cells from hiPSC colonies were removed by treating the colonies on feeder cells with 1 mg/mL collagenase IV and gentle pipetting to dislodge the feeder cells prior to trypsin treatment. Total RNA was isolated from harvested miPSCs and hiPSCs using RNAiso Plus (Takara) reagent, and 500 ng of RNA was used for reverse transcription reaction using a High-Capacity cDNA Reverse Transcription Kit (Life Technologies), according to the manufacturer's instructions. Quantitative RT-PCR was performed with SYBR Premix Ex Taq II (Takara) and analyzed with ABI 7500 and 12K Flex Real-Time PCR systems (ABI-Life technologies). The primer sequences used in this study are included in the Table S1 (Supplementary Data are available at www.liebertpub.com/cell/).
EB differentiation
For the derivation of EBs, miPSC clones were dissociated, cultured for 2 days by the hanging drop method, and then cultured in suspension for another 4 days on nonadherent dishes. On day 7, EBs were picked and transferred to adherent dishes and cultured until days 16–17. Immunofluorescence was performed to analyze protein expression.
Alkaline phosphatase staining
Alkaline phosphatase staining was performed using a Leukocyte Alkaline Phosphatase kit (Sigma-Aldrich) following the manufacturer's instructions.
Bisulfite sequencing
The genomic DNA from R1ESCs, iPSCs and pre-iPSCs was extracted using a Gentra Puregene Kit (Qiagen). Subsequently, we treated 1 μg of genomic DNA with sodium bisulfite using an EpiTect Bisulfite Kit (Qiagen), following the manufacturer's instructions. The converted DNA was amplified with Oct4 and Nanog promoter-specific primer sequences (Yamanaka, 2006) using EmeraldAmp Max HS PCR Mastermix (Takara); the amplified fragments were ligated into a pCR2.1 vector (Life Technologies). The ligated products were transformed into XL1-Blue competent cells (Agilent Technologies), and plasmids were isolated from 10 randomly picked colonies. The inserts were sequenced and analyzed using QUMA software (RIKEN, Japan; http://quma.cdb.riken.jp/).
Teratoma assay
Undifferentiated human iPSC colonies were treated with 1 mg/mL collagenase IV, and the feeders were removed by flushing the culture surface with Dulbecco's PBS (DPBS). The colonies were harvested in DMEM-F12 by collecting them using a scraper and processed according to a previous protocol (Lerou et al., 2008). Briefly, the colony suspension was centrifuged at 800 rpm for 5 min at room temperature, and the pellet from one 50–70% confluent 10-cm dish was gently resuspended in 40 μL of cold DMEM-F12, 80 μL of collagen I (Gibco), and 120 μL of hESC-qualified Matrigel (BD Biosciences). A 100-μL amount of each of colony suspension was taken for intramuscular injection into both hind limbs of B6.CB17-Prkdcscid/SzJ mice.
Results
Very few reprogrammed clones with mouse ESC morphology attain pluripotency marker expression
For generating miPSCs from MEFs, MEFs were transduced with retroviruses to express OSKM (Oct4, Sox2, Klf4, and c-Myc) and mRFP. Analysis by fluorescence microscopy at 48 h posttransduction showed that 70–80% of the cells expressed RFP (RFP+), suggesting that the majority of the generated miPSC clones would have integrated the mRFP gene (Fig. S1A). After 5 days, the cells were passaged and seeded on mitotically inactive feeder cells, and on day 6 the medium was switched to FBS-miPSC medium containing LIF. The dome-shaped colonies with clearly defined boundaries similar to that of mESCs could be found emerging on the feeder layers starting from day 10 onward, and a total of 29 colonies were handpicked starting from day 13 from two independent experiments. In the first experiment, we picked up 10 colonies on the basis of morphology alone and in the second experiment we picked up 19 RFP+ colonies with miPSC morphology.
All the clones maintained miPSC morphology in the initial passages (passages 3–6) and expressed stage-specific embryonic antigen-1 (SSEA1) and alkaline phosphatase (AP) markers that are expressed in both partially and fully reprogrammed colonies (Maherali and Hochedlinger, 2008; Polo et al., 2012). NANOG is expressed in the late stages of reprogramming, and its expression correlates well with pluripotency of the clones (Silva, 2009; Stadtfeld et al., 2008). Retroviral transgene (RV-Tg) silencing also occurs in the late stage of reprogramming, and it can distinguish fully reprogrammed iPSC clones from partially reprogrammed clones (Hotta and Ellis, 2008; Hotta et al., 2009; Stadtfeld et al., 2008). We measured Nanog expression by real-time PCR and immunofluorescence, and out of 29 clones, significant Nanog levels were found only in five clones (Fig. 1C). On the basis of Nanog and retroviral-RFP (RV-RFP) expression, the clones were classified into different types. Out of the five NANOG+ clones, three were RV-RFP− and these NANOG+RV-RFP− clones were classified as type I (Fig. 1A). Genomic PCR confirmed that mRFP was integrated into the genome of the type I clones and the lack of RV-RFP expression was due to RV-Tg silencing (Fig. S1B). The two clones that had both NANOG and RV-RFP expression (NANOG+RV-RFP+) were classified as type II (Fig. 1A). The majority of the clones (n = 24) lacked NANOG expression but had RV-RFP expression, and these NANOG−RV-RFP+ clones were classified as Type III (Fig. 1B).

Classification of miPSC clones on the basis of morphology and expression of RV-Tg and Nanog. Persistence of RV-Tg expression was measured analysis of RV-RFP expression by fluorescence microscopy. (
RV-Tg silencing is an event that occurs downstream of NANOG expression (Fussner et al., 2011); thus, we hypothesized that the type II clones have slow retroviral silencing dynamics. To understand the effect of the long-term culture of the clones in the expression of pluripotency genes and in RV-Tg silencing, we cultured the two type II clones for additional passages. Over the course of five to six passages (18 days), these clones showed the emergence of NANOG+RV-RFP− miPSC clones (Fig. 1A). One of the clones was surrounded by RFP+ cells with morphology similar to MEFs. To isolate the RV-RFP− miPSCs, we purified SSEA1+RV-RFP− cells by flow cytometry and expanded them on feeder cells (Figures S2A–C). The flow-sorted mESC-like colonies maintained high levels of Nanog and Oct4 and silencing of all the transgenes throughout the culture until passage 14 (Fig. S2D).
Bisulfite sequencing analysis of Nanog promoter showed hypomethylation of this region in type I and RV-RFP- type II clones (Fig. 1D). Type I and RFP-type II clones could be differentiated efficiently via EBs into tissues of all three germ layers in vitro (Fig. S3). Taken together, these observations suggest that only a few of the many morphologically identical miPSC clones achieve the benchmarks of pluripotency and the majority of the clones (type III) remain arrested in the partially reprogrammed state. Because there is a good correlation between retroviral silencing and Nanog expression, these two markers can be used for isolation of mature miPSC clones from partially reprogrammed clones.
Type III clones (pre-iPSCs) express high levels of OCT4
The type III clones resembled previously reported pre-iPSCs (Chen et al., 2013; Esteban et al., 2010; Silva et al., 2008; Theunissen et al., 2011) because they had miPSC morphology and expressed AP and SSEA1 and did not express NANOG. DNA methylation analysis showed hypermethylation of Nanog promoter in these clones (Fig. 1D), and these clones could not be differentiated in vitro. Interestingly, we observed that all the type III clones expressed high levels of endogenous Oct4 mRNA transcripts as measured by real-time PCR (Fig. 2A). Amplification of full-length Oct4 cDNAs confirmed that endogenous Oct-4 is activated significantly in all the pre-iPSC clones (Fig. 2B), and DNA methylation analysis of Oct-4 promoter showed hypomethylation of this region (Fig. 2C), suggestive of active transcription of Oct4 in these clones as in R1ESC and type I and type II clones. Previous studies using MEFs from OG2 mice harboring a green fluorescent protein (GFP) transgene driven by the Oct-4 promoter showed the lack of GFP expression in pre-iPSCs (Esteban et al., 2010). Our results confirm that pre-iPSCs represent a stable reprogramming intermediate state with significant Oct-4 expression and identified a molecular barrier in the final stages of reprogramming in the transition of OCT4+NANOG−RV-Tg+ pre-iPSC state to the OCT4+NANOG−RVTg− state. Studies on this unexplored barrier will provide us the insights into the mechanisms of late stages of reprogramming.
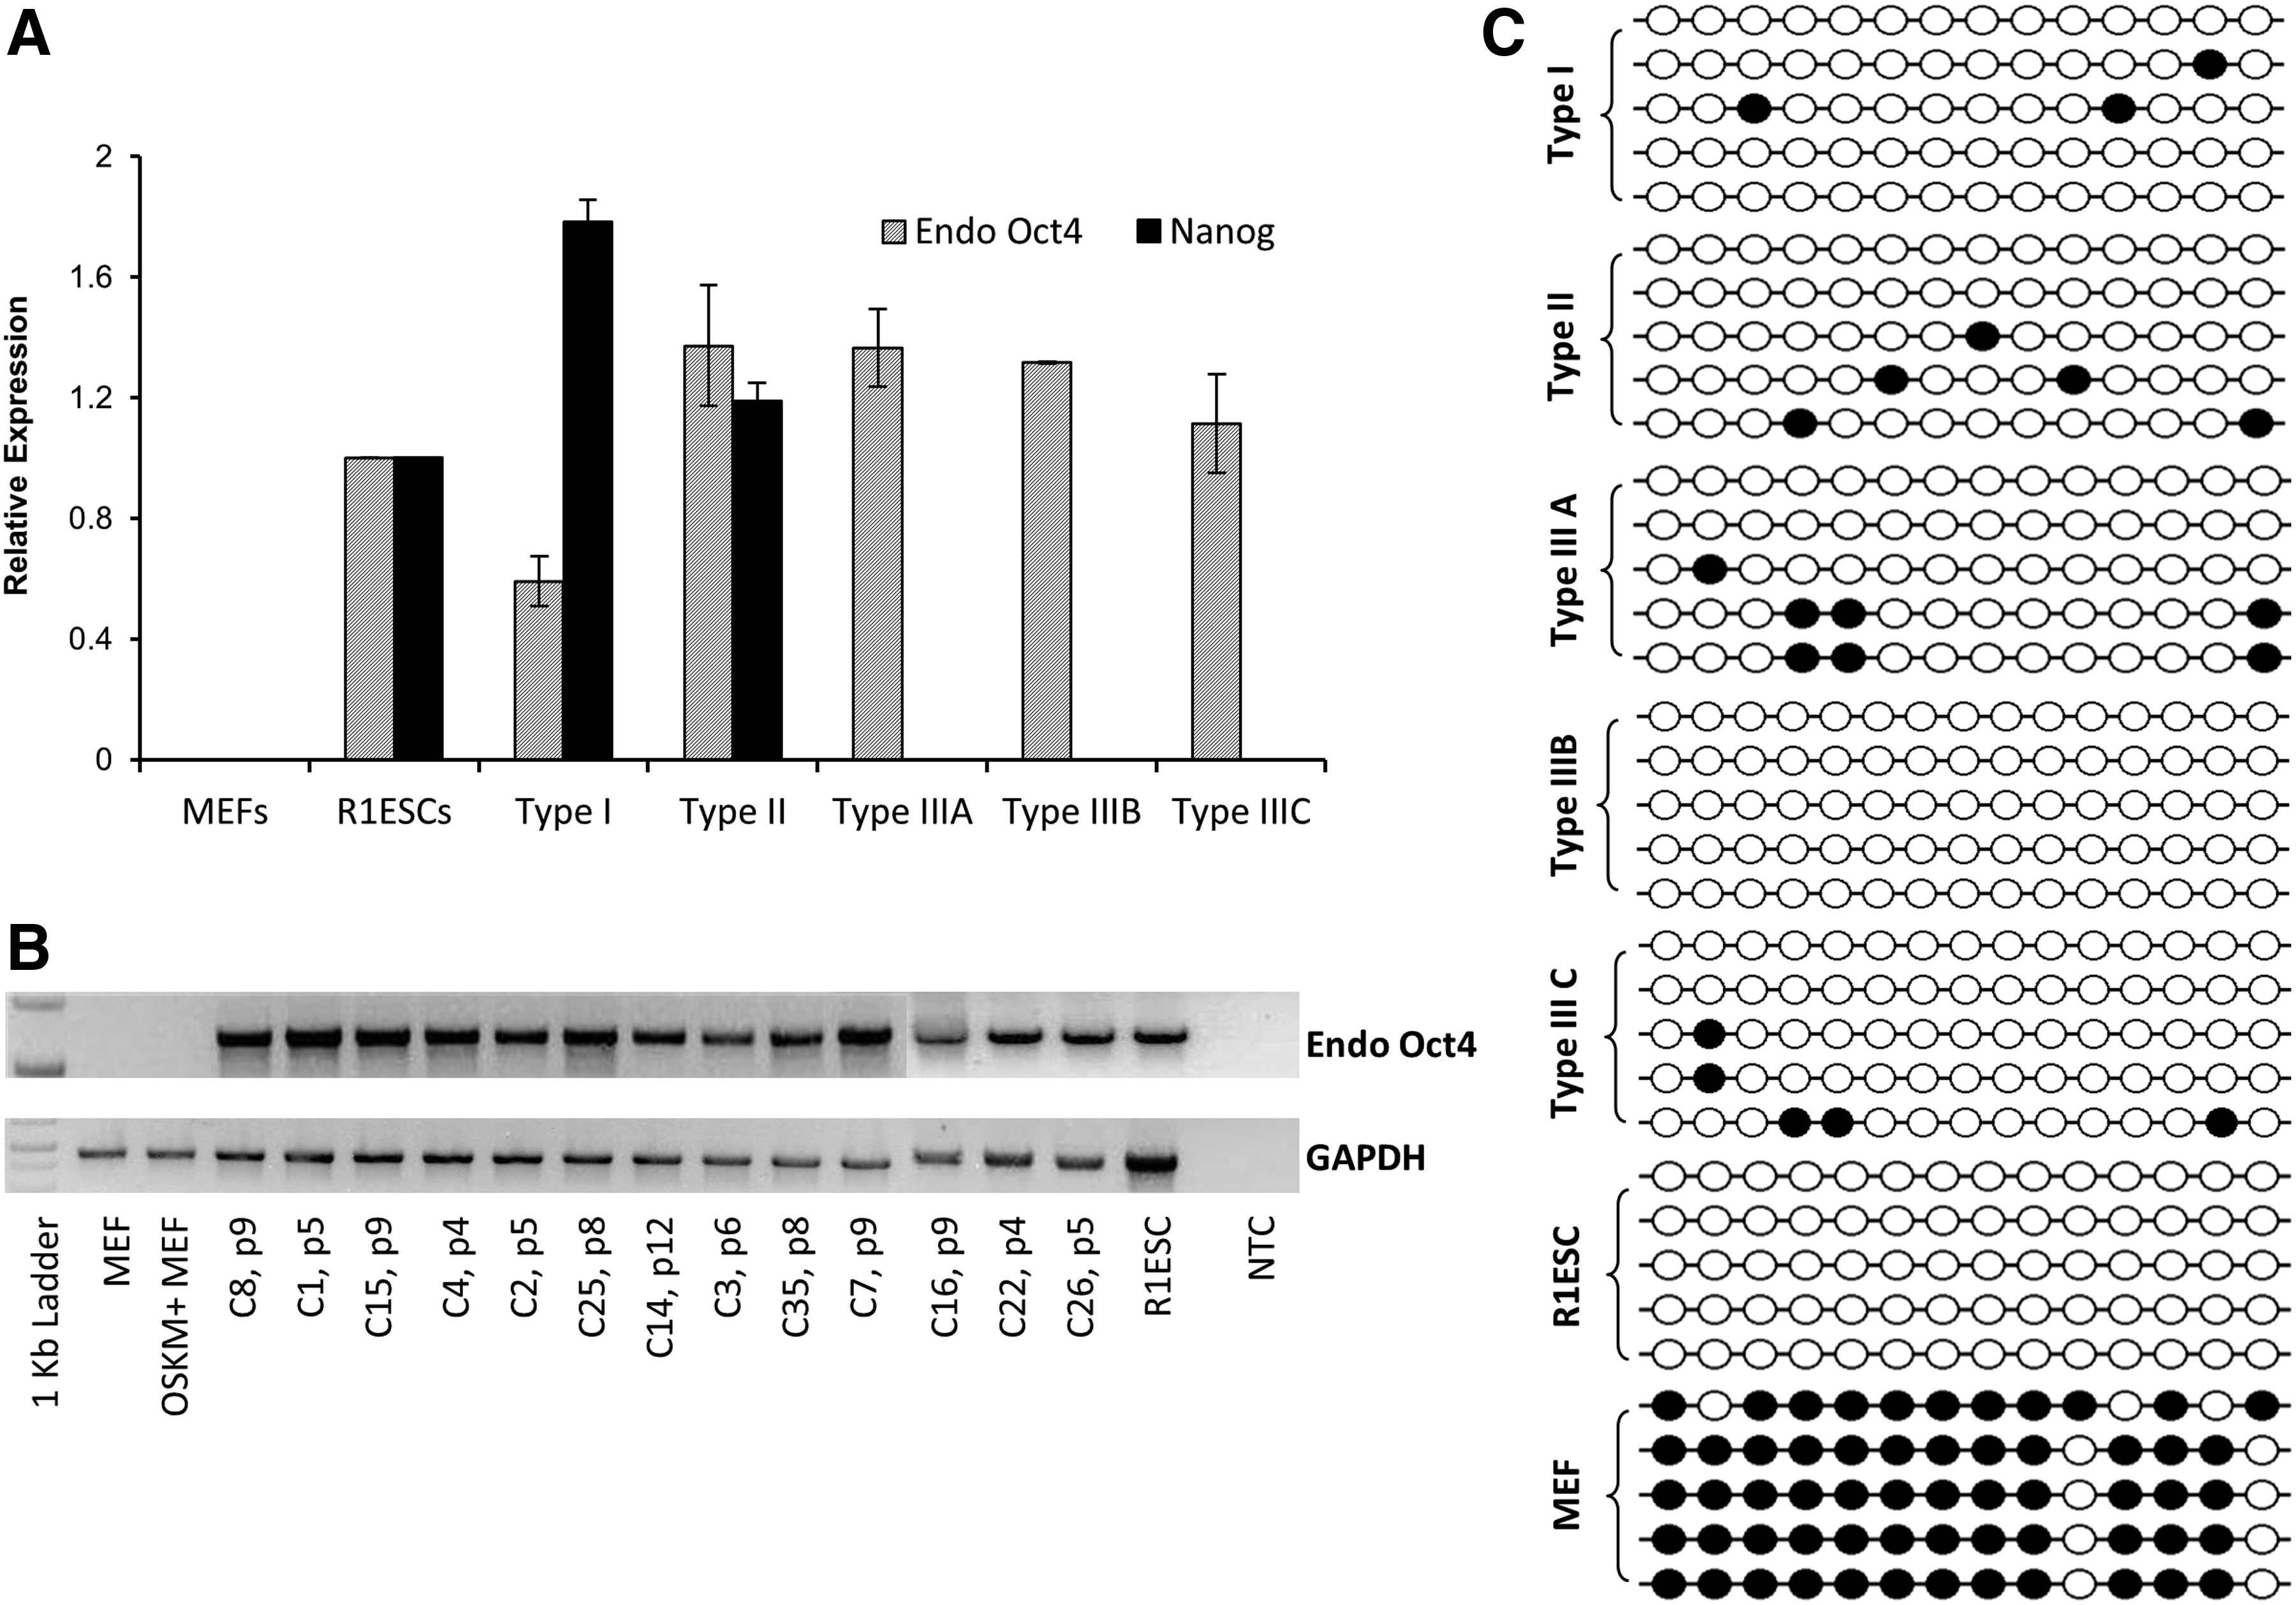
Oct-4 expression levels in different types of miPSC clones. (
Type III clones (pre-iPSCs) show significant heterogeneity in morphology and in their response to small molecules
Although the type III clones were initially picked on the basis of their mESC-like morphology with well-defined boundaries and refractile edges, after several passages they showed significant heterogeneity in their morphology and this demanded their further classification into three subtypes (Fig. 1B). Out of 24 type III clones, 18 clones that maintained compact mESC-like morphology throughout the course of passaging were classified as type IIIA, three clones that were interspersed with rapidly proliferating RV-RFP+ fibroblast-like cells were included in type IIIB, and three clones that had typical compact mESC-like morphology in the initial passages but subsequently generated rapidly proliferating round RV-RFP+ cells that were found attached to the iPSC colonies or floating in suspension were classified as type IIIC. These proliferating round RV-RFP+ cells had unstained cytoplasm with Trypan Blue, suggesting that they are live cells and, additionally, real-time PCR performed on these cells showed high expression of the retroviral transgenes and fibroblast-specific genes, but they lacked the expression of E-Cadherin and Nanog (data not shown).
Several small molecule modulators of the epigenome are reported to have a significant impact on the kinetics and efficiency of reprogramming. Vitamin C (Vc) inhibits senescence in cells undergoing reprogramming by reducing the Ink4a/Arf levels and inducing the expression of Jhdm1a/b that promote cell cycle progression (Wang et al., 2011). Histone deacetylase inhibitors such as NaBu, VPA, and TSA and the DNA methyltransferase inhibitor 5-AzaC have been reported to enhance reprogramming efficiency and could replace one or more of the transcription factors used for reprogramming (Huangfu et al., 2008a, b; Liang et al., 2010; Mali et al., 2010; Mikkelsen et al., 2008). KOSR that substitutes FBS in the ESC culture medium has been reported to enhance the derivation of mouse ESCs and also improves the quality, pace, and efficiency of miPSCs derivation (Cheng et al., 2004; Kang et al., 2010; Okada et al., 2010; Zhao et al., 2010). Vc, 5-AzaC, and KOSR have also been reported to modulate epigenetic processes to convert the pre-iPSCs into fully reprogrammed iPSCs (Esteban et al., 2010; Kim et al., 2014; Mikkelsen et al., 2008).
To understand whether there is a variability in the response of pre-iPSCs to small molecules, we treated two type IIIA clones (C7 and C8) and two type IIIC clones (C25 and C35) with NaBu, Vc, TSA, 5-AzaC, and VPA for four to five passages in the FBS-miPSC medium and Nanog and RV-RFP expression status was determined (Fig. 3). After 18 days of culture, clone C8 showed a dramatic increase in the expression of Nanog in the medium containing AzaC and Vc (Fig. 3A, C). In the presence of 5-AzaC and Vc, all the cells of this clone showed RV-RFP silencing by day 18 (Fig. 3D). But both NaBu and TSA did not show any change in Nanog levels and also did not exhibit RV-RFP silencing (Fig. 3A, D). Clone C7 showed significant expression of Nanog in 21 days in the medium containing Vc and TSA with steady RV-RFP silencing (Fig. 3A). Morphology of the clones was intact and no cell death due to the toxicity of reagents was observed. In the type IIIC clones, C25 and C35, Nanog activation and RV-RFP silencing were not observed after treating with any of these small molecules (Fig. 3A, E). However, VPA and 5-AzaC caused inhibition of the growth of rapidly proliferating round RV-RFP+ cells produced by the type III clones and only the colonies with miPSC morphology remained in the culture (Fig. 3E). But NaBu, TSA, and Vc could not prevent rapidly proliferating round RV-RFP+ cells, which continued to divide and proliferate throughout the culture.

Morphological changes, NANOG activation, and retroviral silencing in type III clones in response to small molecules and KOSR. C3, C7, C8, C14, C15, C25, and C35 represent different type III clones and the numbers in the brackets represent their passage numbers. (
It was shown earlier that all the pre-iPSCs derived from OG2 transgenic MEFs could develop GFP+ colonies after treating with Vc, and on this basis it was concluded that Vc can convert all of the pre-iPSCs to the iPSC state (Esteban et al., 2010). However, we analyzed six pre-iPSCs with Vc treatment, and only two clones showed Nanog activation and RV-Tg silencing. These results suggest that Oct4-GFP transgene expression is not a suitable marker for estimating the pluripotency state of miPSC clones.
Our findings clearly show that there is significant heterogeneity among the pre-iPSC clones in their response to small molecules and media conditions. Each epigenetic modifier small molecule was reported to cause specific molecular changes in reprogramming. However, we observed that small molecules with different epigenetic modification abilities could transform pre-iPSCs to the pluripotent state. For instance, clone C8 could be transformed by the inhibition of histone deacetylation with VPA or the activation of histone demethylation with Vc or the inhibition of DNA methylation with 5-AzaC, whereas clone C7 could be transformed by activation of histone demethylation and by inhibition of histone deacetylation or DNA methylation (Table S2).
KOSR facilitates mouse pre-iPSC-iPSC transition and increases reprogramming efficiency at all stages of reprogramming
When the pre-iPSC clones were cultured in the presence of KOSR-miPSC medium, Nanog expression and RV-Tg silencing were observed in six out of seven clones (Fig. 3B–D). KOSR treatment also could prevent the growth of rapidly proliferating RFP+ round cells present in the type IIIC clones (Fig. 3E). These data suggested that KOSR is the most efficient supplement that we tested in the medium for the conversion of pre-iPSCs to iPSCs. To assess further the pluripotency levels of NANOG+RV-RFP− iPSCs derived from pre-iPSCs in KOSR-miPSC medium, we analyzed the expression of Dnmt3b, Dppa4, Esrrb, Sall4, Stella, and Tbx3, which are known to be activated downstream of Nanog expression and are required for the maintenance and self-renewal of the pluripotent clones. The pre-iPSC clones cultured in the KOSR-miPSC medium expressed substantial levels of these late-stage markers compared to the same clones cultured in the FBS-miPSC medium (Fig. 4A). These observations further substantiate that the KOSR conditions facilitate the conversion of pre-iPSCs to truly pluripotent clones efficiently.
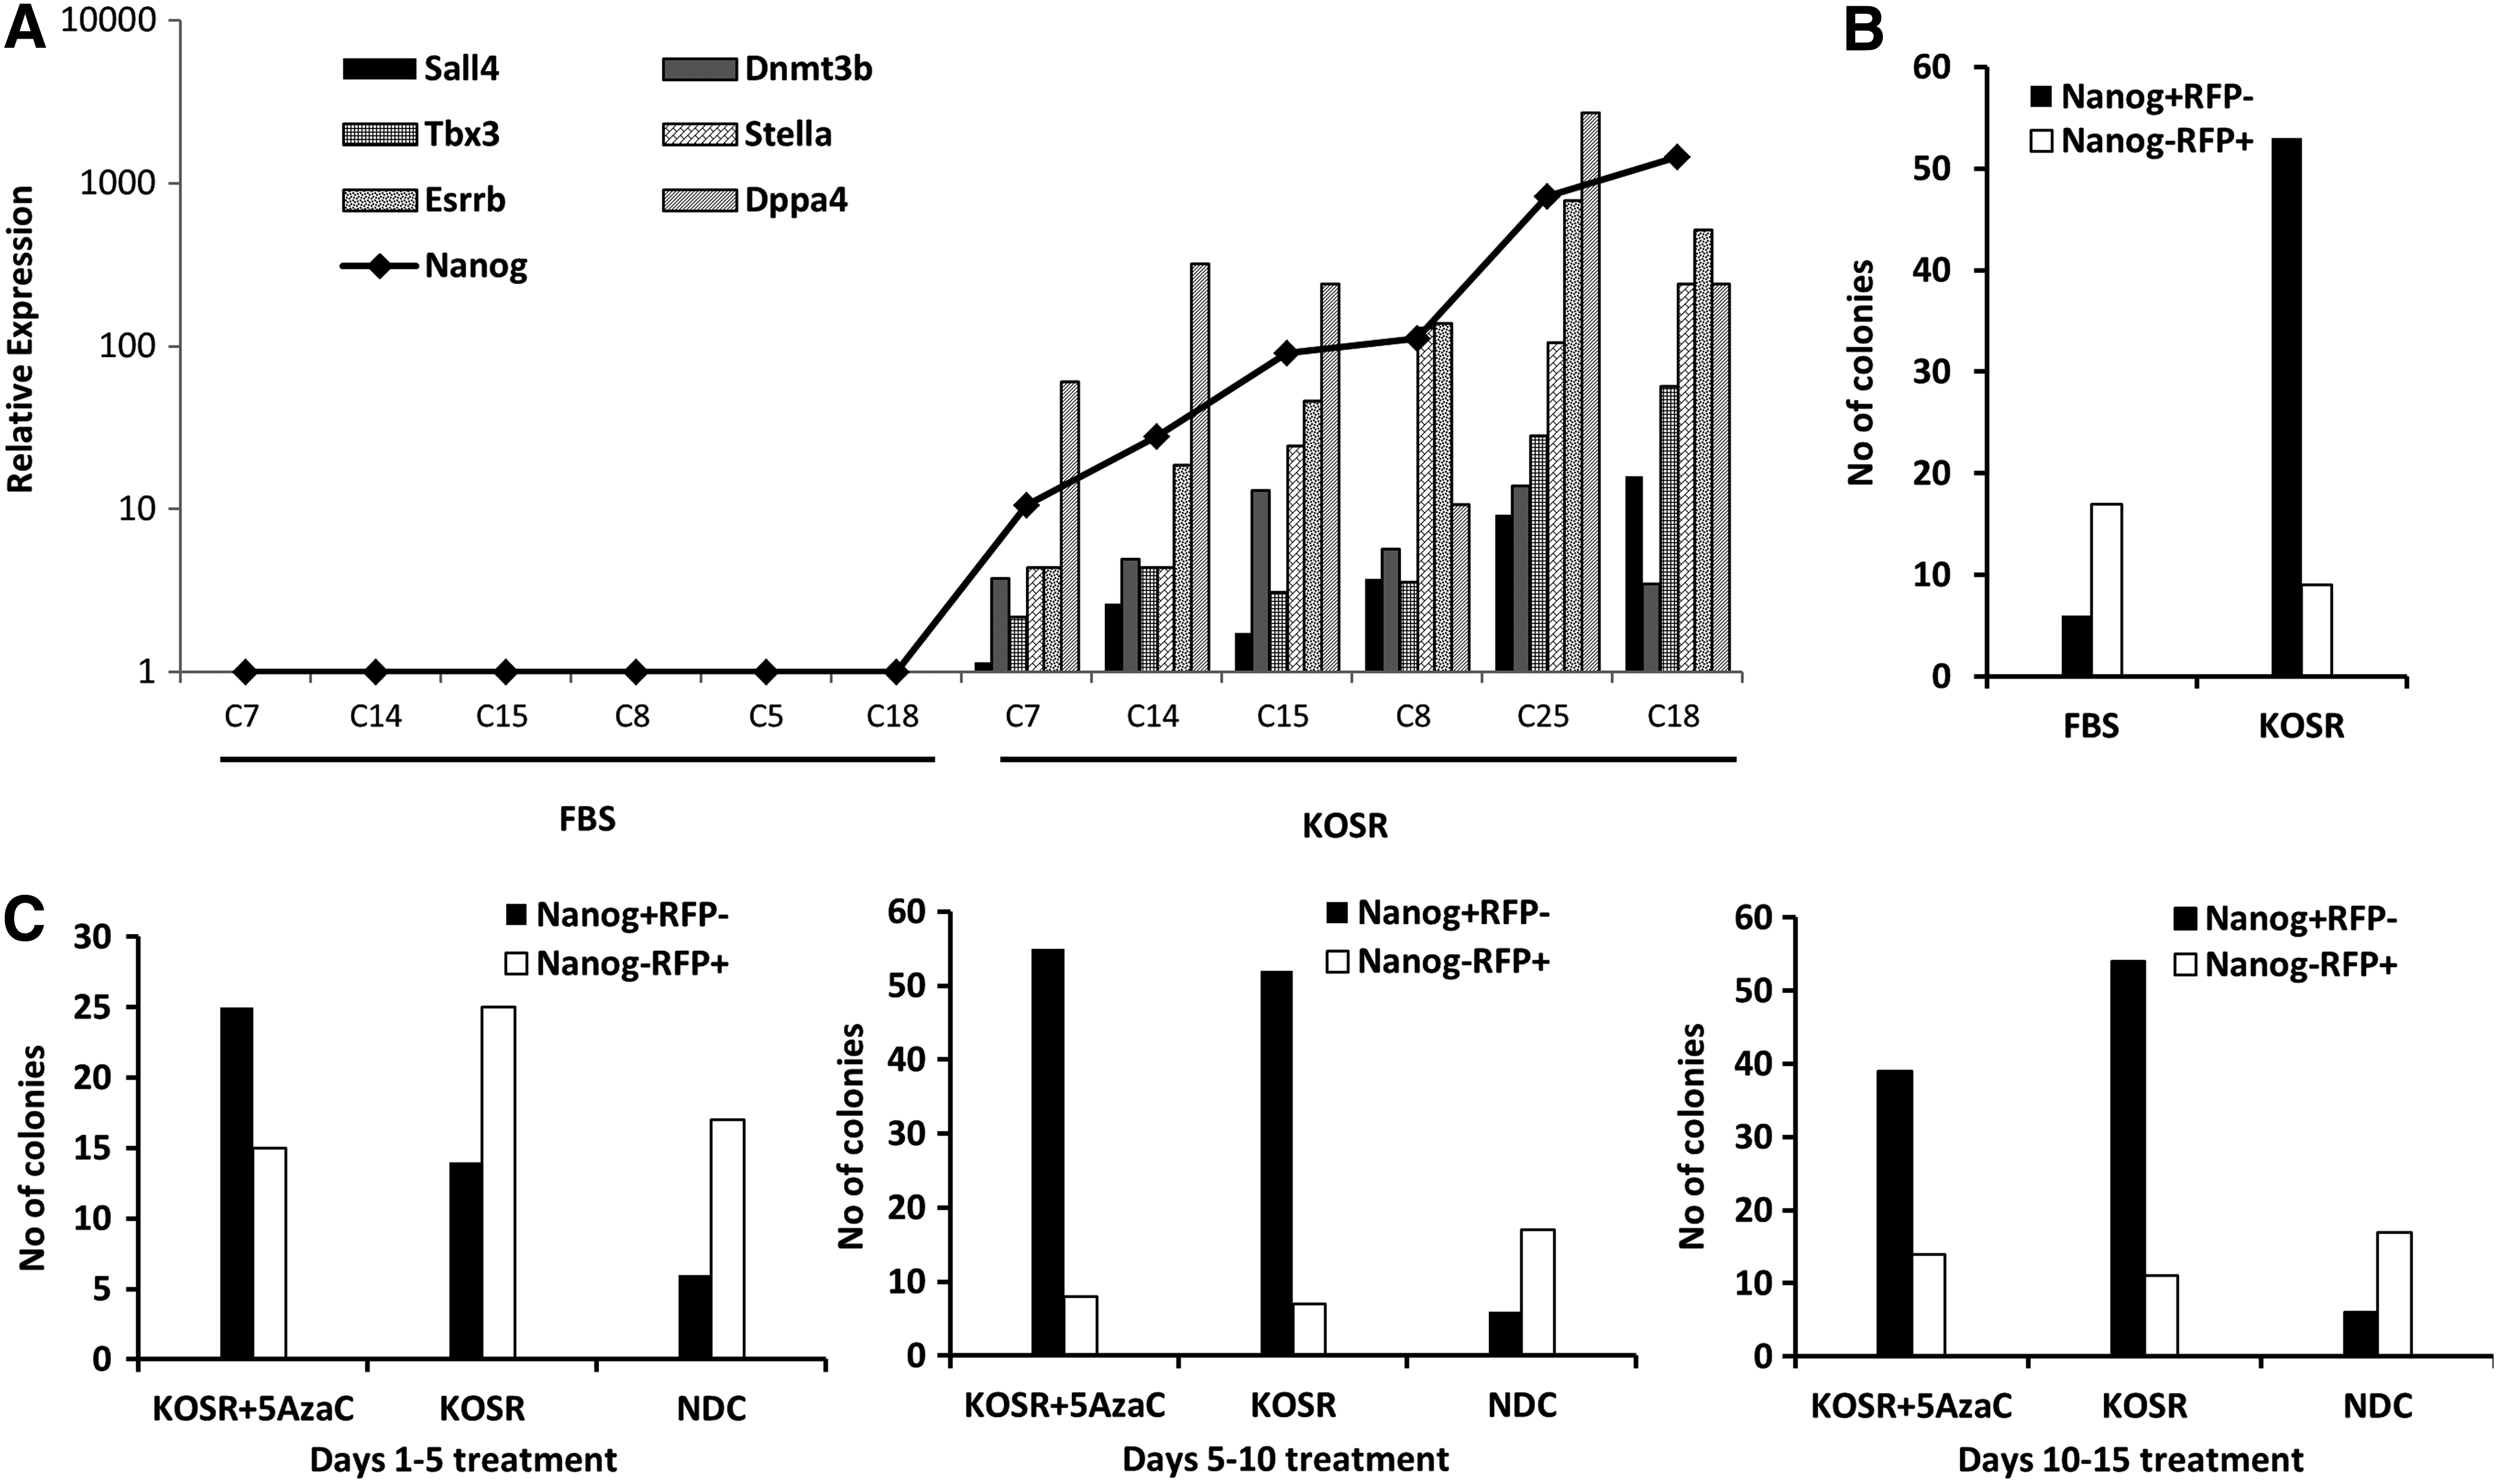
Efficient conversion of pre-iPSC to iPSC state in KOSR conditions. (
To understand the effect of KOSR in reprogramming of somatic cells, retrovirally transduced MEFs were cultured in the presence of KOSR-miPSC medium. We performed immunofluorescence for NANOG expression in the emerging clones, and the colony enumeration was performed on day 15 by scoring the number of NANOG+RV-RFP− colonies versus NANOG−RV-RFP+ colonies. KOSR-supplemented medium showed a robust increase (up to 10-fold) in the number of NANOG+RV-RFP− colonies than FBS-supplemented medium (Fig. 4B). In our experiments using retroviral vectors for reprogramming, we observed rapidly proliferating fuzzy RV-RFP+ cells, which float in the culture medium and make the culture difficult to maintain during reprogramming. We sought to test the effect of KOSR during the course of reprogramming. We observed that the KOSR reduces these RV-RFP+ proliferating cells as it could do for the established type IIIC pre-iPSC clones. When reprogramming was performed in the presence of FBS-miPSC medium, the proliferating cells emerged on day 6 after OSKM transduction and they existed till the end of the culture.
Although 5-AzaC also could prevent proliferating non-iPSCs from the established type III clones, the FBS-miPSC medium supplemented with 5-AzaC could not prevent the proliferating cells generated during reprogramming. Vc, which has been reported as an efficient molecule for generation of miPSCs (Esteban et al., 2010), also could not prevent these proliferating cells (data not shown). To study the effect of KOSR in different stages of reprogramming, we used KOSR-supplemented medium from days 1 to 5, 5 to 10 and 10 to 15 during reprogramming and showed that it is effective in increasing the efficiency in all the stages of reprogramming (Fig. 4C).
Differential expression of mesenchymal and epithelial genes in mouse pre-iPSCs
In the initial stages of reprogramming, cells go through MET in which mesenchymal genes (N-Cadherin, Snail, and CD44) are downregulated and epithelial genes (E-Cadherin) are upregulated (Chen et al., 2010; Li et al., 2010; O'Malley et al., 2013; Samavarchi-Tehrani et al., 2010). Because of the morphology and the expression of SSEA1, AP, and endogenous Oct4, it could be assumed that our pre-iPSCs (type III clones) would have crossed MET and reached close to the pluripotent state. To understand the extent of MET in the type III clones, we analyzed the expression of mesenchymal and epithelial genes in flow-sorted RV-RFP+ type III cells without the contamination of feeder cells (Fig. S4A). Of the 12 clones that we analyzed, four had E-Cadherin expression levels similar to those of miPSCs and mESC and the remaining clones (n = 8) had ∼10-fold lesser expression compared to iPSCs and mESCs (Fig. 5B). Additionally, immunofluorescence (Fig. 5C) and western blotting (Fig. 5D) also confirmed a differential expression of E-Cadherin within the pre-iPSC clones, although they have a close morphological resemblance to iPSCs and ESCs.
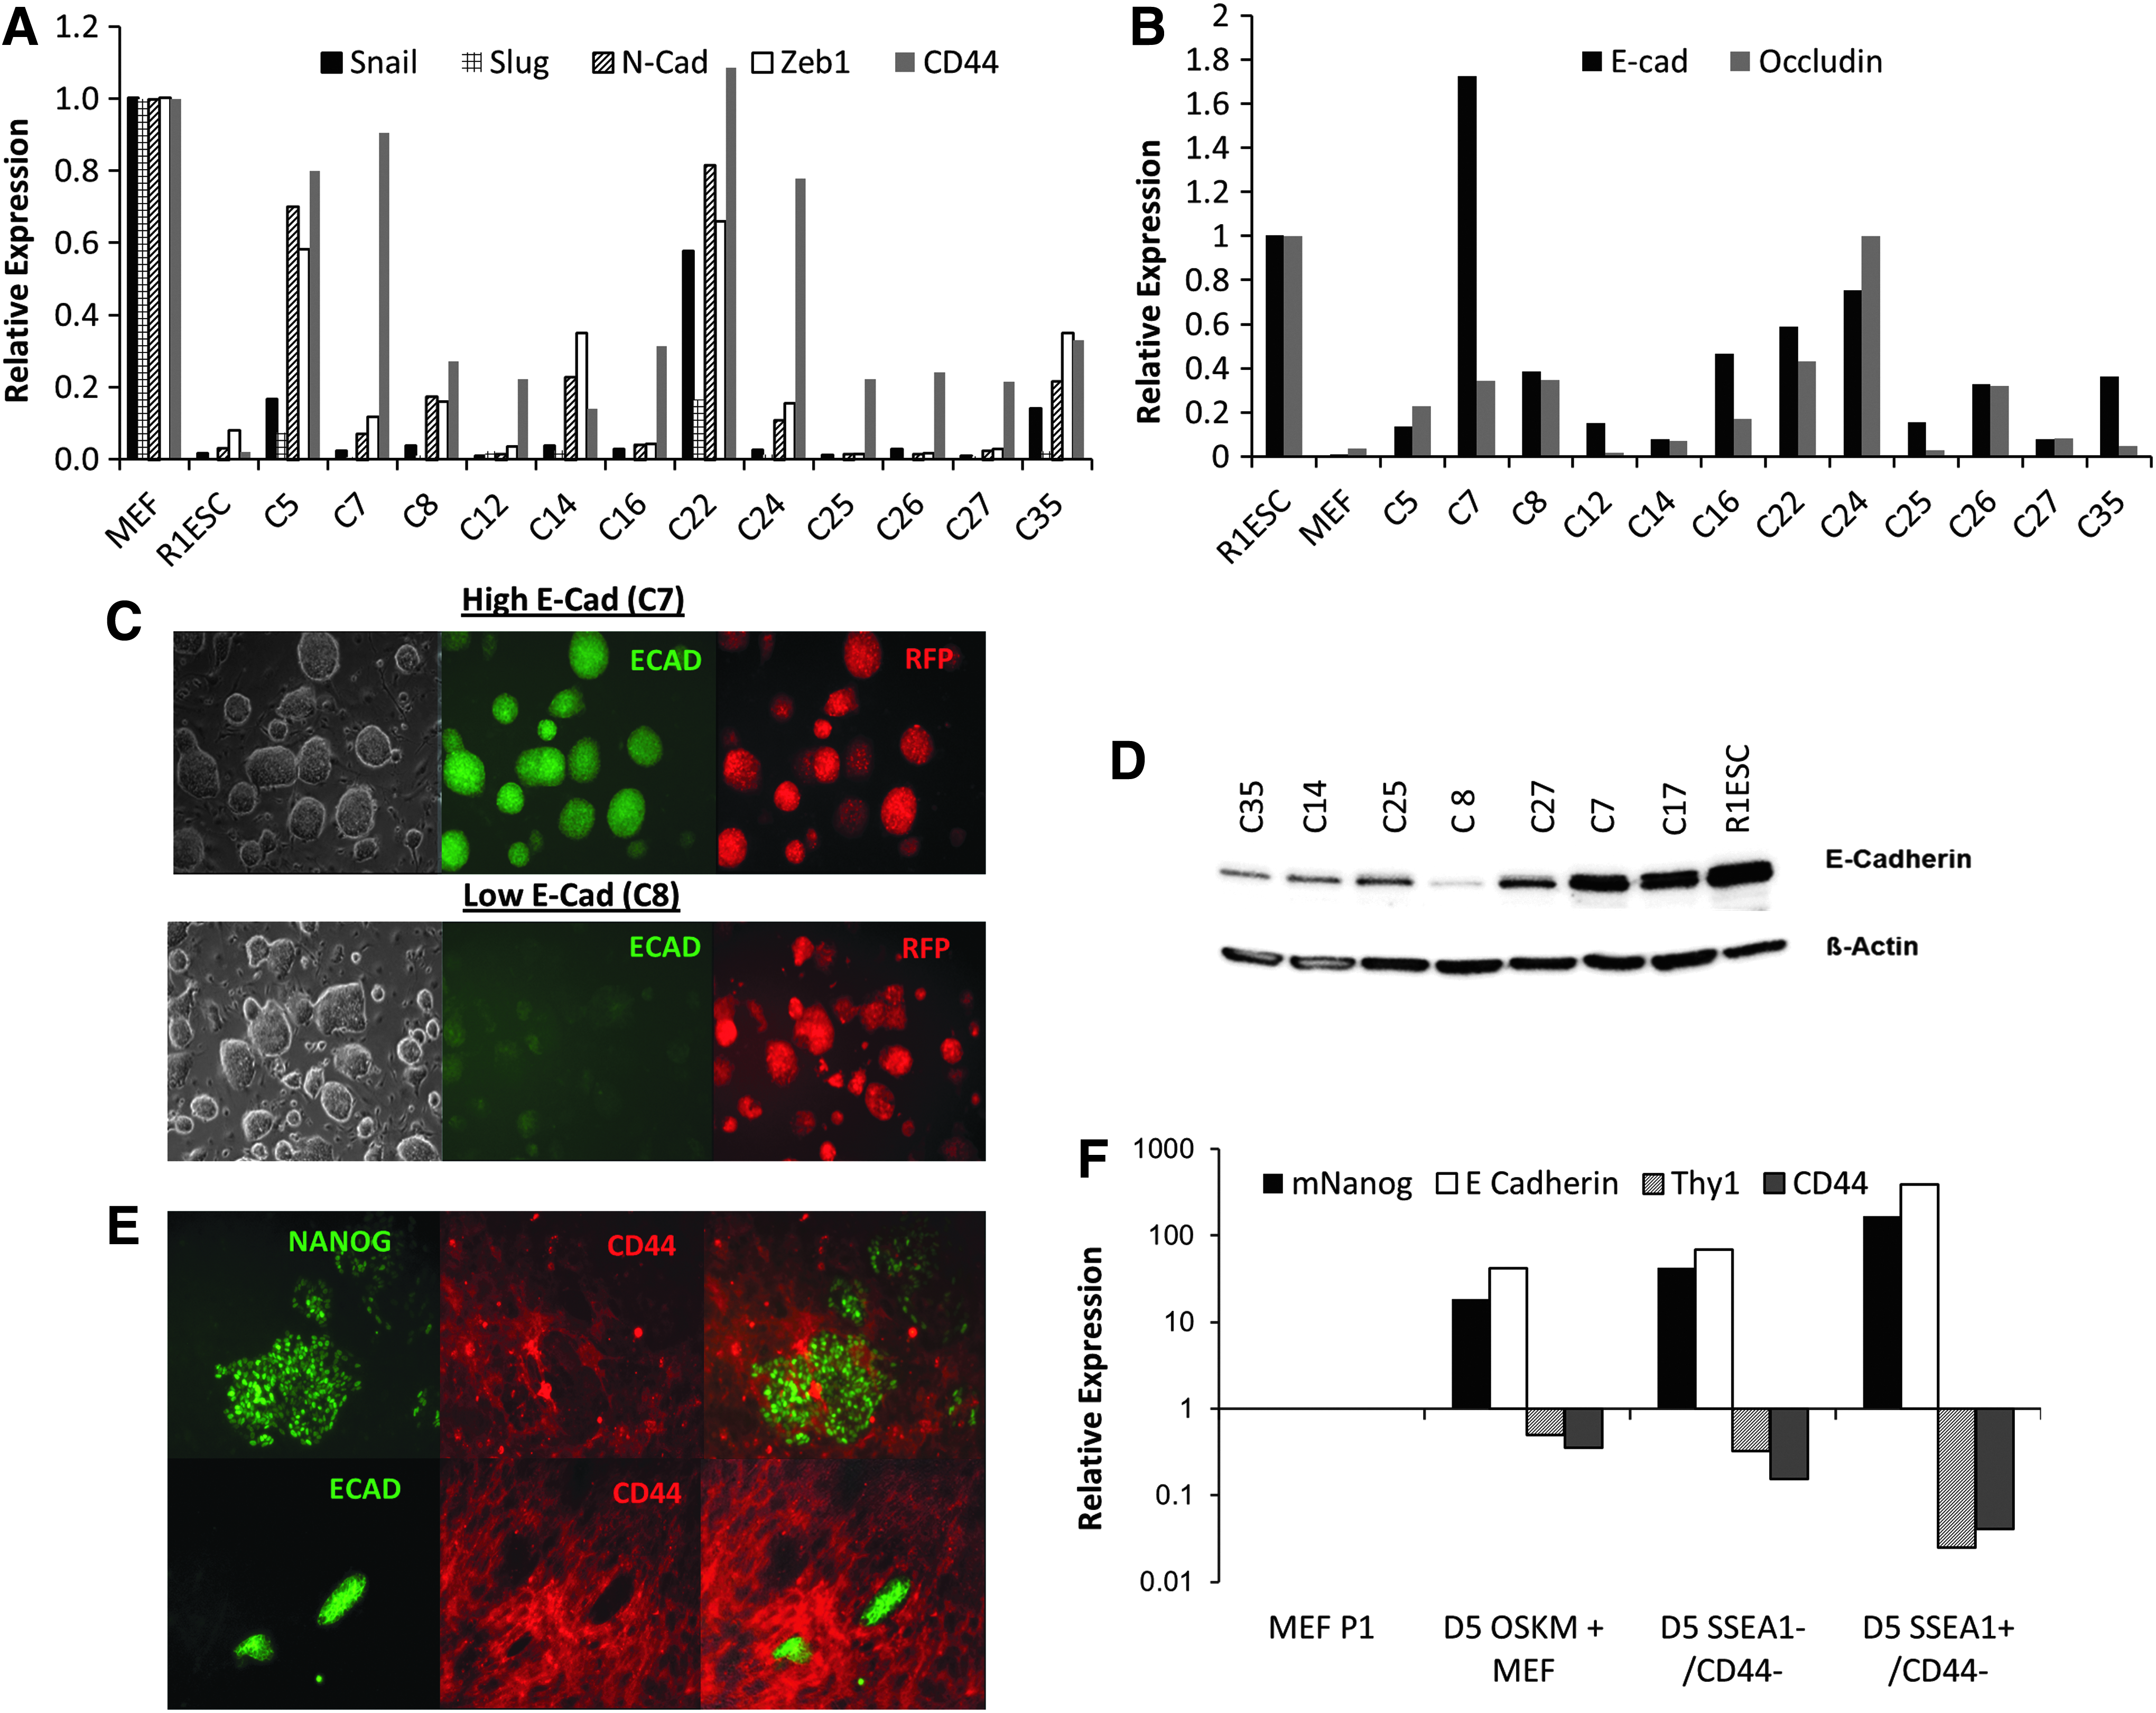
Expression of mesenchymal and epithelial genes in type III clones. (
The clones with reduced E-Cadherin expression also showed high CD44 expression (Fig. 5A, B), suggesting that a significant number of the pre-iPSCs do not complete MET, although they express SSEA1, AP, and endogenous Oct4. Further analysis of other mesenchymal genes, Snail, Slug, N-Cadherin, and Zeb1, showed differential expression of these genes in the pre-iPSCs (Fig. 5A). These data suggest that the pre-iPSCs have variable levels of MET and, unlike the previous reports (Chen et al., 2013), they do not belong to a homogeneous type of partially reprogrammed cells. We analyzed two pre-iPSCs with low E-Cadherin levels (C8 and C35) after treating them with small molecules and KOSR (Fig. S4B). KOSR treatment could increase E-Cadherin levels by approximtely five-fold in both clones. However, clone C8, but not C35, showed an increase in E-Cadherin expression levels by three- to eight-fold in the presence of the small molecules.
CD44 is expressed by the cells of mesenchymal and epithelial origin. MEFs express high levels of CD44 and it is down-regulated during the reprogramming process (O'Malley et al., 2013; Quintanilla et al., 2014). CD44 expression was found to be decreased significantly 5 days after the transduction of OSKM, and the cells that expressed E-Cadherin and Nanog did not show any CD44 expression, confirming the correlation between CD44 downregulation and pluripotency (Fig. 5E). SSEA1+CD44− cells isolated by fluorescence-activated cell sorting (FACS) on day 5 during the course of reprogramming showed high levels of Nanog and E-Cadherin and a significant downregulation of the fibroblast marker Thy1 compared to the SSEA1−CD44− fraction (Fig. 5F). The analysis in pre-iPSCs and iPSCs showed that CD44 expression was higher in pre-iPSCs than the fully reprogrammed NANOG + clones (Fig. 5A). Compared to the small molecules that we tested, KOSR greatly facilitated the downregulation of CD44 expression in all pre-iPSC clones that were tested (Fig. S5). Our results showed that CD44 is a useful marker to identify and differentiate the established pre-iPSC and fully reprogrammed iPSC lines. Taken together, these data show that pre-iPSCs not only failed to evoke the induction of late-stage markers of pluripotency but also failed to silence the expression of mesenchymal markers epigenetically. This differential expression of CD44 during the course of reprogramming can be employed to track the cells undergoing successful reprogramming.
Human iPSC clones isolated on the basis of morphology do not show significant heterogeneity in their expression of pluripotency genes
Heterogeneity with respect to the morphology and the expression levels of pluripotency genes has been reported in the clones generated in human somatic cell reprogramming (Chan et al., 2009). The true hiPSCs resemble hESCs in morphology, having flat colonies with defined boundaries and consisting of compactly packed cells with a high nucleus-to-cytoplasmic ratio (Fig. 6A). In our initial experiments, we reprogrammed RV-RFP–labeled human adult dermal fibroblasts with retroviruses to express OSKM. Several flat colonies with hESC morphology started emerging from day 20, dislodging feeder cells around them radially and thereby attaining an almost symmetrical shape with defined boundaries (Fig. 6A, B). All of these colonies showed RV-Tg silencing (RV-RFP−) (Fig. 6B).

Homogeneity in expression of pluripotency markers and RV-Tg silencing in human iPSC clones isolated on the basis of morphology. (
In our subsequent experiments, we generated hiPSCs without the use of RV-RFP, and the colonies were picked on the basis of morphology alone. Altogether the 10 established clones isolated on the basis of morphology showed expression of all pluripotency markers in long-term culture (Fig. 6C, D). These clones also could be efficiently differentiated in vivo (Fig. 6E). Our data show that although significant morphological and molecular heterogeneity has been reported for hiPSC colonies, unlike miPSC clones, the true hiPSC colonies have a distinct hESC morphology different from non-hiPSC colonies that facilitates their isolation. Morphology can serve as one of the best criteria for identification of bona fide human iPSC colonies.
Discussion
Reprogramming of somatic cells to pluripotency is a slow and stochastic process that proceeds through distinct phases; therefore, at a given time point the emerging colonies are heterogeneous in that they show variable levels of pluripotency (Hanna et al., 2009; MacArthur et al., 2008; Yamanaka, 2009). Authentic iPSC clones are usually identified from such heterogeneous cultures using either reporter constructs or selectable markers knocked into endogenous pluripotency gene promoters that are activated in fully reprogrammed iPSC clones. Retroviral transgene silencing is a hallmark property of fully reprogrammed iPSCs, and it indicates the activation of an endogenous pluripotency network that can sustain the pluripotent state of derived iPSC clones (Blelloch et al., 2007; Hotta and Ellis, 2008; Maherali and Hochedlinger, 2008; Maherali et al., 2007; Wernig et al., 2008; Wernig et al., 2007).
Using the dual selection strategy that relied on the expression of the late maturation phase marker, Nanog, and silencing of the retroviral reporter, mRFP, we classified miPSC clones into three major types. We demonstrated that that pluripotent NANOG+RFP− (type I) clones represent a relatively small percentage of the isolated clones. The rare NANOG+RFP+ (type II) clones represent unique transitional intermediates, which on extended passaging yield RFP− ESC-like colonies. We found that the vast majority of morphologically identical clones were Nanog− RFP+ (type III clones) that demonstrated characteristics similar to previously reported pre-iPSCs. These transitional intermediates are an invaluable resource for understanding the molecular events that occur downstream of Nanog expression, leading to the establishment of transgene independence and pluripotency.
Our extensive analysis of pre-iPSCs showed that, unlike previous reports (Chen et al., 2013; Esteban et al., 2010; Theunissen et al., 2011), they exhibit significant morphological and molecular heterogeneity. Morphological differences and variable expression of epithelial and mesenchymal genes and variable response to culture conditions among these clones suggest that these clones have different epigenetic landscapes due to divergent routes taken by the exogenous factor–expressing cells during reprogramming and have variable stoichiometric levels of exogenous reprogramming factors.
Interestingly, irrespective of the subtype, the type III clones had activated expression of the endogenous Oct4 gene, but still failed to induce Nanog expression, which is suggestive of an OCT4+NANOG−RV-Tg+ to OCT4+NANOG+RV-Tg− barrier for pluripotency that exists in these cells. Previous studies failed to report this molecular signature of pre-iPSCs due to the difference in assays that were used for defining iPSCs and pre-iPSCs. Our results clearly show that the calculation of efficiency on the basis of the expression of transgenic Oct4-GFP expression (Chen et al., 2013; Esteban et al., 2010; Meissner et al., 2007; Wernig et al., 2007) could be misleading because endogenous Oct4 expression can occur without achieving the pluripotent state in pre-iPSCs. The difference in E-Cadherin levels in the pre-iPSC clones suggests that these clones are generated through multiple routes in reprogramming.
Although it has been reported earlier that almost all the pre-iPSC clones can be converted to iPSCs after treating them with various small molecules that modulate signaling and epigenetic pathways, our experiments showed that these clones showed heterogeneity in their response to small molecule modulators. Interestingly, multiple small molecules that regulate different epigenetic modifications were able to convert same pre-iPSC clones to a pluripotent state. Vitamin C, which was reported earlier to have the ability to convert almost all the pre-iPSCs to iPSCs on the basis of Oct4-GFP expression (Chen et al., 2013; Wang et al., 2011), was found to show very low efficiency of conversion when the efficiency was calculated on the basis of NANOG expression and RV-Tg silencing in our experiments. We found that KOSR was the most efficient culture ingredient for the conversion of pre-iPSCs to iPSCs and also for generation of iPSCs from somatic cells. KOSR-derived clones activated all of the pluripotent genes, including those that are downstream of Nanog expression, compared to FBS-derived clones. Our findings were further substantiated by the observation that KOSR treatment could effectively promote reprogramming at all stages of reprogramming, possibly by overcoming epigenetic barriers that limit the conversion efficiency.
The rapidly proliferating round cells generated during reprogramming and from type IIIC clones were morphologically very similar to recently reported “Fuzzy” cells (F-cells) (Tonge et al., 2014). But, unlike F-cells, they lacked Nanog expression and other pluripotency characteristics, although they maintained the high levels of exogenous factor expression. These observations indicate that the type IIIC clones are molecularly and epigenetically distinct from F-cells. Culture conditions, including KOSR, VPA, and 5-AzaC, could prevent the growth of these proliferating suspension cells in type IIIC clones, whereas NaBu, TSA, and Vc could not, suggesting specific molecular mechanisms responsible for the generation of these proliferating cells in type III clones that could be inhibited by at least two different epigenetic mechanisms. It is clear that KOSR treatment has broad-spectrum effects on the epigenome of reprogramming cells and pre-iPSCs for their transition to the pluripotent state.
While significant molecular heterogeneity was observed in miPSCs isolated on the basis of morphology, hiPSCs isolated on the basis of their characteristic morphology showed homogeneity in their pluripotency levels. Although several non-hiPSC cell clusters are generated during reprogramming, they have a distinctly different morphology compared to hiPSC clones, and it is not yet known whether stable human pre-iPSCs can be generated.
To conclude, our study shows that reprogramming generates a significant number of nonpluripotent cells that can be converted effectively to a pluripotent state with modified culture conditions. The partially reprogrammed pre-iPSC clones reach a nearly pluripotent state through multiple routes, and some clones do not undergo MET completely. Nonetheless, due to their characteristic molecular properties, mouse pre-iPSCs are still useful tools for understanding the molecular events in the late stages of reprogramming.
Footnotes
Acknowledgments
This study is supported by funding to S.R.V. from the Department of Biotechnology, Government of India. K.V.M. is supported by UGC and S.P.B. by CSIR fellowships. We thank Dhavapriya Palani for the technical help in iPSC experiments; Pratheesh Mankuzhy, Pavithra and Sathish for animal experiments; and Vaithyanathan, Saranya, and Samrajyam Nara for flow cytometry.
Author Disclosure Statement
The authors declare that no conflicting financial interests exist. K.V.M., S.M.A., and S.P.B. performed the experiments, analyzed the data, and wrote the manuscript. A.S. was involved in the design and manuscript preparation. The study was conceptualized and designed by S.R.V. All the experiments involving animal and human subjects were approved by Institutional Review Board (IRB) and Institutional Animal Ethics Committee (IAEC) of Christian Medical College, Vellore, India.
References
Supplementary Material
Please find the following supplemental material available below.
For Open Access articles published under a Creative Commons License, all supplemental material carries the same license as the article it is associated with.
For non-Open Access articles published, all supplemental material carries a non-exclusive license, and permission requests for re-use of supplemental material or any part of supplemental material shall be sent directly to the copyright owner as specified in the copyright notice associated with the article.
