
Abstract
Abstract
The ability to culture neurons from horses may allow further investigation into equine neurological disorders. In this study, we demonstrate the generation of induced neuronal cells from equine adipose-derived stem cells (EADSCs) using a combination of lentiviral vector expression of the neuronal transcription factors Brn2, Ascl1, Myt1l (BAM) and NeuroD1 and a defined chemical induction medium, with βIII-tubulin–positive induced neuronal cells displaying a distinct neuronal morphology of rounded and compact cell bodies, extensive neurite outgrowth, and branching of processes. Furthermore, we investigated the effects of dimensionality on neuronal transdifferentiation, comparing conventional two-dimensional (2D) monolayer culture against three-dimensional (3D) culture on a porous polystyrene scaffold. Neuronal transdifferentiation was enhanced in 3D culture, with evenly distributed cells located on the surface and throughout the scaffold. Transdifferentiation efficiency was increased in 3D culture, with an increase in mean percent conversion of more than 100% compared to 2D culture. Additionally, induced neuronal cells were shown to transit through a Nestin-positive precursor state, with MAP2 and Synapsin 2 expression significantly increased in 3D culture. These findings will help to increase our understanding of equine neuropathogenesis, with prospective roles in disease modeling, drug screening, and cellular replacement for treatment of equine neurological disorders.
Introduction
O
The generation of neural cells from embryonic stem cells (ESCs) (Daadi et al., 2009; Rodríguez-Gómez et al., 2007) and induced pluripotent stem cells (iPSCs) (Doi et al., 2014; Yahata et al., 2011) has been well documented; however, despite their clinical potential, their use is not without issues, including potential tumorigenicity, host rejection, and inefficient and lengthy reprogramming procedures (Rippon and Bishop, 2004; Sun et al., 2010). The discovery of transdifferentiation, in which cells of one lineage are directly converted into another without first inducing pluripotency (Graf, 2011), may avoid many of these issues. Neuronal transdifferentiation was first demonstrated by Vierbuchen et al. (2010), who determined that forced expression of the neuronal transcription factors Brn2, Ascl1, and Myt1l (BAM) could rapidly and efficiently convert fibroblasts into neuron-like cells (termed induced neuronal cells). Subsequent studies expanded on this work, demonstrating the generation of induced neuronal cells using variations of BAM (Kim, 2011), additional transcription factors (Pang et al., 2011), small-molecule inhibitors (Ladewig et al., 2012), and microRNAs (Yoo et al., 2011). Induced neuronal cells were also shown to be functional electrophysiologically (Ambasudhan et al., 2011; Vierbuchen et al., 2010), with examples of functional integration following transplantation into murine models (Kim et al., 2011).
In addition to fibroblasts, mesenchymal stem cells (MSCs) may provide a potential source of cells for neuronal transdifferentiation. During in vitro culture, bone marrow–derived MSCs have been shown to adopt a neural phenotype following a variety of chemical treatments (Sanchez-Ramos et al., 2000; Tropel et al., 2006; Woodbury et al., 2000), with spontaneous expression of neural markers in the absence of transdifferentiation, suggesting a predisposition to become neural tissue (Foudah et al., 2012). As a result of this, investigations have expanded into transdifferentiation of adipose-derived stem cells, with numerous groups demonstrating a similar neural transdifferentiation potential following chemical induction (Ashjian et al., 2003; Jang et al., 2010; Krampera et al., 2007; Safford et al., 2002; Zuk et al., 2002).
Three-dimensional (3D) culture allows for the study of cell growth, proliferation, and differentiation under conditions that emulate the in vivo environment, as well as facilitating cell–cell and cell–extracellular matrix interactions that are otherwise constrained during standard two-dimensional (2D) culture. The study of cells of the central nervous system in particular can be limited by 2D culture, which may not allow for the extensive growth of neuronal processes over great distances or provide the scaffolding required to both sustain high cell densities and promote cell interactions necessary for normal neural function (Edelman and Keefer, 2005). As such, 3D culture has been suggested. Previous studies have revealed considerable advantages to culturing neural cell types in 3D, as demonstrated by the growth and differentiation of neural stem cells within collagen gels (Ma et al., 2004) and Alvetex® scaffolds (Stevanato and Sinden, 2014).
In this study, we demonstrate the generation of induced neuronal cells from equine adipose-derived stem cells (EADSCs), using a combination of forced expression of neuronal transcription factors and a defined chemical induction medium. Furthermore, we investigate the effects of dimensionality on neuronal transdifferentiation, comparing conventional 2D monolayer culture against 3D culture on a porous polystyrene scaffold.
Materials and Methods
All chemicals were sourced from Sigma-Aldrich (St. Louis, MO, USA), unless otherwise stated.
Cell culture
Adipose-derived stem cells were isolated from equine subcutaneous adipose tissue as previously described (Petersen et al., 2014). All sampling was carried out using protocols approved by the Charles Sturt University Animal Care and Ethics Committee. Isolated EADSCs and cells of the human embryonic kidney 293T cell line (American Type Culture Collection [ATCC], Manassas, VA, USA) were cultured in Dulbecco's Modified Eagle's Medium supplemented with 10% fetal bovine serum (FBS; Bovogen, East Keilor, Victoria, Australia), 100 U/mL penicillin, 100 μg/mL streptomycin, and 2 mM
Lentiviral vector production
Lentiviral vectors expressing the neuronal transcription factors BAM and NeuroD1 and the doxycycline-controlled transactivator M2rtTA were produced using a four-plasmid transfection system in 293T packaging cells. Briefly, 60-mm dishes were coated with 0.001%
Neuronal transdifferentiation
EADSCs were seeded in 35-mm dishes at a density of 2.5 × 10⁵ cells/well at 24 h prior to transduction. On the day of transduction, lentiviral vector stock was thawed at 37°C, and 250 μL of each lentiviral vector in 1 mL of DMEM was added to each dish, prior to incubation for 24 h. Lentiviral vector transduction was repeated, prior to incubation for a further 48 h.
For 2D culture, 12-mm round glass coverslips were sterilized in 70% ethanol, washed in PBS, and allowed to air dry. Nontransduced control and transduced cells were seeded onto coverslips in 24-well plates at a density of 1.0 × 10⁵ cells/well and incubated for 24 h. For 3D culture, 12-well Alvetex® scaffold discs (Reinnervate, Sedgefield, County Durham, United Kingdom) were prepared according to the manufacturer's protocol. Briefly, discs were washed with 70% ethanol to render them hydrophilic. All traces of ethanol were removed by washing twice with PBS. To prevent drying, discs were stored in PBS until required. Nontransduced control and transduced cells were resuspended in 100μL volumes at a density of 0.5 × 10⁶ and 1.0 × 10⁶ cells, respectively, and seeded directly onto the center of the discs in 12-well plates, prior to incubation at 37°C for 90 min to facilitate cell attachment. Following incubation, wells were filled with 2 mL of DMEM and incubated for 6 days, with medium changes every 2 days.
Nontransduced (noninduced) control cells were cultured in DMEM. Nontransduced control cells and transduced (induced) cells were cultured in DMEM supplemented with 25 μg/mL insulin from bovine pancreas, 50 μg/mL holo form bovine transferrin (Gibco, Carlsbad, CA, USA), 30 nM sodium selenite, 20 nM progesterone, 100 nM putrescine dihydrochloride, 10 ng/mL basic fibroblast growth factor (Peprotech, Rocky Hill, NJ, USA), and 2 μg/mL doxycycline hyclate, with medium changes every 3 days.
Immunocytochemistry
Samples were fixed with 4% paraformaldehyde and 4% sucrose for 20 min, treated with 50 mM ammonium chloride for 10 min to reduce background autofluorescence, and permeabilized with 0.1% Triton X-100 for 5 min. Nonspecific antibody binding was blocked by incubating samples in 5% FBS for 30 min. Rabbit monoclonal anti-βIII-tubulin primary antibody (Cell Signaling, Danvers, MA, USA) was diluted 1:200 and applied for 2 h. Goat anti-rabbit immunoglobulin G (IgG)-AlexaFluor 488 (Cell Signaling) secondary antibody was diluted 1:200 and applied for 1 h. Samples were counterstained with 0.153 ng/mL 4′,6-diamidino-2-phenylindole (DAPI) II (Abbott Molecular, Des Plaines, IL, USA) for 30 min. Samples in 2D culture were visualized using an Olympus BX61 upright microscope equipped with DAPI and fluorescein isothiocyanate (FITC) fluorescence filters. Samples in 3D culture were visualized using a Nikon Eclipse Ti-E A1 scanning confocal microscope with DAPI (450/50) and FITC (525/50) fluorescence filters.
Calculation of mean percent conversion
Induced neuronal cells were defined as βIII-tubulin–positive cells exhibiting thin processes extending from a circular cell body. Mean percent conversion was calculated on the basis of the average number of induced neuronal cells, divided by the average number of DAPI II–positive cells. Averages were calculated based on a minimum of five randomly selected fields of view at 20× magnification (2D culture) or 40× magnification (3D culture), with three replicates of each sample.
Reverse transcription quantitative polymerase chain reaction
RNA was extracted and purified using a Bioline ISOLATE II RNA Micro Kit (Bioline, Alexandria, New South Wales, Australia), according to the manufacturer's protocol. cDNA was synthesized from 500 ng of extracted RNA using an Applied Biosystems High-Capacity cDNA Reverse Transcription Kit (Life Technologies, Carlsbad, CA, USA), according to the manufacturer's protocol. Reverse transcription quantitative polymerase chain reaction (RT-qPCR) was performed in duplicates using SsoFast™ EvaGreen® Supermix (Bio-Rad, Hercules, CA, USA), 0.5 μL of synthesized cDNA, and equine-specific primers designed using National Center for Biotechnology Information (NCBI)/Primer-BLAST (Table 1). Amplification was carried out with an initial denaturation of 95°C for 180 sec, followed by 45 cycles of denaturation at 95°C for 10 sec, and annealing at 60°C for 30 sec, before extension at 95°C for 10 sec, and a final melt curve analysis. Gene expression was normalized to Beta-actin expression, and calculated using the ΔΔCq method.
F, forward; R, reverse.
Statistical analysis
Mean percent conversion data are expressed as mean ± standard deviation (SD) of triplicates. Statistical analysis was performed using an unpaired t-test with Welch's correction and a two-tailed p value. RT-qPCR data are expressed as mean ± standard error of the mean (SEM) of triplicates. Statistical analysis was performed using ordinary one-way analysis of variance (ANOVA), with corrections for multiple comparisons (Tukey's test). Statistical significance was set at p < 0.05. All analyses were performed with GraphPad Prism version 6 (GraphPad Software, Inc., La Jolla, CA, USA).
Results
Generation of induced neuronal cells from EADSCs
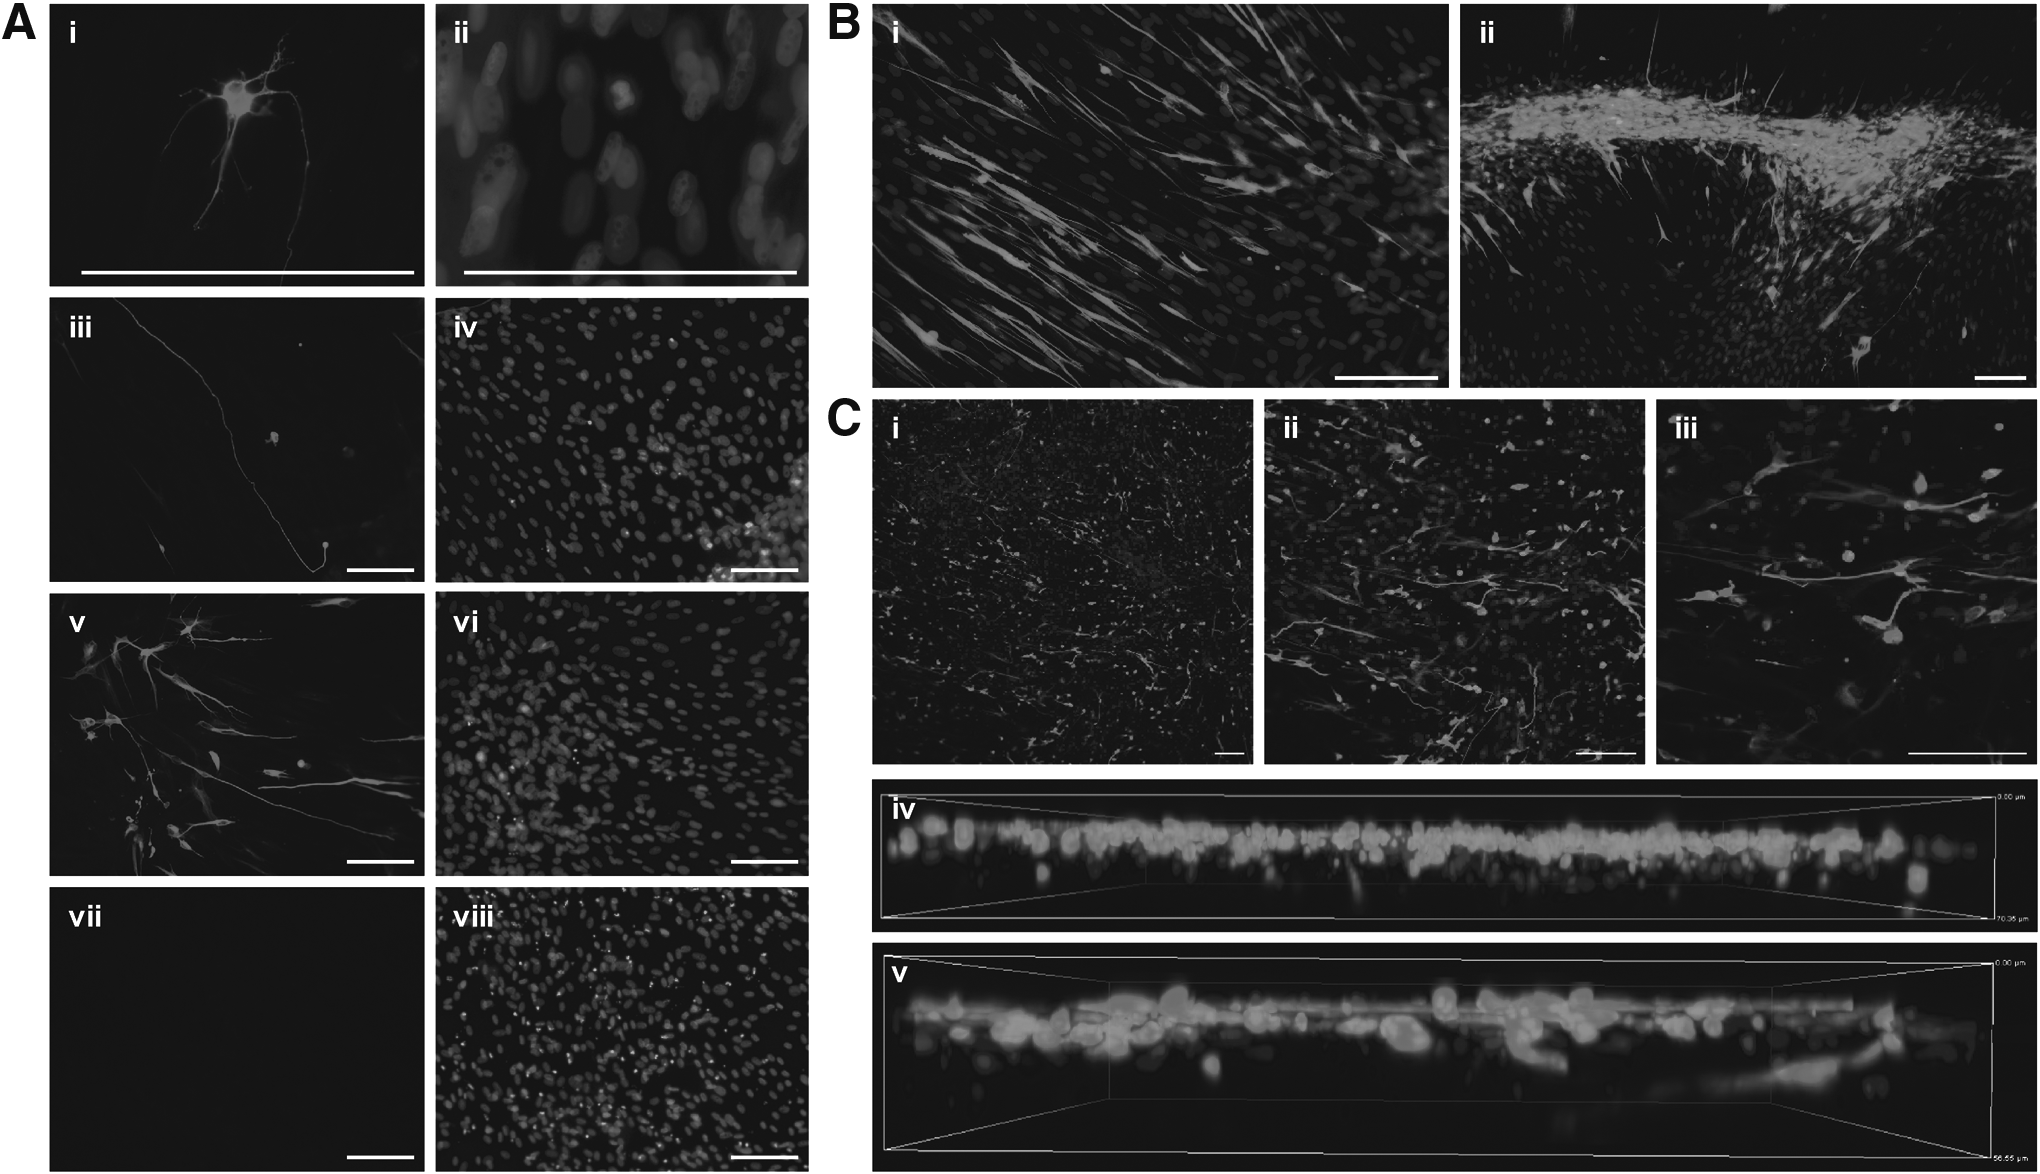
Following immunocytochemistry with a neuron-specific βIII-tubulin antibody, EADSCs transduced with lentiviral vectors expressing the neuronal transcription factors BAM and NeuroD1 that were incubated in neuronal induction medium for 3 weeks were shown to have transdifferentiated into induced neuronal cells. βIII-tubulin–positive cells displayed a distinct neuronal morphology. Cell bodies were rounded and compact (Fig. 1Ai,ii), with extensive neurite outgrowth (Fig. 1Aiii,iv), and some branching of processes evident (Fig. 1Av,vi). Conversely, nontransduced control EADSCs incubated in neuronal induction medium for 3 weeks showed no evidence of βIII-tubulin staining (Fig. 1Avii,viii), indicating that chemical induction alone is insufficient to convert EADSCs into induced neuronal cells.
(
Morphology of induced neuronal cells in 2D and 3D culture
To determine differences in neuronal transdifferentiation between substrate culture conditions, samples in 2D and 3D culture simultaneously underwent neuronal transdifferentiation. The growth pattern of cells in 2D culture was quite varied. Some areas exhibited an even spread of cells, with induced neuronal cells extending across the surface in an ordered pattern and direction (Fig. 1Bi). Other areas showed evidence of severe cell clumping (Fig. 1Bii), and, as a result, individual induced neuronal cells were unable to be distinguished in these areas.
In 3D culture, the spread of induced neuronal cells was even (Fig. 1Ci), with no apparent clumping (Fig. 1Cii) as seen in 2D culture. Upon closer examination (Fig. 1Ciii), cells could be seen at multiple levels, not strictly in a monolayer. To further investigate, z-stacking was used to visualize the position of the cells. z-stacking confirmed that the majority of the cells were situated on the surface of the scaffold; however, there was evidence of cell migration through the scaffold, in some instances as far as 70 μm from the surface (Fig. 1Civ). In addition, induced neuronal cell neurites could be seen projecting through the depth of the scaffold (Fig. 1Cv).
Neuronal transdifferentiation conversion efficiency in 2D and 3D culture
For each sample, multiple photomicrographs were taken at random fields of view and counted to determine mean percent conversion efficiency (Fig. 2). The efficiency of neuronal transdifferentiation was significantly enhanced (p < 0.05) in 3D culture. Conversion efficiencies ranged from 6.29 ± 1.54% in 2D culture, up to 13.79 ± 0.35% in 3D culture, with an increase in mean percent conversion of more than 100% when EADSCs were transdifferentiated in 3D culture.
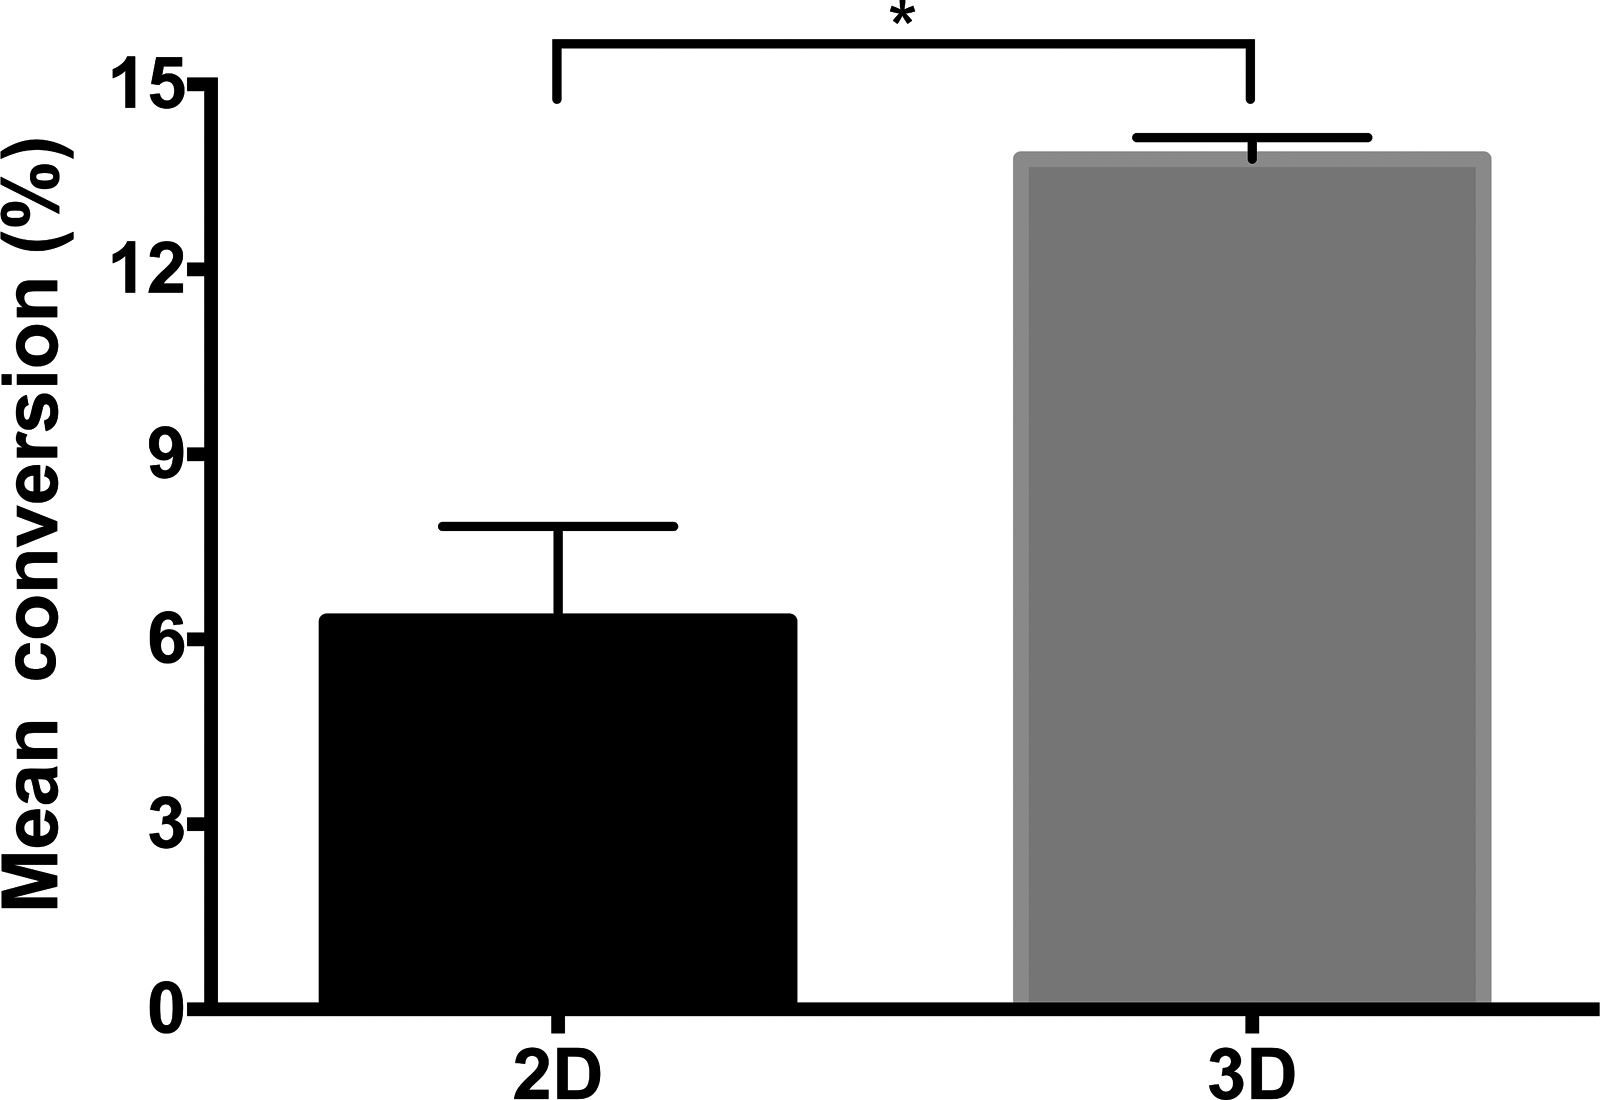
Mean percent conversion efficiency of neuronal transdifferentiation in 2D and 3D culture. The efficiency of neuronal transdifferentiation was significantly enhanced in 3D culture, with an increase in mean percent conversion of more than 100%. Data are shown as mean ± SD (n = 3). (*) p < 0.05.
Gene expression profile of induced neuronal cells in 2D and 3D culture
Following 3 weeks of culture, RT-qPCR was performed to quantify relative expression of the neural-specific markers MAP2, Nestin, and Synapsin 2 in EADSCs grown and transdifferentiated in 2D and 3D culture (Fig. 3). MAP2 and Synapsin 2 expression was statistically equivalent between noninduced control and transdifferentiated EADSCs in 2D culture; however, expression was significantly increased (MAP2, p < 0.0001; Synapsin 2, p < 0.05) in EADSCs transdifferentiated in 3D culture. Nestin expression was significantly increased (p < 0.0001) following transdifferentiation in both 2D and 3D culture, with no significant differences in Nestin expression between transdifferentiated EADSCs in 2D and 3D culture.
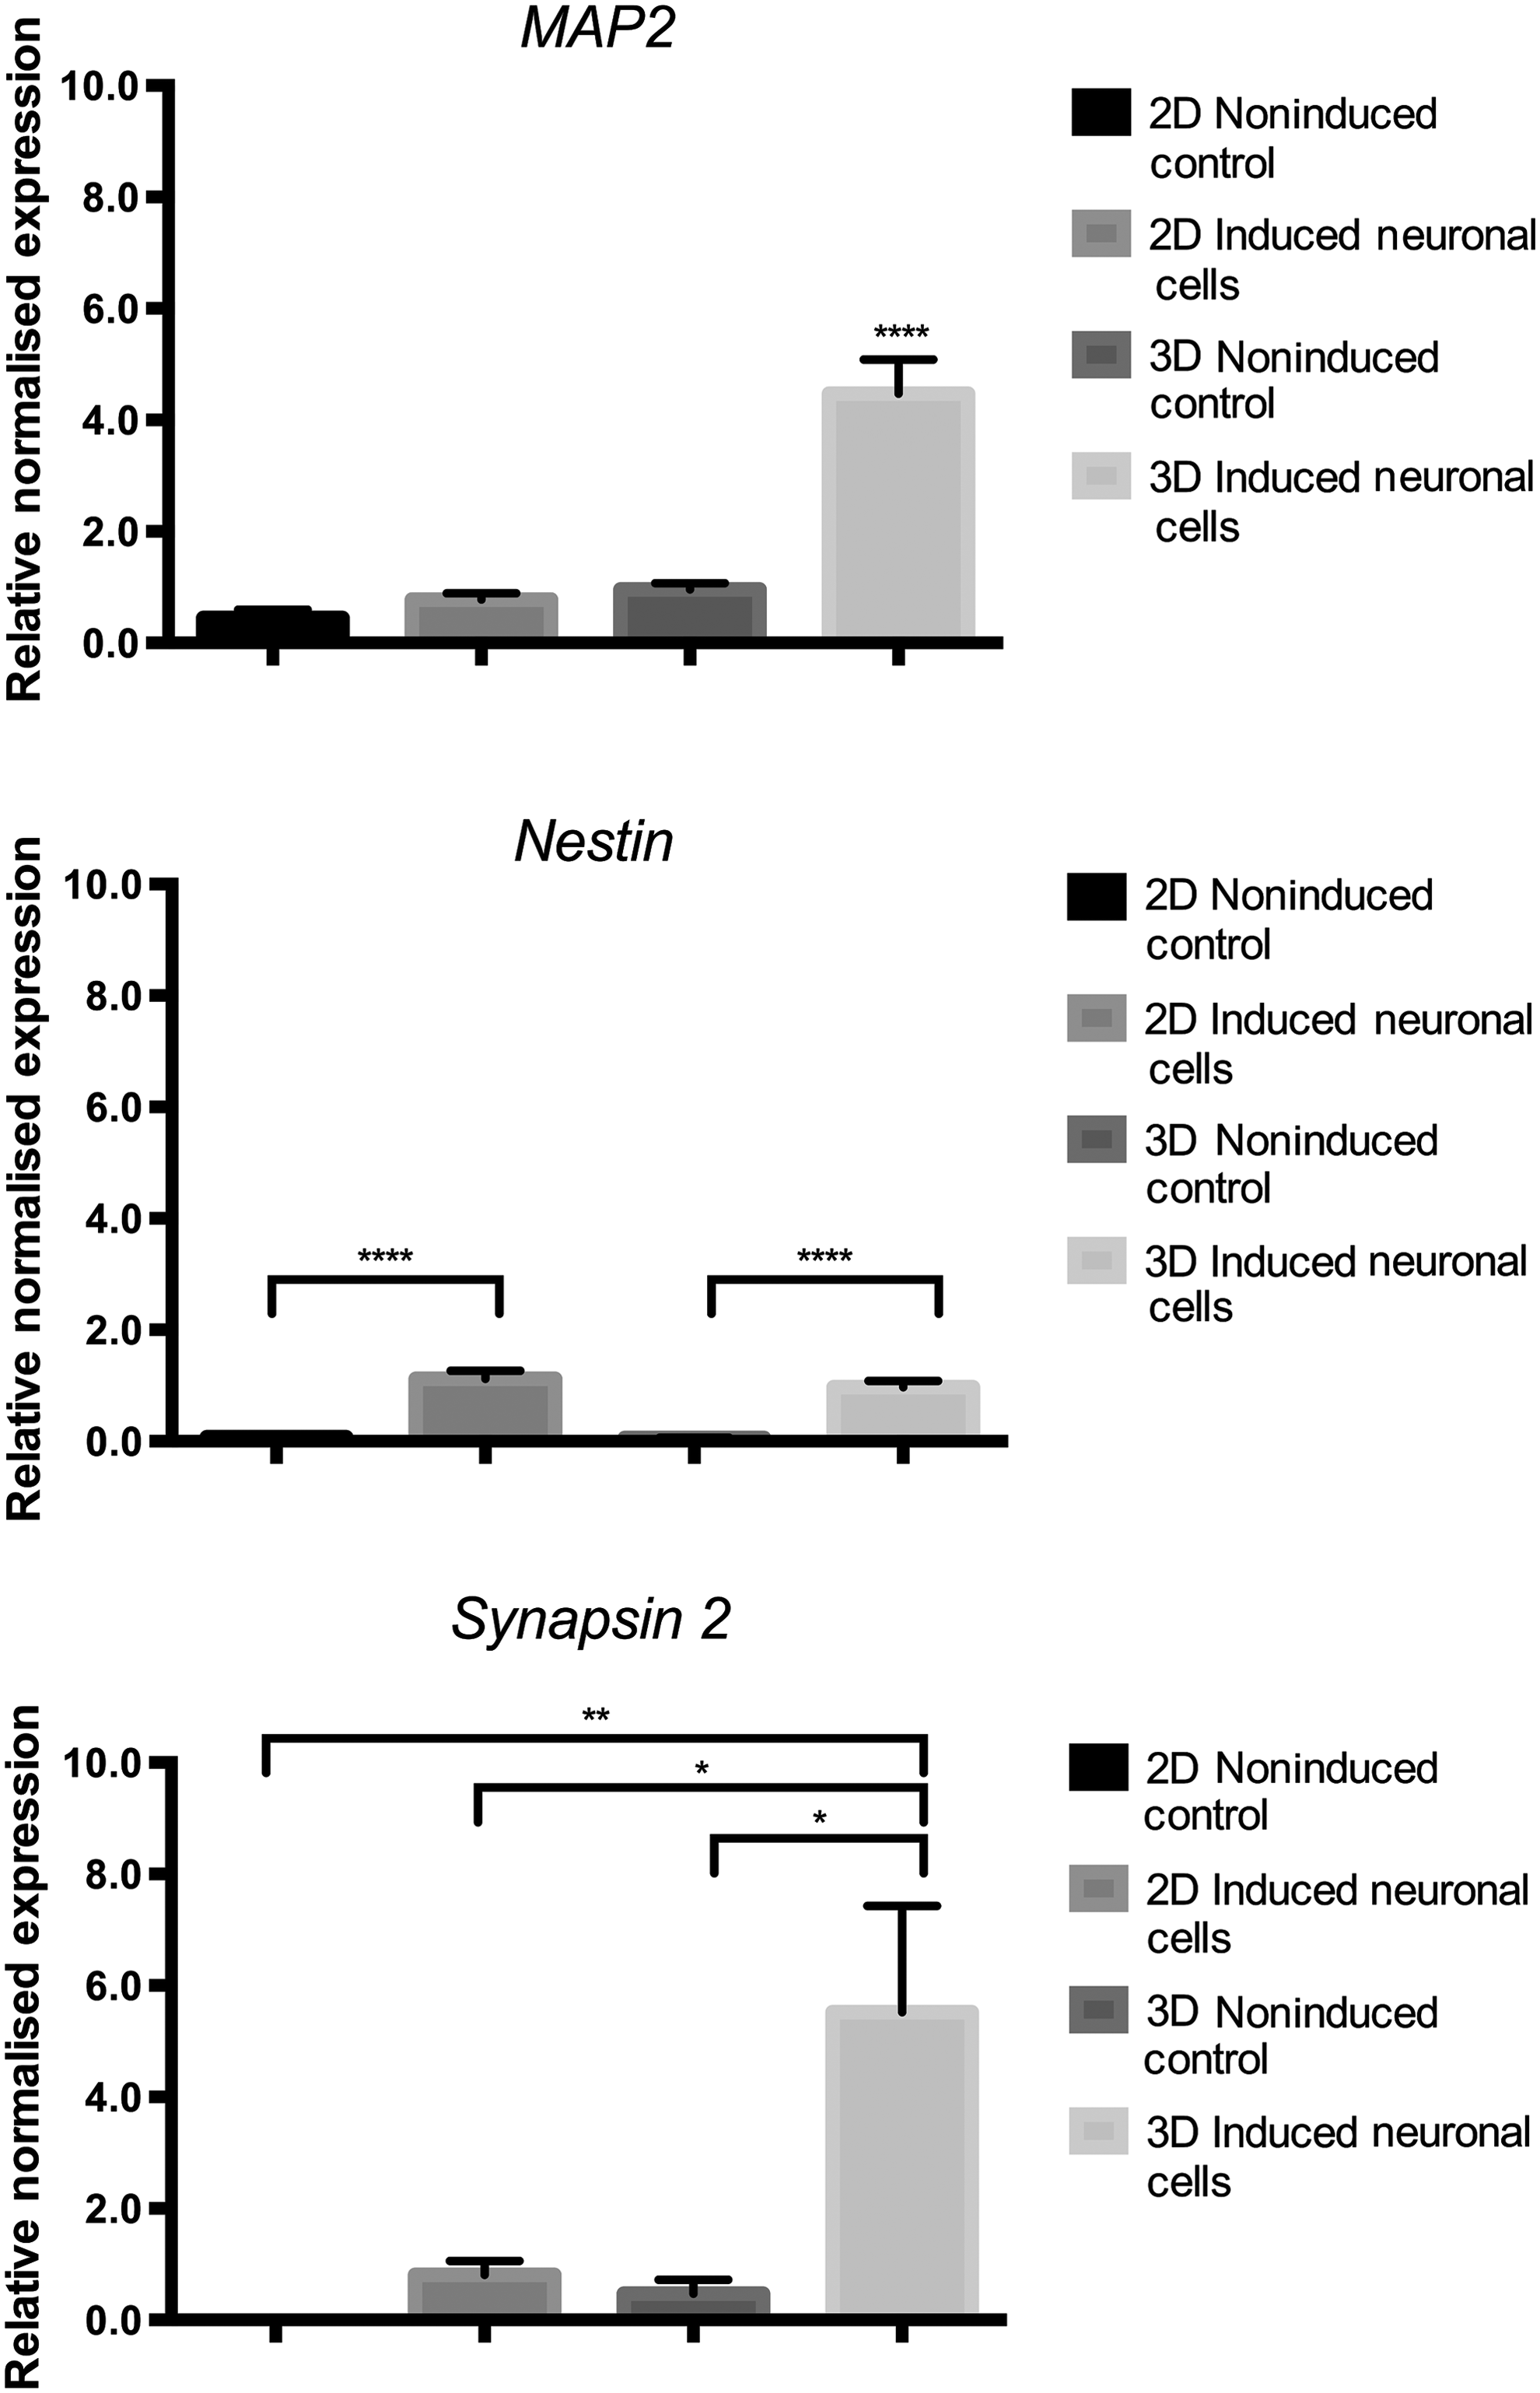
Relative gene expression of neural-specific markers in EADSCs grown and transdifferentiated into induced neuronal cells in 2D and 3D culture. Expression of MAP2 and Synapsin 2 was significantly increased in EADSCs transdifferentiated in 3D culture only. Nestin expression was significantly increased following transdifferentiation in both 2D and 3D culture, with no significant differences in expression between EADSCs transdifferentiated in 2D and 3D culture. Data are shown as mean ± SEM (n = 3). (*) p < 0.05; (**) p < 0.01; (****) p < 0.0001.
Discussion
In this study, we demonstrate the generation of induced neuronal cells from EADSCs in both 2D and 3D culture. To our knowledge, this is the first report that describes the successful transdifferentiation of EADSCs into cells of a neuron-like lineage, as well as the first example of transcription factor–mediated neuronal transdifferentiation of equine cells. Furthermore, we present the first evidence of transcription factor–mediated neuronal transdifferentiation in 3D culture.
βIII-tubulin staining demonstrated induced neuronal cells displaying a typical neuronal morphology, similar to that observed during transdifferentiation of human fetal fibroblasts into induced neuronal cells using the neuronal transcription factors BAM and NeuroD1 (Pang et al., 2011). Visual differences between the two culture conditions were quite apparent. Whereas 2D culture resulted in large clumps of cells, likely due to overconfluence of noninduced cells, 3D culture exhibited an even distribution of cells, similar to that observed during differentiation of human neural stem cells in 3D culture using Alvetex® scaffolds (Stevanato and Sinden, 2014). The highly porous multilayer structure of the scaffold not only allowed for the abundance of proliferating noninduced cells through an increased surface area, but also allowed for the extension of neuronal processes, with neurites observed projecting through the depth of the scaffold.
βIII-tubulin staining also revealed an increased conversion efficiency of neuronal transdifferentiation in 3D culture, with a mean percent conversion more than double that observed in 2D culture. In this study, conversion efficiencies ranged from 6.3% in 2D culture to 13.8% in 3D culture. These values are considerably higher than those reported in previous neuronal transdifferentiation studies using the neuronal transcription factors BAM and NeuroD1, with conversion efficiencies of 2–4% in human fibroblast-derived induced neuronal cells (Pang et al., 2011) and <1% in common marmoset fibroblast-derived induced neuronal cells (Zhou et al., 2014), in addition to ∼3% in adipocyte progenitor cell-derived induced neuronal cells transdifferentiated with the BAM factors (Yang et al., 2013).
In combination with use of 3D culture, the conversion efficiency could be further enhanced by taking into account a number of other variables that are known to influence the conversion rate, most significantly the necessity for each cell to receive the full complement of transgenes, which is often not achieved when they are on individual lentiviral vectors (Vierbuchen et al., 2010). Variation in titers of the individual lentiviral vectors may also affect the conversion rate, particularly if efficient transdifferentiation is reliant on a specific stoichiometric combination of the individual transgenes, as was found in the case of human iPSC generation (Papapetrou et al., 2009). It is also important to note that low conversion rates may be attributed to the postmitotic state of the target cell type (neuron-like cells), due to an associated halt in proliferation during the conversion procedure, thus resulting in a reduction in both yield and efficiency (Thoma et al., 2014).
Analysis of gene expression data indicated a heterogeneous population of Nestin+ precursor and MAP2+ Synapsin 2+ differentiated induced neuronal cells. Expression of Nestin, which is predominantly found in neuronal precursor cells (Hendrickson et al., 2011), was increased following transdifferentiation in both 2D and 3D culture, indicating that transdifferentiated EADSCs transit through a Nestin+ precursor state. This is inconsistent with previous studies that have reported that fibroblasts bypass the Nestin+ precursor state during transdifferentiation into induced motor neurons (Son et al., 2011). Additionally, Nestin expression was barely detectable in noninduced control EADSCs, in contrast with previous studies that have demonstrated Nestin expression in noninduced control equine bone marrow–derived MSCs by immunocytochemistry (Cruz Villagrán et al., 2014). Expression of MAP2, which is expressed weakly in neuronal precursor cells and becomes more prominent in differentiated neurons (Crandall et al., 1986), was only increased in EADSCs transdifferentiated in 3D culture, with up to a four-fold increase in expression compared to all other samples.
Similarly, expression of Synapsin 2, a neuron-specific synaptic vesicle-associated protein involved in synaptogenesis and modulation of neurotransmitter release (Chin et al., 1999), was only increased in EADSCs transdifferentiated in 3D culture, with up to a six-fold increase in expression compared to all other samples. Synapsin-positive neurons derived from induced neural stem/progenitor cells have previously been shown to be functional electrophysiologically (Ring et al., 2012; Wang et al., 2013), thus suggesting that Synapsin 2+ induced neuronal cells are likely to be excitable. Interestingly, there were no significant differences in the level of Nestin expression between samples transdifferentiated in 2D and 3D culture. This may be due to the enhanced maturation of induced neuronal cells in 3D culture, with Nestin expression repressed during neuronal differentiation (Boulland et al., 2013). Overall, neuronal transdifferentiation in 2D culture appears to result in Nestin+ precursor induced neuronal cells, whereas 3D culture leads to more mature MAP2+ Synapsin 2+ differentiated induced neuronal cells.
The ability of equine MSCs to transdifferentiate into cells of a neural-like lineage has been previously demonstrated, with evidence of the transdifferentiation of equine bone marrow-derived (Cruz Villagrán et al., 2014; Maia et al., 2012) and umbilical cord matrix-derived (Corradetti et al., 2011; Hoynowski et al., 2007) MSCs into neural crest-like and neuron-like cells by chemical induction. In our study, chemical induction alone was incapable of converting EADSCs into induced neuronal cells, potentially due to differences in the composition of the neuronal induction medium, with the medium used in this study previously demonstrated to induce neuronal differentiation of ESCs (Wernig et al., 2002).
This study shows for the first time that EADSCs can be directly converted into a neuron-like phenotype, with 3D culture shown to enhance neuronal transdifferentiation significantly. These findings will help to increase our understanding of equine neuropathogenesis, with prospective roles in disease modeling, drug screening, and cellular replacement for treatment of equine neurological disorders.
Footnotes
Acknowledgments
This work was funded by the Australian Government's Australian Post-Graduate Award. This manuscript was prepared with funding from the Charles Sturt University Writing Up Award.
Author Disclosure Statement
The authors declare that no conflicting financial interests exist.