




Abstract
Abstract
The “Dolly” based cloning (classical nuclear transfer, [CNT]) and the handmade cloning (HMC) are methods that are nowadays routinely used for somatic cloning of large domestic species. Both cloning protocols share several similarities, but differ with regard to the required in vitro culture, which in turn results in different time intervals until embryo transfer. It is not yet known whether the differences between cloned embryos from the two protocols are due to the cloning methods themselves or the in vitro culture, as some studies have shown detrimental effects of in vitro culture on conventionally produced embryos. The goal of this study was to unravel putative differences between two cloning methods, with regard to developmental competence, expression profile of a panel of developmentally important genes and epigenetic profile of porcine cloned embryos produced by either CNT or HMC, either with (D5 or D6) or without (D0) in vitro culture. Embryos cloned by these two methods had a similar morphological appearance on D0, but displayed different cleavage rates and different quality of blastocysts, with HMC embryos showing higher blastocyst rates (HMC vs. CNT: 35% vs. 10%, p < 0.05) and cell numbers per blastocyst (HMC vs. CNT: 31 vs. 23 on D5 and 42 vs. 18 on D6, p < 0.05) compared to CNT embryos. With regard to histone acetylation and gene expression, CNT and HMC derived cloned embryos were similar on D0, but differed on D6. In conclusion, both cloning methods and the in vitro culture may affect porcine embryo development and epigenetic profile. The two cloning methods essentially produce embryos of similar quality on D0 and after 5 days in vitro culture, but thereafter both histone acetylation and gene expression differ between the two types of cloned embryos.
Introduction
S
While the underlying principle is similar with both methods, there are some fundamental differences between the two protocols, for example, regarding the additional cytoplasm used for HMC and the essential need for IVC with HMC. However, there are differences between the two protocols when used for cloning pigs, illustrated by differences found between CNT or HMC derived embryos after IVC (blastocyst rate: 10% [personal communication] vs. 40% [Schmidt et al., 2010], respectively).
In addition, some studies have shown that IVC reduces developmental capacity of noncloned pig embryos (Bryla et al., 2009; Kikuchi et al., 1999; Pomar et al., 2005). Even with these different approaches and the different time intervals until embryo transfers (CNT: Day 0–1; HMC: Day 5–6), both methods resulted in similar levels of average pregnancy rates (CNT vs. HMC, 88% vs. 90% [Callesen et al., 2014; Nowak-Imialek et al., 2011]), litter sizes (CNT vs. HMC, 5.2 vs. 5.1 [Petersen et al., 2008; Schmidt et al., 2010]) and liveborn piglets (CNT vs. HMC, 78% vs. 77% [Ahrens et al., 2015; Hauschild-Quintern et al., 2013; Nowak-Imialek et al., 2011; Oropeza et al., 2009; Petersen et al., 2009, 2011; Schmidt et al., 2010]).
The goal of this study was to investigate potential differences between the two cloning methods, particularly to elucidate whether there was advantage for HMC or CNT method, to unravel some of the underlying molecular mechanisms, possibly related to the observed differences in embryos derived from either CNT or HMC at two time points, that is, day 0 and 5–6. Both cloning protocols were applied under largely similar conditions, that is, done in the same lab and in the same time period. The developmental competence of porcine cloned embryos produced by either CNT or HMC to the blastocyst stage was determined, histone acetylation (H3K18ac) was analyzed, and mRNA expression of genes critically involved in histone acetylation was measured in embryos either on days 5 or 6 of culture or immediately after reconstruction (day 0), that is, without IVC.
Material and Methods
The laboratory work (NT, embryo culture, analysis of gene expression) was carried out in the laboratory in Mariensee (Germany), using standardized material as far as possible (plastics, in vitro maturation [IVM] and IVC media etc.). Primary fibroblasts from an established porcine cell culture were used as donor cells. Ovaries were obtained from one abattoir from which ovaries have been obtained over the past years (Petersen et al., 2008). Staining and analysis of histone acetylation was performed in Foulum (Denmark).
Nuclear transfer
NT experiments were performed on the same day (Day 0, D0), using the same batches of pig oocytes from abattoir ovaries, collected from prepubertal gilts under the same IVM conditions. To avoid negative effect of media changes on the embryo development, media for cell fusion and activation were used as in the original protocols for each method.
As donor cells for these experiments, Oct4-EGFP transgenic fibroblasts (Nowak-Imialek et al., 2011) were used. The donor cells were arrested at G0/G1 of the cell cycle by serum starvation (DMEM +0.5% fetal calf serum (FCS)) for 48 hours. Before NT, cells were treated for 10 minutes with trypsin/EDTA and centrifuged (200 g/3 min) twice in a 10-mL tube containing 5 mL Ca2+-free Tyrode's lactate HEPES (TL-HEPES) and 100 μL FCS. The supernatant was removed and the cells were resuspended in 5 mL Ca2+-free TL-HEPES and centrifuged again. Finally, the supernatant was removed and the cells were resuspended in 1 mL Ca2+-free TL-HEPES. After finishing the cloning procedure, the rest of the fibroblast suspension was frozen in pellets for qualitative analysis.
HMC was performed as previously described (Liu et al., 2014). Briefly, after partial digestion of the zona pellucida with pronase, matured oocytes were bisected manually under stereomicroscope with a microblade (AB technology, Pullman, WA). Each ooplast without polar body attached to a single donor cell was fused in fusion medium (0.3 M mannitol, 0.1 mM MgSO4 and 0.01% [w/v] polyvinyl alcohol (PVA)) with a single direct current (DC) pulse of 2.0 kV/cm for 9 μs. One hour later, each ooplast-somatic cell pair was fused to another ooplast in activation medium (fusion medium with 0.1 mM CaCl2) by a single DC pulse of 0.86 kV/cm for 80 μs. After incubation in porcine zygote medium 3 [PZM-3 (Yoshioka et al., 2002)], supplemented with 2 mM 6-dimethylaminopurine (DMAP, Sigma, Germany) for 3 hours, the reconstructed embryos were cultured individually in Well-of-Wells (WOWs, Vajta et al., 2000) in 4-well dishes filled with PZM-3 medium.
CNT was performed as described (Petersen et al., 2008). Briefly, oocytes were enucleated by aspirating the polar body and metaphase II plate. A single donor fibroblast was transferred into the perivitelline space of an enucleated oocyte. After cell transfer, fusion was induced in Ca2+-free SOR2 medium (0.25 M Sorbitol, 0.5 mMMg acetate, 0.1% bovine serum albumin (BSA)) with a single electrical pulse of 1.1 kV/cm for 100 μs. After 0.5 hours, reconstructed embryos were activated in an electrical field of 1.0 kV/cm for 45 μs in SOR2 activation medium (0.25 M Sorbitol, 0.1 mM Ca-acetate, 0.5 mM Mg-acetate, 0.1% BSA), followed by incubation with 2 mM 6-DMAP in PZM3 medium for 3 hours. Reconstructed embryos were cultured in groups as used for the HMC, that is, in a four-well dish with PZM-3 medium.
Parthenogenetic activation
Parthenogenetic embryos were produced as controls for the quality of oocytes, activation procedure, and culture conditions. Oocytes were activated in the electrical field of 1.2 kV/cm for 45 μs in SOR2 activation medium (0.25 mol/L Sorbitol, 0.1 mmol/L Ca-acetate, 0.5 mmol/L Mg-acetate, 0.1% BSA), followed by incubation with 2 mM 6-DMAP in PZM3 medium for 3 hours. Parthenogenetic activation (PA) embryos were cultured under the same conditions as CNT embryos.
Evaluation of morphology, fluorescence, and cell number in NT-derived embryos
Morphology of blastocysts on D5 and D6 was evaluated either as “normal” (distinct inner cell mass [ICM], high cell number, no fragments) or “abnormal” (no clearly visible ICM, lower cell number, few fragments). Morulae on D5 were also evaluated as “normal” (compacted, no or few fragments) or “abnormal” (compacted, several fragments). EGFP fluorescence in morulae and blastocysts on D5 and D6 was checked under the fluorescence microscope. Total cell number per blastocyst or morula was counted under ultraviolet light (example shown in Fig. 1D), after DNA conterstaining with Hoechst (last step of immunofluorescence staining).
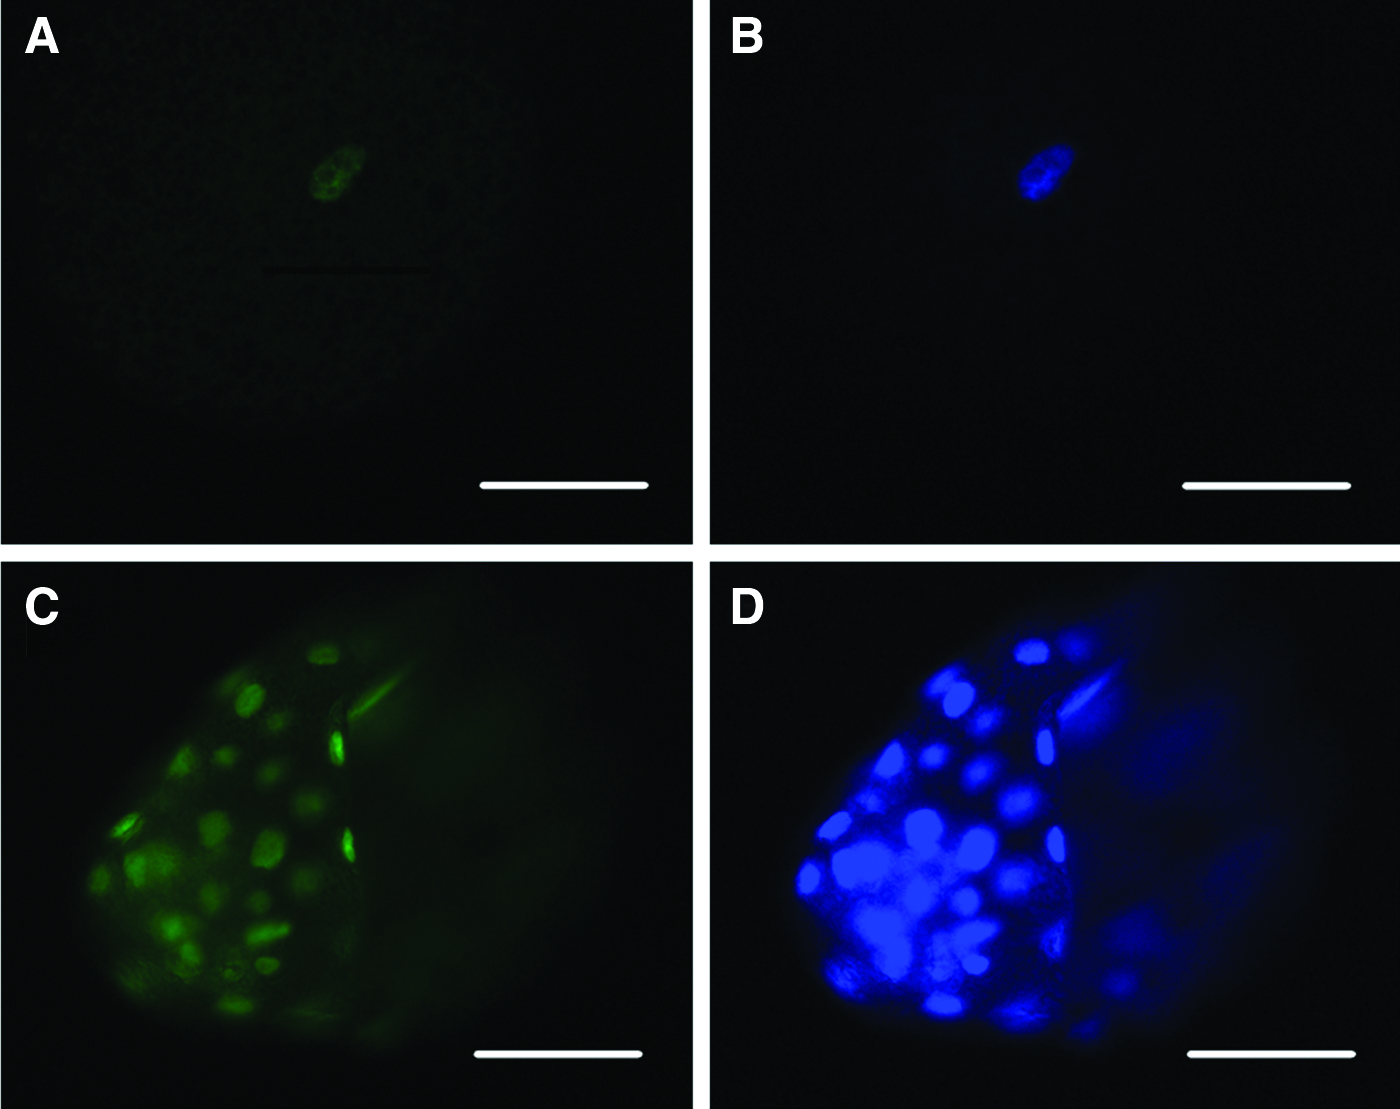
Representative H3K18ac immunostaining at 1-cell
Immunofluorescence staining and quantification
Embryos on D0 (after activation), D5 and D6 (morulae and blastocysts) from all three groups (HMC, CNT, and PA) were fixed in 4% paraformaldehyde for 20 minutes at room temperature. Before fixation, the zona of CNT embryos was removed by pronase. After a short wash in phosphate-buffered saline (PBS), the embryos were stored in PBS with 0.25% BSA and 0.01% PVA at 4°C until use.
Immunofluorescence staining was performed at room temperature as described previously with minor modications (Liu et al., 2014). Fixed SCNT and PA embryos (D0, D5, and D6) were permeabilized with 1% Triton X-100 in PBS for 1 hour, then washed briefly in 0.05% Tween-20 in PBS. Blastocysts were blocked for 1 hour in 2% BSA in PBS, subsequently incubated in blocking buffer containing primary antibodies against H3K18ac (1:500; Abcam, United Kingdom) for 1 hour. After washing in 0.05% Tween-20 in PBS, blastocysts were incubated for 1 hour with secondary antibodies conjugated with Alex Fluor 488 (1:200; Invitrogen) in the dark. Finally, after free antibodies were washed off, DNA was counterstained with Hoechst for 10 minutes. The specimens were mounted by fluorescent mounting medium (Dako). The negative control was confirmed by omitting the primary antibody and never yielded any signal. A representative H3K18ac immunostaining at 1-cell and blastocyst stages is shown in Figure 1.
Image acquisition was performed with epifluorescence microscope (Leica DMIRB) fitted to a Leica DC500 camera. Nuclei of blastomeres were identified by Hoechst and captured with 20× objectives. Fluorescence intensity of H3K18ac was determined using the same field of view and objectives. Images were taken from 3 to 5 focus layers of each embryo, so in total 11–36 nuclei of each embryo were used for evaluation of fluorescence intensity, except embryos on D0 (only one focus layer per embryo). Total fluorescence intensity of the nuclei was measured by using Image J software 1.45 (free software resource, NIH). The nuclei were outlined manually for recording of the nuclear areas.
The cytoplasmic areas were outlined for the background correction, as described by others and our previous study (Deshmukh et al., 2011; Gavet and Pines, 2010; Liu et al., 2014), (a) corrected H3K18ac intensity = nuclear integrated densities of H3K18ac − the mean of the cytoplasmic intensity × the nuclear area; (b) corrected DNA content intensity = nuclear integrated densities of DNA − the mean of the cytoplasmic intensity × the nuclear area. As histone acetylation positively correlated with nuclear DNA contents (Chambliss et al., 2013), corrected DNA content intensity has been used to normalize the level of nuclear H3K18ac; therefore, normalized H3K1ac = corrected H3K18ac intensity/corrected DNA intensity (Deshmukh et al., 2011; Liu et al., 2014).
mRNA isolation and reverse transcription
Poly(A)+ RNA was isolated using Dynabeads® mRNA DIRECT™ Kit (Life Technologies) as previously described (Niemann et al., 2010) with minor modifications. Briefly, pools of five oocytes/one-cell stage embryos or three blastocysts were lysed by adding 50 μL lysis/binding buffer, 100 mM Tris-HCl pH 8.0, 500 mM LiCl, 10 mM EDTA, 1% lithium dodecyl sulfate (LiDS), 5 mM dithiothreitol (DTT) and incubated at room temperature for 10 minutes, then 0.5 pg rabbit globin mRNA (BRL, Gaithersburg) was added as an exogenous standard. Five microliter prepared Dynabeads Oligo d(T)25 were added to the lysate and incubated at room temperature on a shaker to allow binding for 15 minutes, the beads with the bound poly(A)+ RNA were then separated using a Dynal MPC-E-1 magnetic separator. The beads and mRNA were washed as described previously (Niemann et al., 2010). In the final step, the mRNA was eluted from the beads by incubation in 11 μL of sterile water for 3 min at 65°C and the mRNA was immediately used for reverse transcription (RT).
RT was carried out in a total volume of 20 μL with 10× RT reaction buffer, 5 mM MgCl2, 1 mM dNTP solution, 2.5 μM random hexamer primers, 20 Units of RNAsin® and 50 Units murine leukemia virus (MuLV) reverse transcriptase (all Life Technologies), and the complete 11 μL mRNA sample. The samples were incubated in a thermal cycler at 25°C for 10 min for hexamer annealing, then for 1 h at 42°C for elongation, and finally for 5 min at 95°C.
Quantitative real-time polymerase chain reaction (qPCR)
Quantitative real-time polymerase chain reaction (PCR) was performed as previously described (Niemann et al., 2010). Briefly, 20 μL reactions were set up in a 96-well plate including 10 μL 2× Power SYBR_Green PCR Master Mix (Life Technologies), 0.2 μM each forward and reverse primers, cDNA corresponding to 0.3 oocyte/blastocyst equivalents, and 7.2 μL dH2O.
An ABI 7500 Fast Real-Time System (Applied Biosystems) was used with a program of 10 min at 95°C, and 40 cycles of 15 s at 95°C and 1 min at 60°C, followed by a slow heating cycle to obtain a dissociation curve.
A cDNA dilution standard of pooled blastocyst/oocyte or fibroblasts (for DNMT1s) was included on every plate to give standard curves for each individual gene. Standard curves were used for calculation of the relative concentration of each target gene to be normalized to the signal from the rabbit globin mRNA that had been introduced into the mRNA samples as a control. Sequence Detection Software 1.4 was used to perform quantification. Cell numbers on D6 (mean value) in Table 2 were used for normalization.
The mRNA expression of the following genes was determined: K (Lysine) acetyltransferase 2A (KAT2A), K (Lysine) acetyltransferase 2B (KAT2B), E1A binding protein P300 (EP300), Histone deacetylase 1 (HDCA1), Histone deacetylase 2 (HDCA2), DNA methyltransferase 1 oocyte specific (DNMT1o), DNA methyltransferase 1 somatic (DNMT1s), and Glyceraldehyde 3 phosphate dehydrogenase (GAPDH).
The primer sequences of all the genes used for reverse transcription-PCR (RT-PCR) are presented in Table 1. The number of pools for each group: HMC, D0 = 6, D6 = 8; CNT, D0 = 6, D6 = 3; PA, D0 = 9, D6 = 12.
Qualitative analysis of DNMT1s and DNMT1o in donor fibroblasts
Three different OG2 fibroblast pellets were thawed, and Poly(A)+ RNA was isolated as described above via the Dynabeads technology. Cell pellets were lysed by the addition of 200 μL of lysis binding buffer (100 mM Tris-HCl pH8.0, 500 mM LiCl, 10 mM EDTA, 1% LiDS, and 5 mM DTT) and incubated at room temperature for 10 minutes followed by addition of 10 μL prepared Dynabeads Oligo d(T). The further processing was as described above until the final step. The eluted RNA was incubated with DNase I (Epicentre) (2 Units) for 30 min at 37°C and then heated up to 70°C for 10 min.
A total of 10 μL of the RNA were used as input for RT. RT was carried out in a total volume of 20 μL with 10× RT reaction buffer, 5 mM MgCl2, 1 mM dNTP solution, 2.5 μM random hexamer primers, 20 Units of RNAsin, and 50 Units MuLV reverse transcriptase (all Life Technologies). The qPCR was performed as described above. The samples were incubated in a thermal cycler at 25°C for 10 min for hexamer annealing and then for 1 h at 42°C for elongation and finally for 5 min at 95°C. An aliquot of the PCR product was separated on a 3.5% agarose gel (2 μg/mL ethidiumbromide was included for staining) for 40 min at 80 V. A picture was taken with the gel documentation system Fusion SL4 (Vilber Lourmat).
Statistical analysis
The data of PA embryos were not included in the analyses, as they only served as “quality controls” of the basic system for cloned embryo production. Cleavage rates and blastocyst rates of embryos from HMC and CNT groups were analyzed by Chi-square test; the cell number per blastocyst or morula, gene expression, normalized level of H3k18ac between different groups (HMC and TC) or different stages (D0, D5, and D6) were analyzed by General Linear Models (GLM) procedure (SAS version 9.3; SAS institute, Cary, NC).
Experimental design
Experimental 1. Developmental competence, morphology, cell number, and fluorescence evaluation in NT embryos
(1) To investigate the developmental potential of cloned embryos, the cleavage and blastocyst rates of three groups (CNT, HMC, and PA, based on the total number of IVC embryos) were checked on D2, and D5 and D6, respectively. (2) To evaluate the quality of CNT and HMC embryos, all morphological qualities from two NT methods were evaluated on D5 and D6, and total cell numbers were counted in morulae and blastocysts on D5 and D6 (after Hoechst staining). (3) To confirm whether all the NT embryos produced from two methods were correctly reprogrammed, EGFP fluorescence in NT and PA embryos on D5 and D6 was evaluated under the fluorescence microscope. PA embryos were used as “system control and negative control” in the experiment.
Experimental 2. Histone acetylation (H3K18ac) levels in embryos from different groups
H3K18 lysine is one of the primary acetylation sites on histone H3 in mammalian cells (Drogaris et al., 2012). It is considered as marker for nuclear reprogramming and is related to the developmental potential of SCNT embryos (Yamanaka et al., 2009). To evaluate the levels of H3K18ac, embryos from three groups (CNT, HMC, and PA) on D0, D5, and D6 were collected for immunostaining of H3K18ac. Image acquisition was performed with the fluorescence microscope, and fluorescence intensity of the nuclei was measured by using Image J software. Normalized H3K18ac was calculated and used for statistical analysis.
Experimental 3. Gene expression in embryos from different groups
To investigate expression of genes related to histone acetylation, embryos on D0 and D6 from three groups (CNT, HMC, and PA) were collected for mRNA expression of the genes KAT2A/2B, EP300, HDAC1/2, DNMT1o/s, and GAPDH for qPCR. Expression of DNMT1o/s and GAPDH was determined in fibroblasts by RT-PCR.
Results
Experimental 1. Developmental competence, morphology, cell number, and OCT4/GFP fluorescence
In total, 245 HMC embryos, 412 CNT embryos, and 252 PA embryos were produced for this study. As shown in Table 2, cleavage rate of HMC embryos was lower than that of CNT embryos, whereas the blastocyst rate was higher in HMC group compared to the CNT group. All morulae and blastocysts from D5 and D6, both from HMC and CNT, displayed EGFP fluorescence, while PA blastocysts did not show any OCT4/GFP fluorescence.
Values with different superscript letters within a column indicate significant differences between HMC and CNT.
Significant differences between D5 and D6 for HMC or CNT (p < 0.05).
CNT, classical nuclear transfer; HMC, handmade cloning; n, number of embryos; PA, parthenogenetic activation; SEM, standard error of mean.
On D5 and D6, all HMC embryos were evaluated as morphologically “normal,” while the CNT group contained both “normal” and “abnormal” embryos (3/10 on D5 and 4/12 on D6). Compared to CNT (including both “normal” and “abnormal” embryos), total cell numbers per blastocyst were higher in HMC embryos on D5 and D6 (Table 2). The total cell numbers increased from D5 to D6 in HMC embryos, while there were no differences in CNT embryos between D5 and D6.
Experimental 2. Acetylation levels of H3K18
Relative levels of H3K18ac were similar in CNT and HMC embryos on D0 and D5, but decreased from D0 to D5 for both NT groups. However, compared to HMC, CNT embryos on D6 had a higher H3K18ac level (p < 0.05, Table 3). H3K18ac level decreased in HMC embryos from D5 to D6, but was increased in CNT embryos on D6 compared to D5 (p < 0.05).
Value = mean ± SEM.
Significant differences within a column, except PA.
Significant differences in each row for HMC or CNT (p < 0.05).
Experimental 3 mRNA expression
Expression of all genes was downregulated in blastocysts on D6 compared to embryos on D0. There was no difference in gene expression in embryos on D0 from HMC and CNT, respectively (Fig. 2A, B); on D6, expression of KAT2A was higher in CNT embryos than in HMC embryos (p < 0.05, Fig. 2C). Expression of DNMT1o in embryos on D6 was not detectable. However, Figure 3 shows that DNMT1s was expressed in the two batches of donor cells used for HMC and CNT on different cloning days and oocytes; DNMT1o was exclusively detected in oocytes.
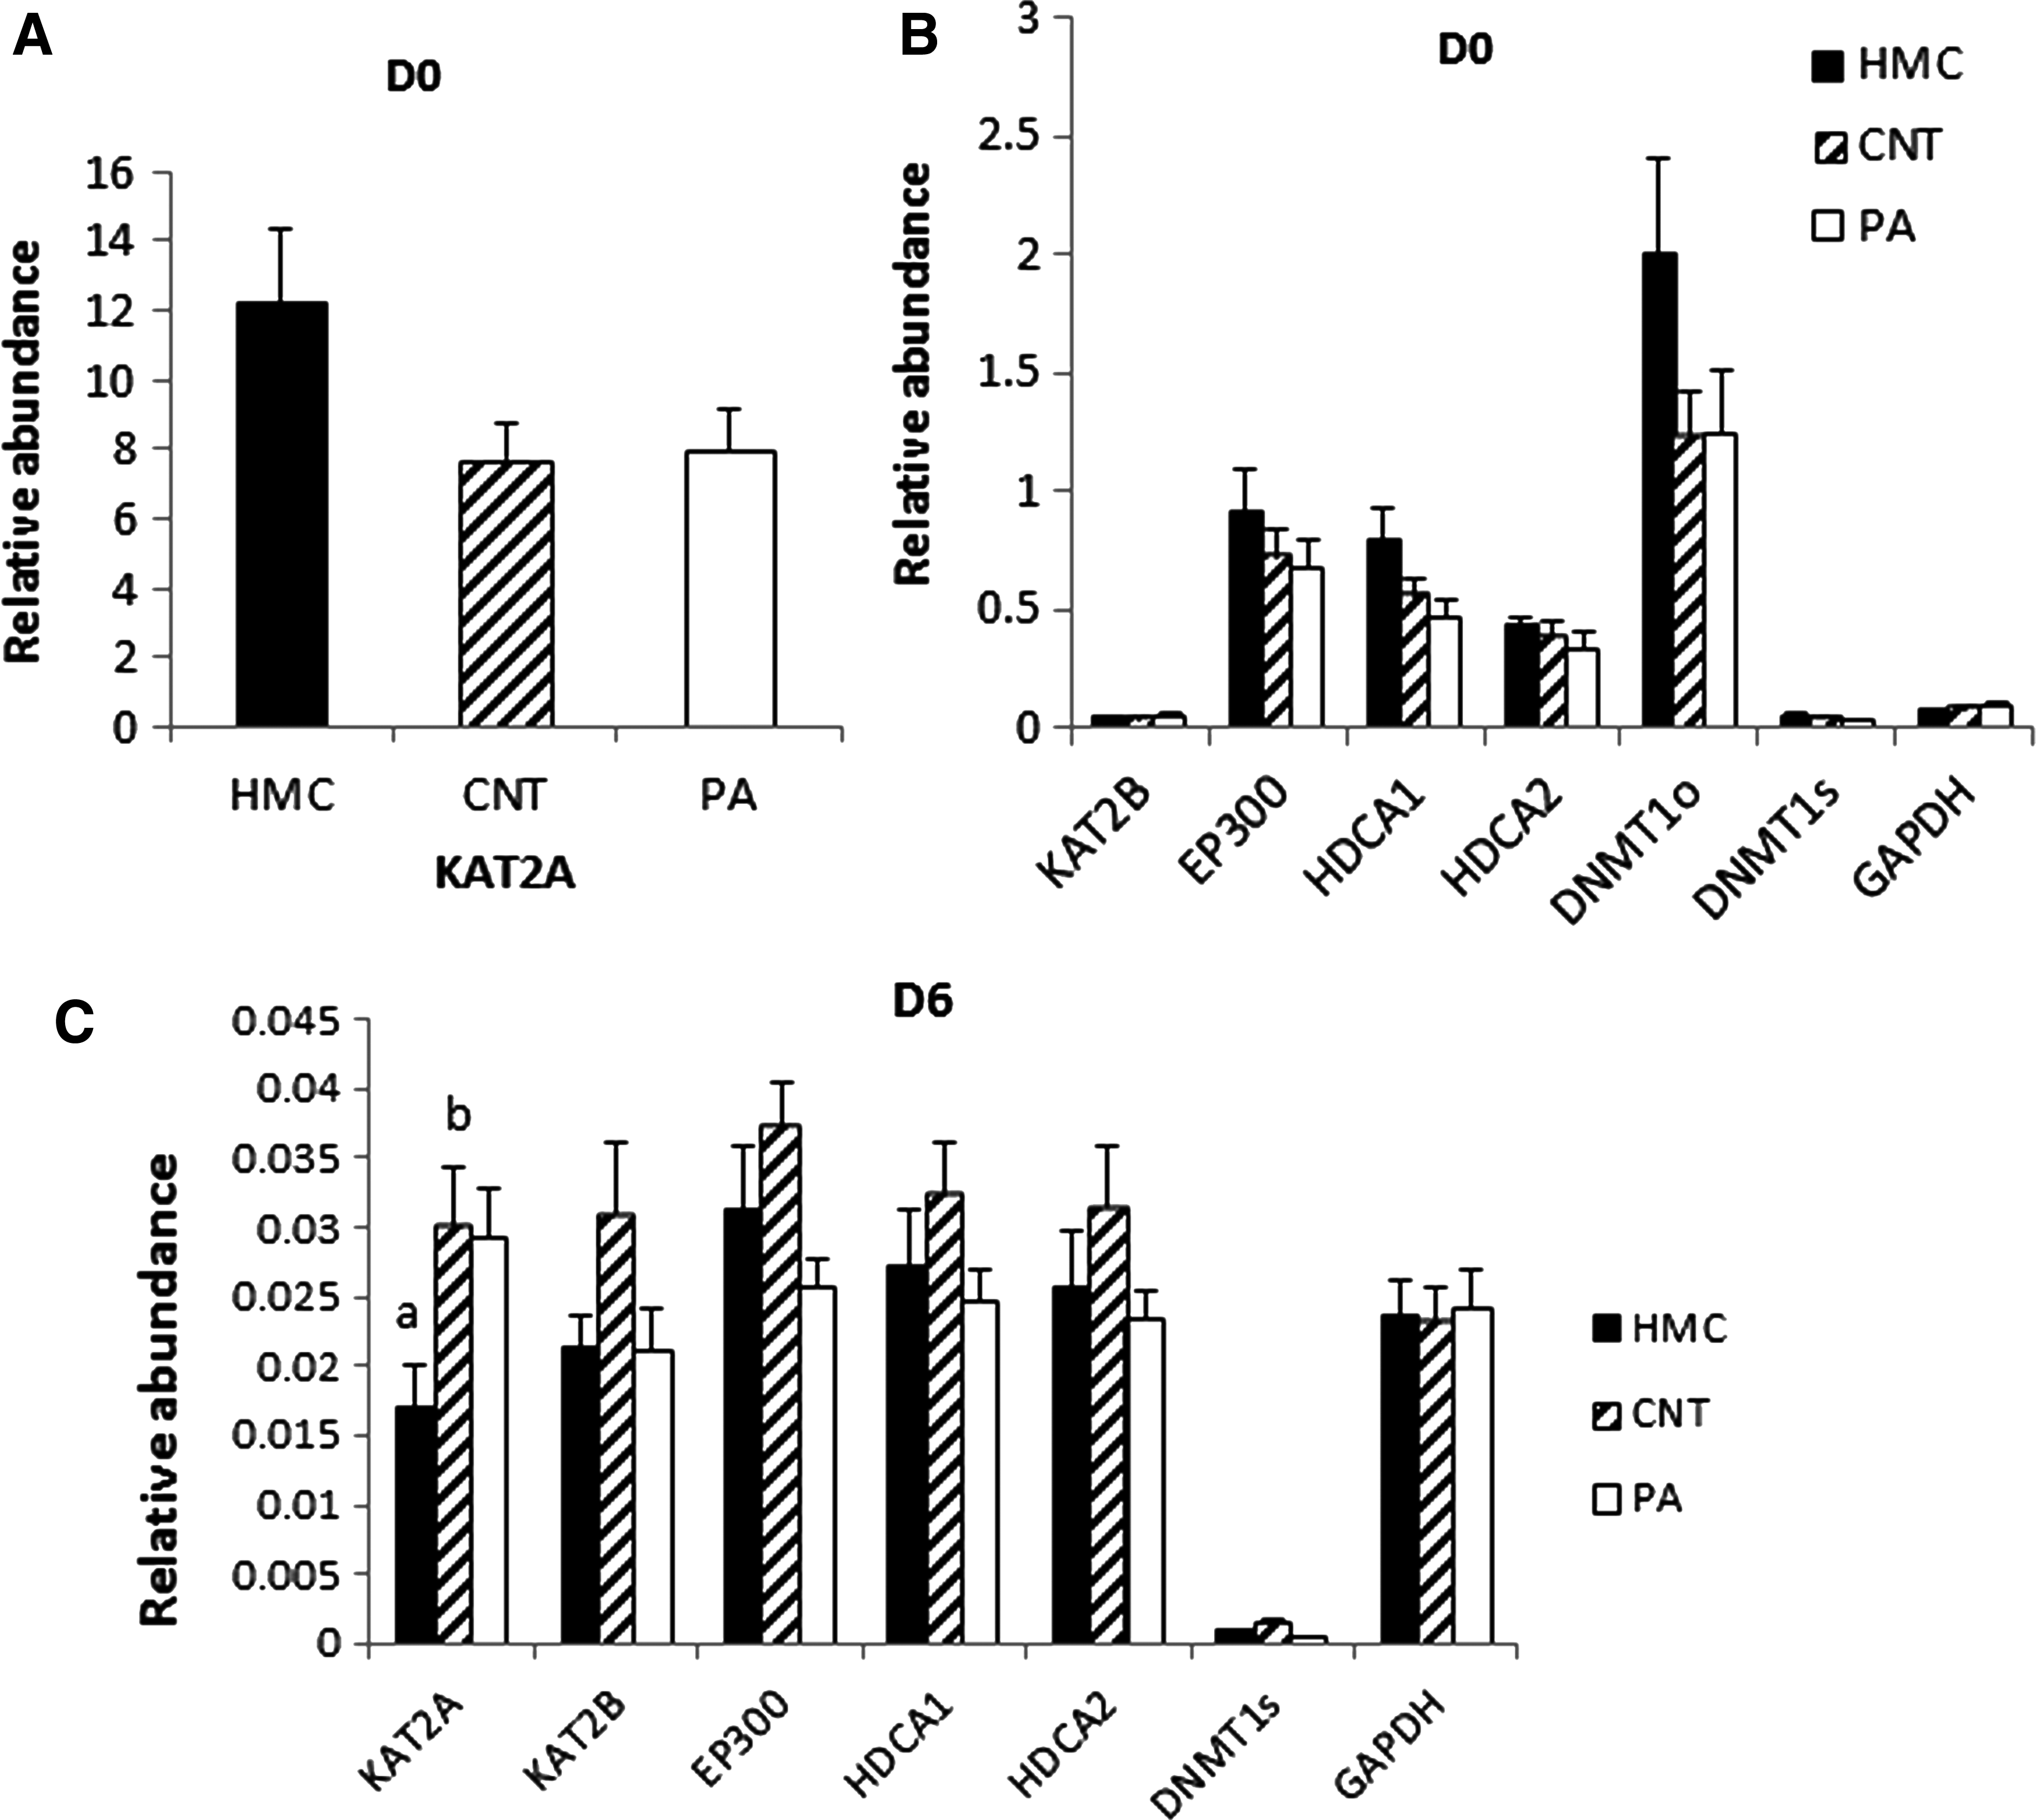
Relative expression of KAT2A/2B, EP300, HDCA1/2, DNMT1s/o and GAPDH in embryos on D0
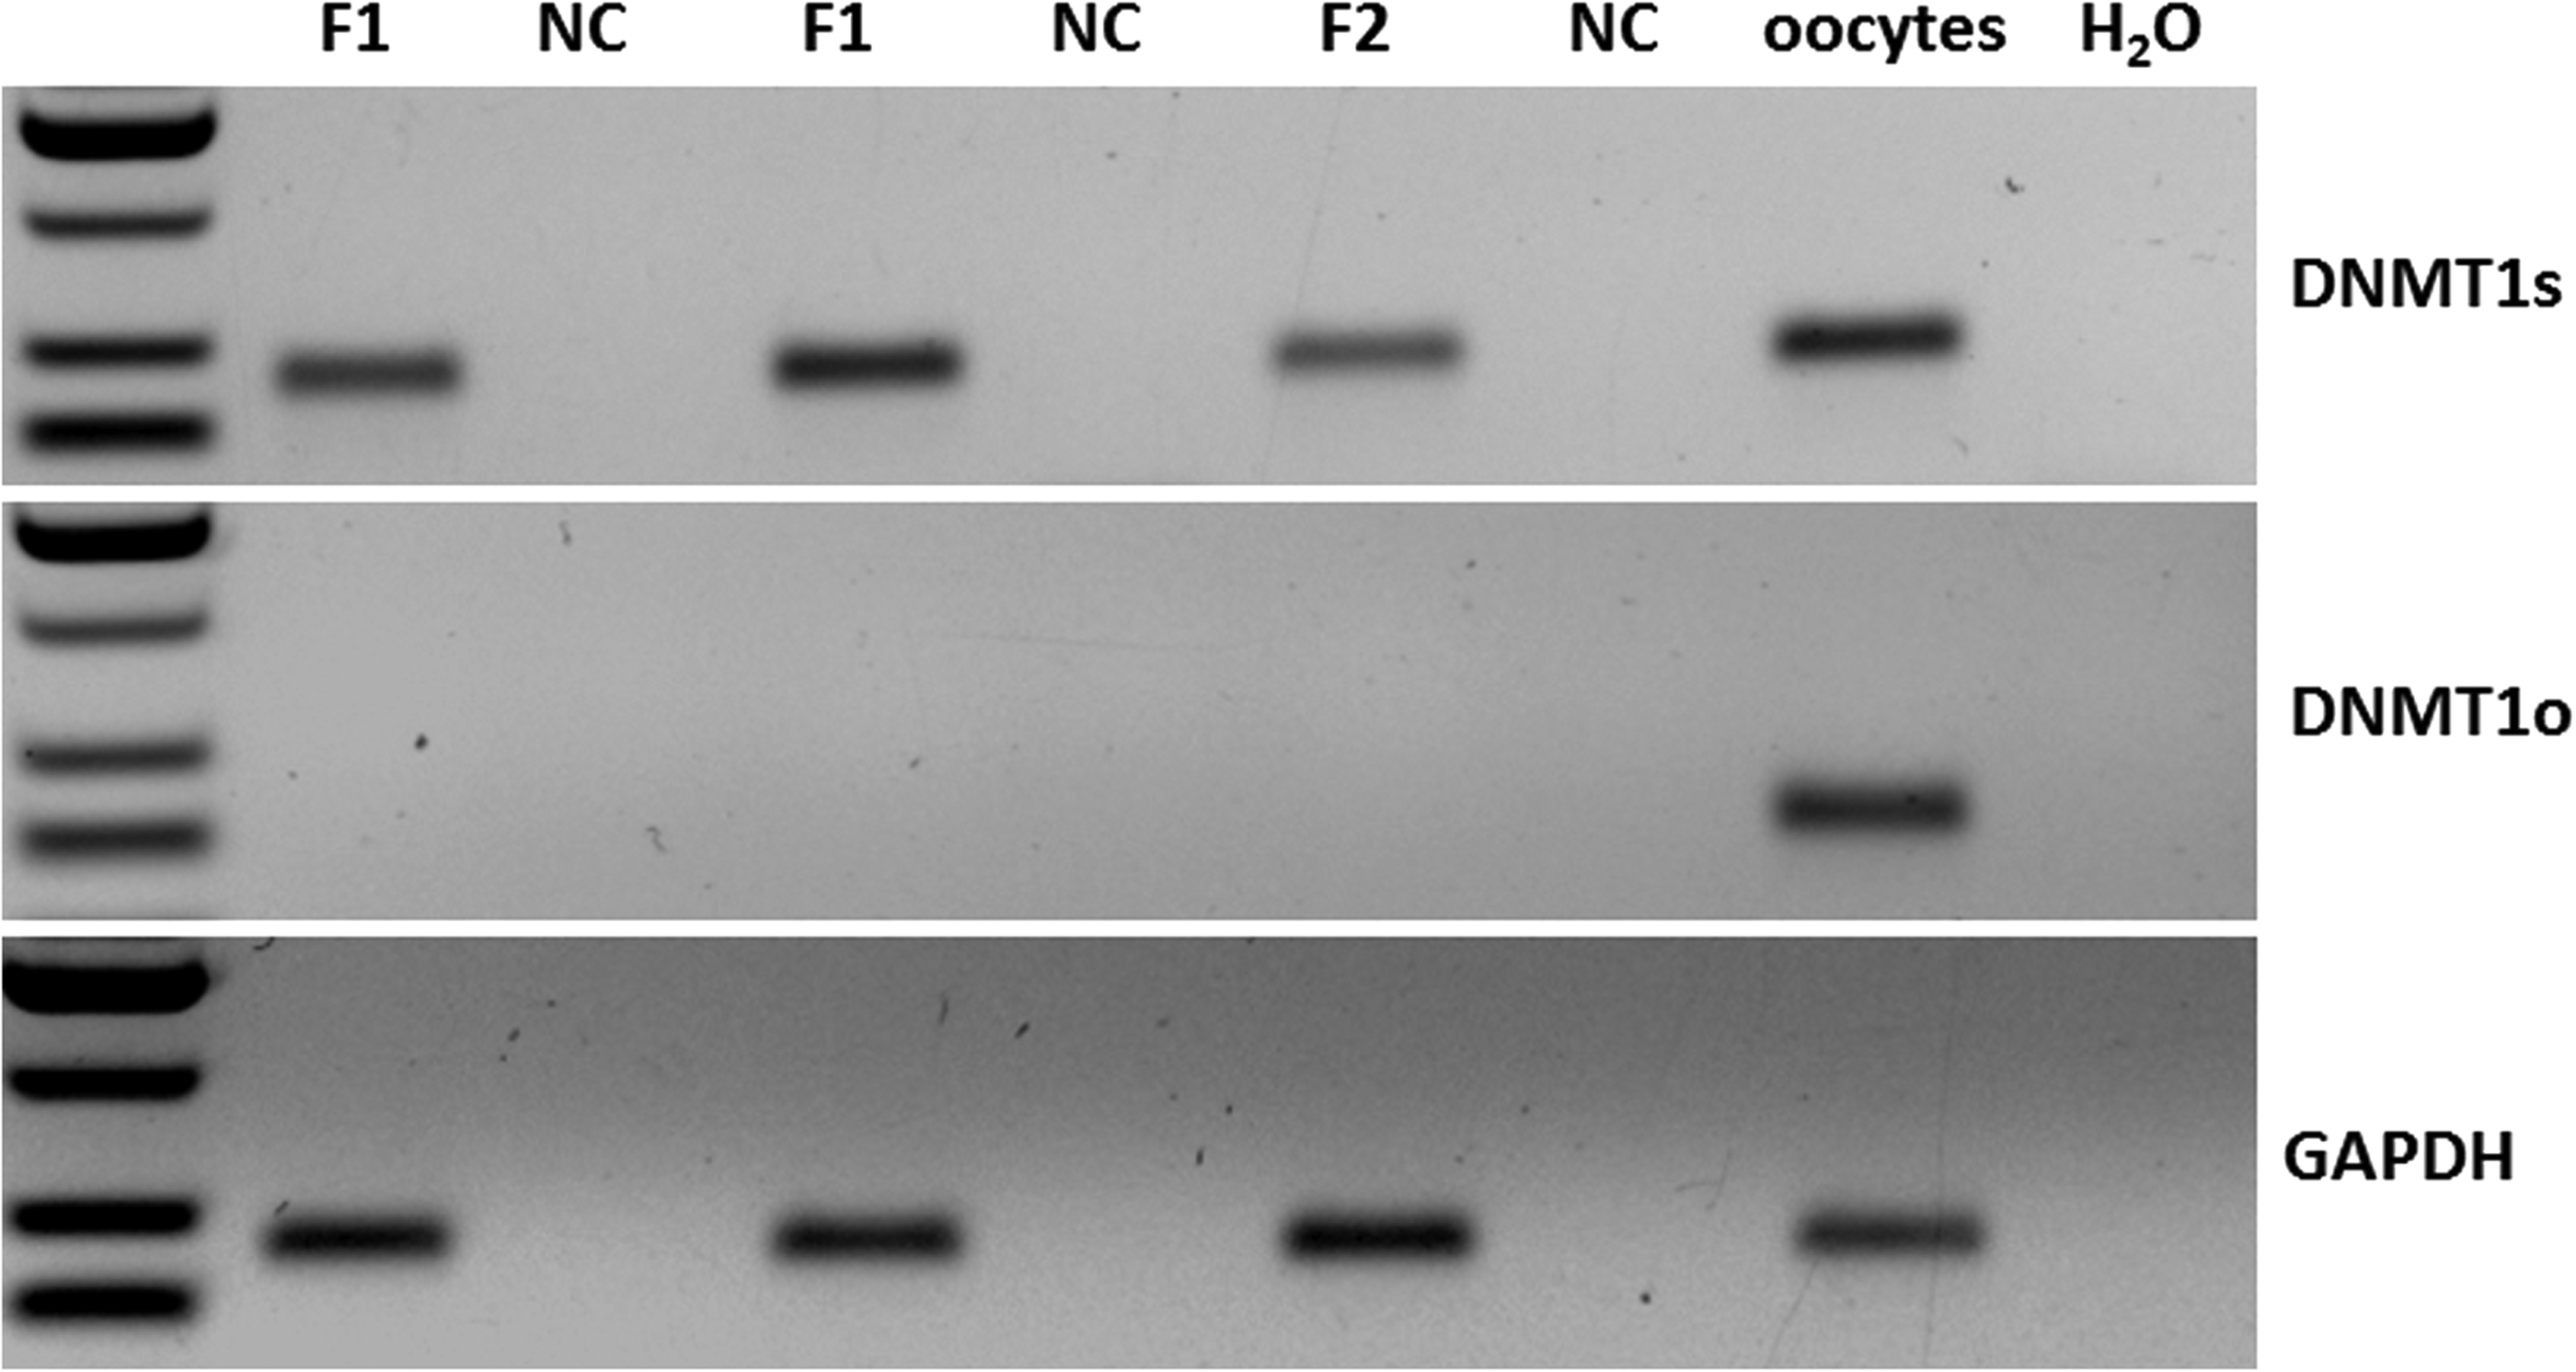
Expression of DNMT 1s and DNMT1o in fibroblasts and oocytes. F1 and F2, donor cells from batch 1 and 2; oocytes, cDNA from oocytes; NC, negative control.
Discussion
After the first report on the successful cloning of a somatic cell (Wilmut et al., 1997), modifications of the original SCNT protocol have been developed, mainly with the goal to simplify the technology to facilitate application under field conditions. One such simplified SCNT protocol is the HMC technique (Vajta et al., 2004). Both methods have been shown to yield viable offspring (Petersen et al., 2008; Schmidt et al., 2010), but a comparative analysis with both SCNT protocols has not yet been reported.
Here, we compared porcine embryos produced by the two SCNT techniques with regard to development to blastocysts, mRNA expression of a panel of genes critically involved in epigenetic regulation, and histone acetylation level at H3K18. The basic system was controlled by including PA embryos; development and cell number of PA embryos were within the normal range usually achieved in our laboratories (Foulum: Pedersen et al., 2015; Mariensee: Hornen et al., 2007), clearly indicating that the entire production chain for cloned embryos was functional. This illustrates the value of having PA as a simple control system.
No direct effect of the two techniques on the reconstructed embryos was found immediately after completion of the cloning procedure, that is, on D0. H3K18 acetylation (Table 3) and gene expression (Fig. 2) were similar in both groups. This led us to consider that reconstructed embryos produced by the two SCNT protocols are of similar quality and should thus have similar starting points at the onset of IVC.
During the culture period, several differences became apparent in the two groups of embryos. On D2, the CNT embryos had a higher cleavage rate, while on D5 and D6 the blastocyst rate was lower than for HMC embryos (Table 2), suggesting a protracted effect of CNT on embryo development. We observed a change in CNT embryo development first visible on D5, when CNT derived embryos had lower cell numbers than their HMC derived counterparts (Table 2). Furthermore, we then observed that during blastocyst formation, the total number of cells in HMC embryos increased again and ultimately was higher than for CNT embryos, for which no differences were observed in embryos from D5 and D6 (Table 2).
There are various differences between two NT methods: enucleation, cell fusion, electrical activation, IVC method (WOWs for HMC and groups for CNT), and volume of reconstructed embryos, which may result in the differences on embryo development and morphological quality. One possible explanation for this observation could be the different morphological quality in the CNT group that included embryos with certain abnormalities (D5 and D6 in total: 7/22).
Another possible explanation could be the different volume of the reconstructed embryos found in embryos produced by the two different NT methods. The volume of HMC embryos after double fusion of somatic cells and cytoplasm is ∼125% of that of intact oocyte, whereas the volume of CNT reconstructed embryos is significantly reduced to ∼75%–80% of an intact oocyte (Li et al., 2015). Blastocyst rate and total cell number are positively correlated with the final volume of the reconstructed embryos and increased with increasing cytoplasmic volume (Li et al., 2015). Interestingly, all morulae and blastocysts from both methods displayed EGFP fluorescence, indicating that both cloning methods were compatible with successfully reactivating the OCT4 promoter, which is a well-known prerequisite for normal development (Nowak-Imialek et al., 2011).
A similar H3K18ac profile was observed in embryos on D5 produced by the two different cloning protocols (Table 3). As a marker for nuclear reprogramming, related to the developmental potential of SCNT embryos (Yamanaka et al., 2009), the lack of any differences in H3K18 acetylation in embryos on D5 indicates that when using the same somatic cells, nuclear reprogramming appeared to be equally effective in embryos from the two cloning methods. Moreover, we did not find correlation between embryos development with level of H3K18ac, and this would also indicate that in spite of differences in embryo development, IVC did not have major influence on embryo quality and the nuclear reprogramming process.
However, the embryos started to become different in quality during blastocyst expansion, suggesting that improved IVC conditions may be needed to provide better support of embryo development during morula to blastocyst transition, which is a critical phase during preimplantation development with differentiation of the two cell compartments (ICM and trophectodem) and telomere length regulation (Kues et al., 2008; Schaetzlein et al., 2004).
Analysis of mRNA transcription of a panel of genes, including lysine acetylation (KAT2B) regulation of eukaryotic gene expression (EP300), histone deacetylation (HDCA1/2), regulation of tissue-specific patterns of methylated residues in oocytes (DNMT1o), and methylation of DNA in somatic cells (DNMT1s), which are critically involved in epigenetic reprogramming, revealed no major differences between embryos derived from both cloning protocols. This in turn supports our suggestion that embryos of largely similar developmental potential result from both cloning protocols. Only expression of KAT2A was different between HMC and CNT embryos on day 6. KAT2A is a transcriptional activator that regulates acetylation of H3K18 (Liu et al., 2016).
Both the higher KAT2A expression and H3K18ac level in CNT embryos relative to HMC embryos on D6 indicate that histone acetylation is more pronounced in CNT embryos rather than that in HMC embryos during blastocyst expansion. We assumed that the HMC embryos have a higher amount of DNMT1o compared to the CNT embryos due to higher amount of cytoplasm; however, there was only a clear trend but no significant difference. Furthermore, Figure 3 shows that our primers of DNMT1o and DNMT1s are specifically suited for different types of cells (oocytes and somatic cells). Although the level of DNMT1s expression is very low in both types of cloned embryos on day 6, it appeared that DNMT1 expression switches from oocyte specific to somatic during the embryo development, as DNMT1o was no more detectable in the embryos on day 6.
In conclusion, here we have shown that both cloning methods and the IVC affect porcine embryo quality and epigenetic profile. The two cloning methods yielded embryos of similar quality on D0 and after 5 days of IVC, thereafter histone acetylation and gene expression differ between the two types of cloned embryos indicating protracted effects on embryo development relative to the applied cloning method.
Footnotes
Acknowledgments
The authors thank Janne Adamsen, Anette M. Pedersen, and Klaus Villemoes for excellent technical assistance. The work was supported financially by grants from The Danish Council for Independent Research/Technology and Production Science (Grant No. 09-066603).
Author Disclosure Statement
No competing financial interests exist.