




Abstract
Abstract
Background:
Little is known about parental recognition of their child's overweight status over time. The aim of this study was to examine the prevalence of parental misperceptions related to preschool children's weight in the last two decades.
Methods:
Data come from the National Health and Nutrition Examination Survey from 1988 to 1994 (early survey; n=3839) and 2007 to 2012 (recent survey; n=3153). Parents were asked whether they considered their child, ages 2–5 years, to be overweight, underweight, or just about the right weight. We estimated the probability ratio (PR) between the two surveys for parents perceiving their overweight child as overweight.
Results:
Percentages of parents who inappropriately perceived their overweight child as just about the right weight was 96.6% and 94.9% for the early and recent survey, respectively. As high as 78.4% of parents perceived their obese child as just about the right weight in the recent survey. The probability of overweight/obese children being perceived as overweight in the early survey was 0.18 (95% confidence interval [CI]=0.14–0.22) and further lowered to 0.14 (95% CI=0.11–0.17) in the recent survey. After adjustment for sociodemographics and BMI z-scores of directly measured body weight, probability of being appropriately perceived by the parents declined by 30% between surveys (PR=0.70 [0.63, 0.78]).
Conclusions:
There was a declining tendency among parents to perceive overweight children appropriately. Strategies are needed to explore how to encourage clinician discussions with parents about appropriate weight for their child and strengthen capacity for childhood obesity prevention.
Introduction
Despite some evidence of a plateauing or decline in obesity prevalence among preschool-aged children, obesity prevalence among this population remains high.1–3 Moreover, a recent study among a nationally representative sample of elementary school children found that incidence of obesity between the ages of 5 and 14 years was more likely to have occurred at younger ages, primarily among children who had entered kindergarten overweight, 4 suggesting that obesity prevention needs to be conducted in preschool or earlier. 5
Preschool age is the life stage when attitudes and behaviors, including food preferences, eating behavior, and physical activity, are shaped, 6 and parents are the primary models7,8; therefore, a critical factor to maintain a healthy parental style and foster a healthy family environment in childhood obesity prevention is parental recognition of their child's overweight status.9–12 For instance, some recent research using data from the Quebec Longitudinal Study of Child Development (1998–2010) concluded that parental misperception of their child's body weight status and lifestyle habits constitutes an unfavorable context for healthy body weight management. 9 However, numerous epidemiological studies have demonstrated that most mothers with overweight preschool children do not perceive their children as overweight. 13 Though informative, most previous studies were conducted among populations with special needs, 14 with small sample size,15–18 and/or were conducted cross-sectionally.16–19 No study has been conducted that examines the overtime change of parents' perception of weight status among their preschool child, allowing an evaluation of whether the parent's recognition has been improved. Some studies have, however, reported that “perceived” normal weight has increased with the increased prevalence of adult obesity.20,21 Evidence exists to support this trend of misperceptions,19,22–25 but only among adults.
The current study aims to fill important gaps in the literature on parental perception of their preschool children's weight over time, recognizing that parental perception of their children's weight can be important for childhood obesity prevention. The primary aim of the current study is to examine the misconception of parental perceptions of the weight status of their preschool-aged child overtime. We also sought to identify the subpopulation among which misperceptions are most prevalent. By thoroughly examining the evolution of parental perceptions of their child's weight, we can help to identify effective strategies for childhood obesity prevention.
Methods
Study Design and Population
Data for this study came from the National Health and Nutrition Examination Survey (NHANES) conducted by the National Center for Health Statistics of the CDC. Participants were preschool children ages 2–5 years and their primary caregivers in the NHANES III conducted during 1988–1994 (early survey) or the continuous NHANES conducted during 2007–2012 (recent survey). NHANES uses a multistage probability sampling design. Interviews and anthropometric assessments (e.g., weight and height) were conducted in NHANES. In order to align with the study aim related to childhood obesity, we excluded children who were underweight (BMI <5th percentile). This equated to the exclusion of 211 children from the early survey and 134 children from the recent survey. We also excluded 436 individuals because of missing data on family income level. Children for whom the interview was not conducted by a proxy (n=26) or parental perception was not available (n=8) were also excluded. A total of 3839 children in the early survey and 3151 children in the recent survey were the analytic sample.
Study Variables
Parental assessment of children's weight status
Computer-Assisted Personal Interviewing system methodology (in phase I of NHANES III, paper-and-pen method) was used to administer questionnaires to a proxy respondent. NHANES interviews are conducted in English and Spanish by trained field staff. Data for proxy's assessment of the Household Youth Questionnaires in the early survey and the Early Childhood section of the recent survey served as data sources for proxy's assessment of child's weight status. In 1988–1994 and 2007–2008, the survey question was: “Do you consider [child's name] to be: overweight, underweight, just about the right weight, or don't know.” From 2009–2012, the question used was: “How do you consider [child's name]'s weight?—overweight, underweight, about the right weight, or don't know.” We could not differentiate proxies because relationship status data (e.g., mother, father, grandparent, and so on) were not available in 2007–2012. Therefore, children whose proxies were someone other than a mother were retained from the 2007–2012 data. However, “parental” may be interchangeable with “maternal” given that 89.7% of proxy respondents in the 1988–1994 survey were mothers.
Objectively measured weight status
A mobile examination center and trained health technicians collected anthropometric data using a standard protocol. These data were reviewed for illogical values. Those above the 99th percentile or below the 1st percentile for a specific age or age-gender group were marked and re-evaluated. CDC 2000 Growth Charts (as the reference population) were used to calculate BMI (kg/m2), then converted to gender- and age-specific BMI percentile values and z-scores. In accordance with recommendations of the American Academy of Pediatrics expert panel on childhood obesity 26 and the Institute of Medicine (IOM), 27 participants were then allocated to an obese stratum (BMI ≥95th percentile), an overweight stratum (85th–94th percentile), or a normal weight stratum (<85th percentile). Weight status ≥97th percentile of BMI for age was defined as severe obesity.
Sociodemographic variables
Sociodemographic variables were used to define sample subgroups and/or as model covariates. Family income was assessed with a poverty income ratio (PIR), that is, the ratio of income to the family's poverty threshold as defined by the US Census Bureau. The Consumer Price Index is used to update thresholds annually to account for inflation. We calculated PIR by taking the midpoint of a selected income range value and compared it to the appropriate poverty threshold based on family size and composition. When the appropriate threshold income value exceeded total family income, all persons who comprised the family, and the family as a whole, were consider poor. PIR values below 1.00 were categorized as below the official poverty threshold. Four categories of PIR were utilized in this study: poor (PIR<1.0); near poor (1≤PIR<2); middle income (2≤PIR<4); and high income (PIR ≥4). Income was reported as a range for the previous calendar year. NHANES classified race/ethnicity as non-Hispanic white, non-Hispanic black, Hispanic American, and other.
Statistical Analyses
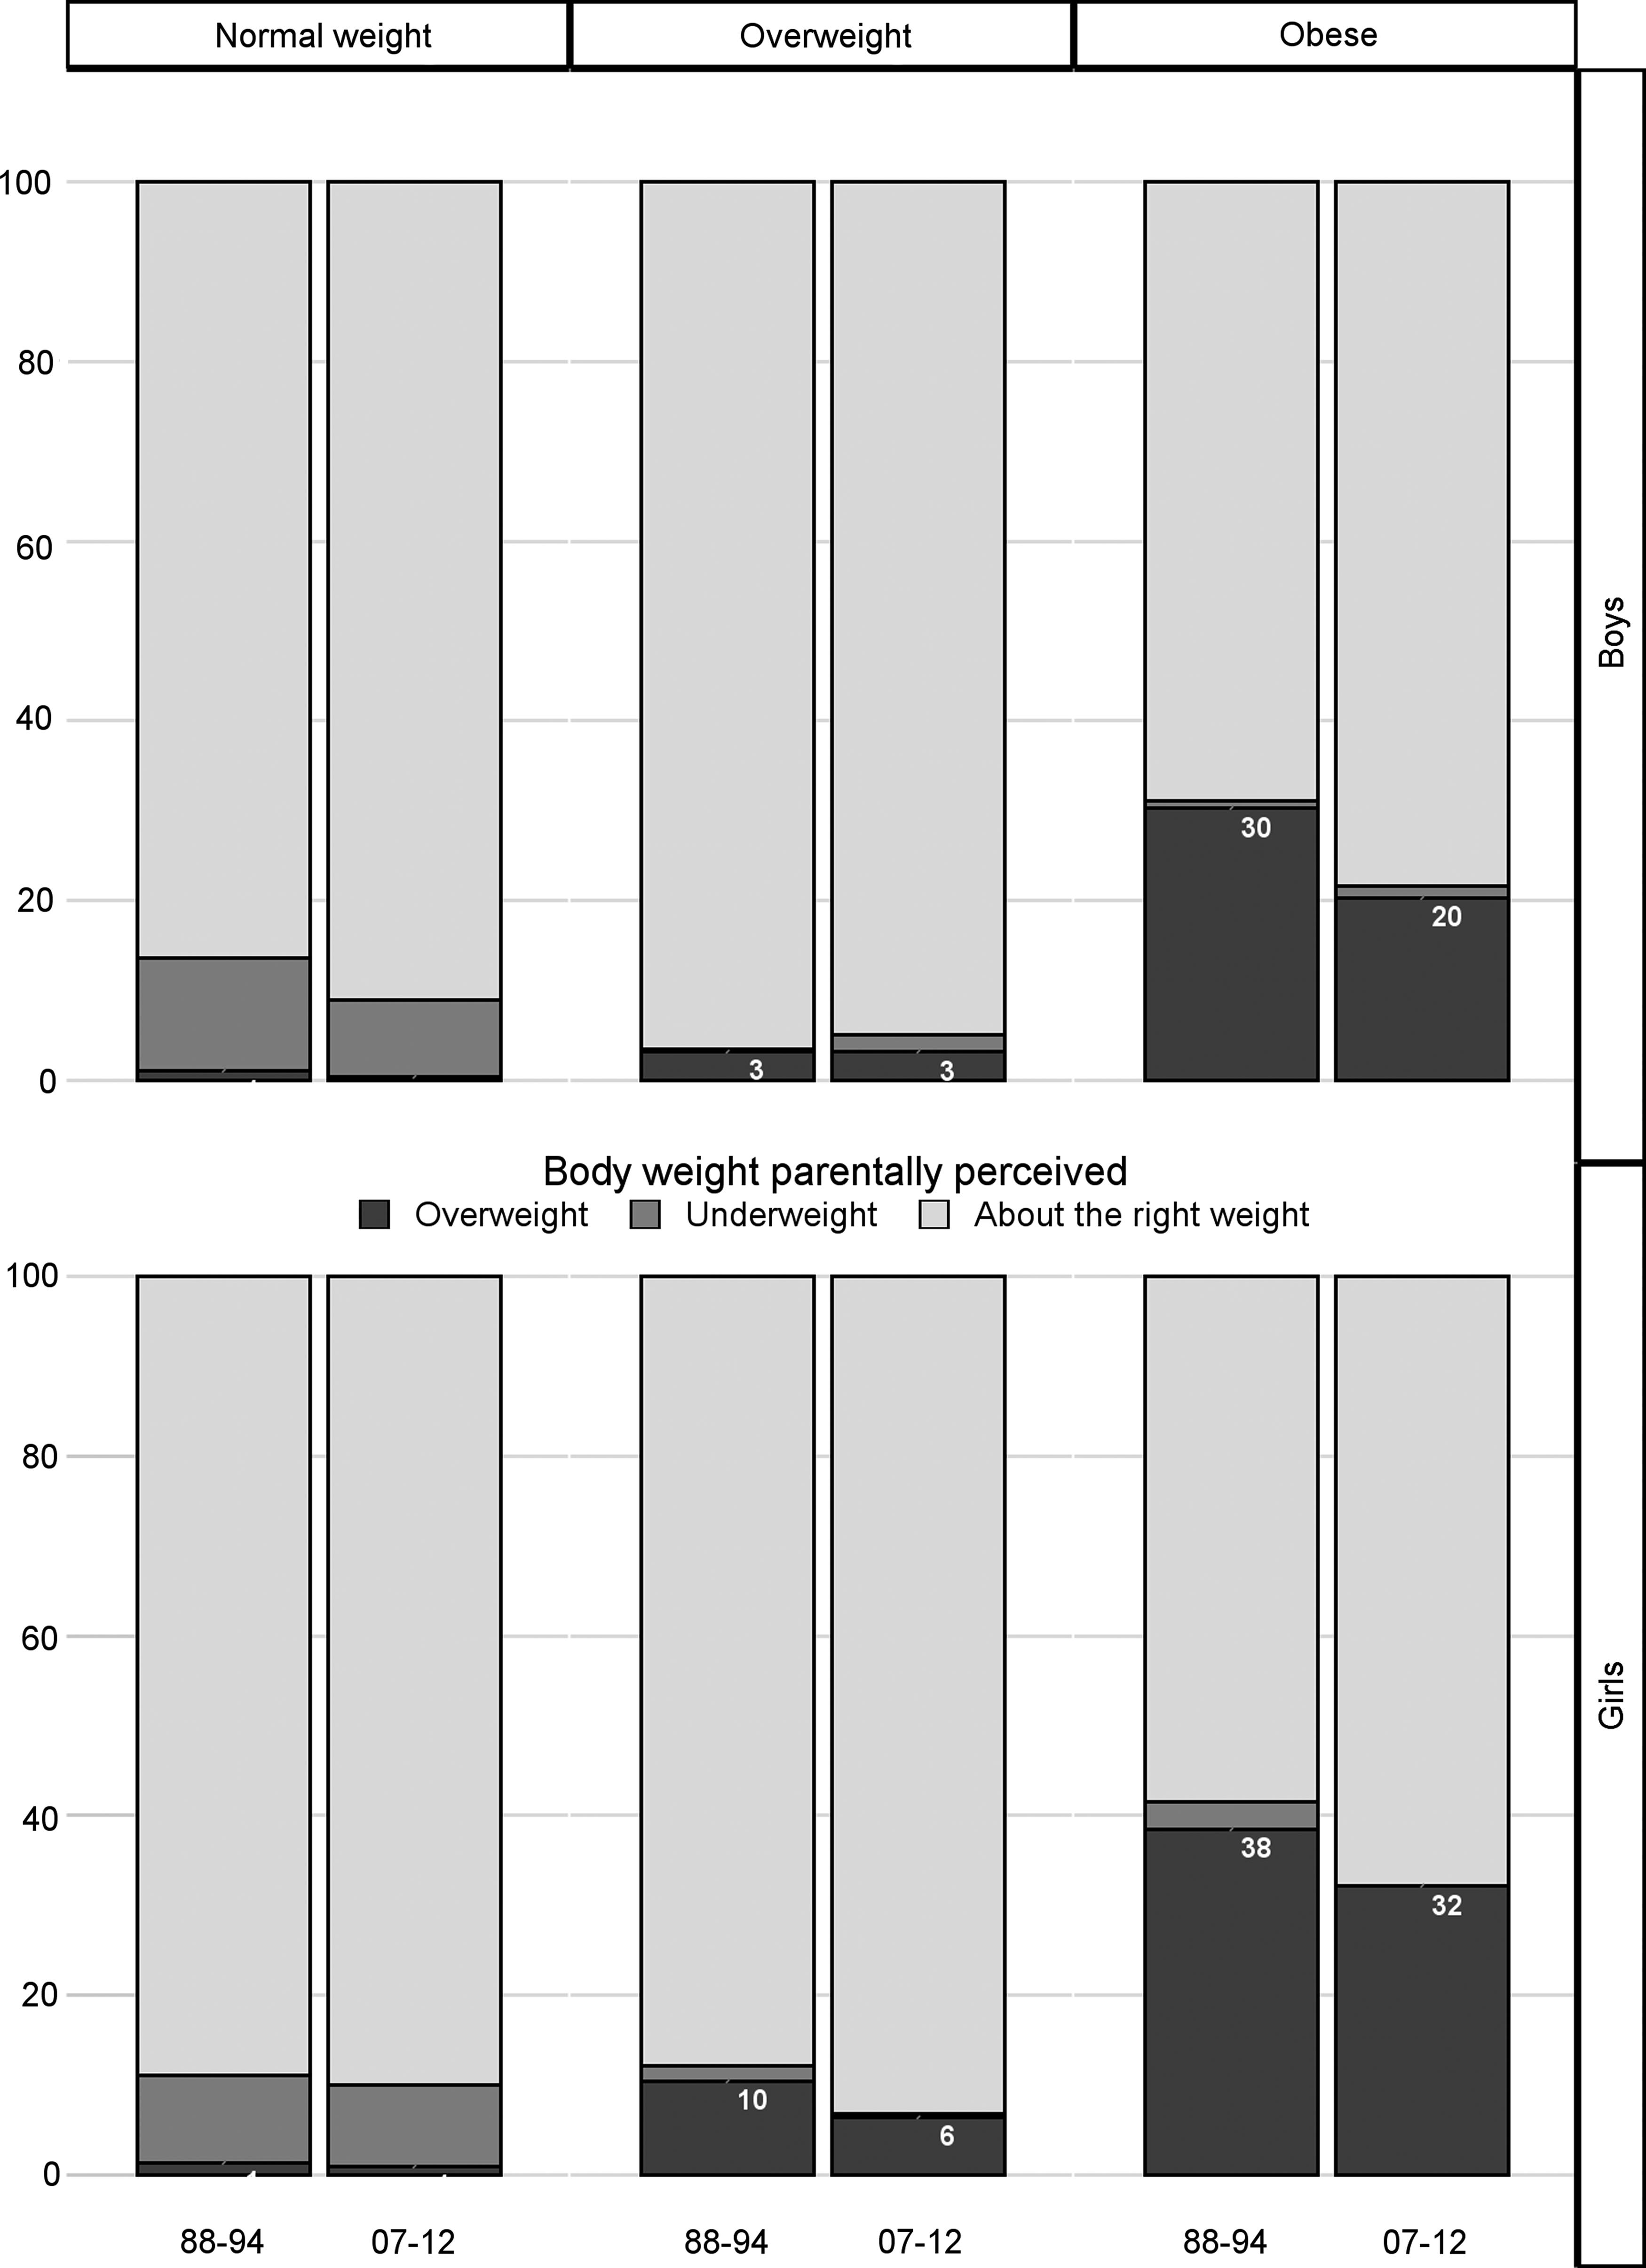
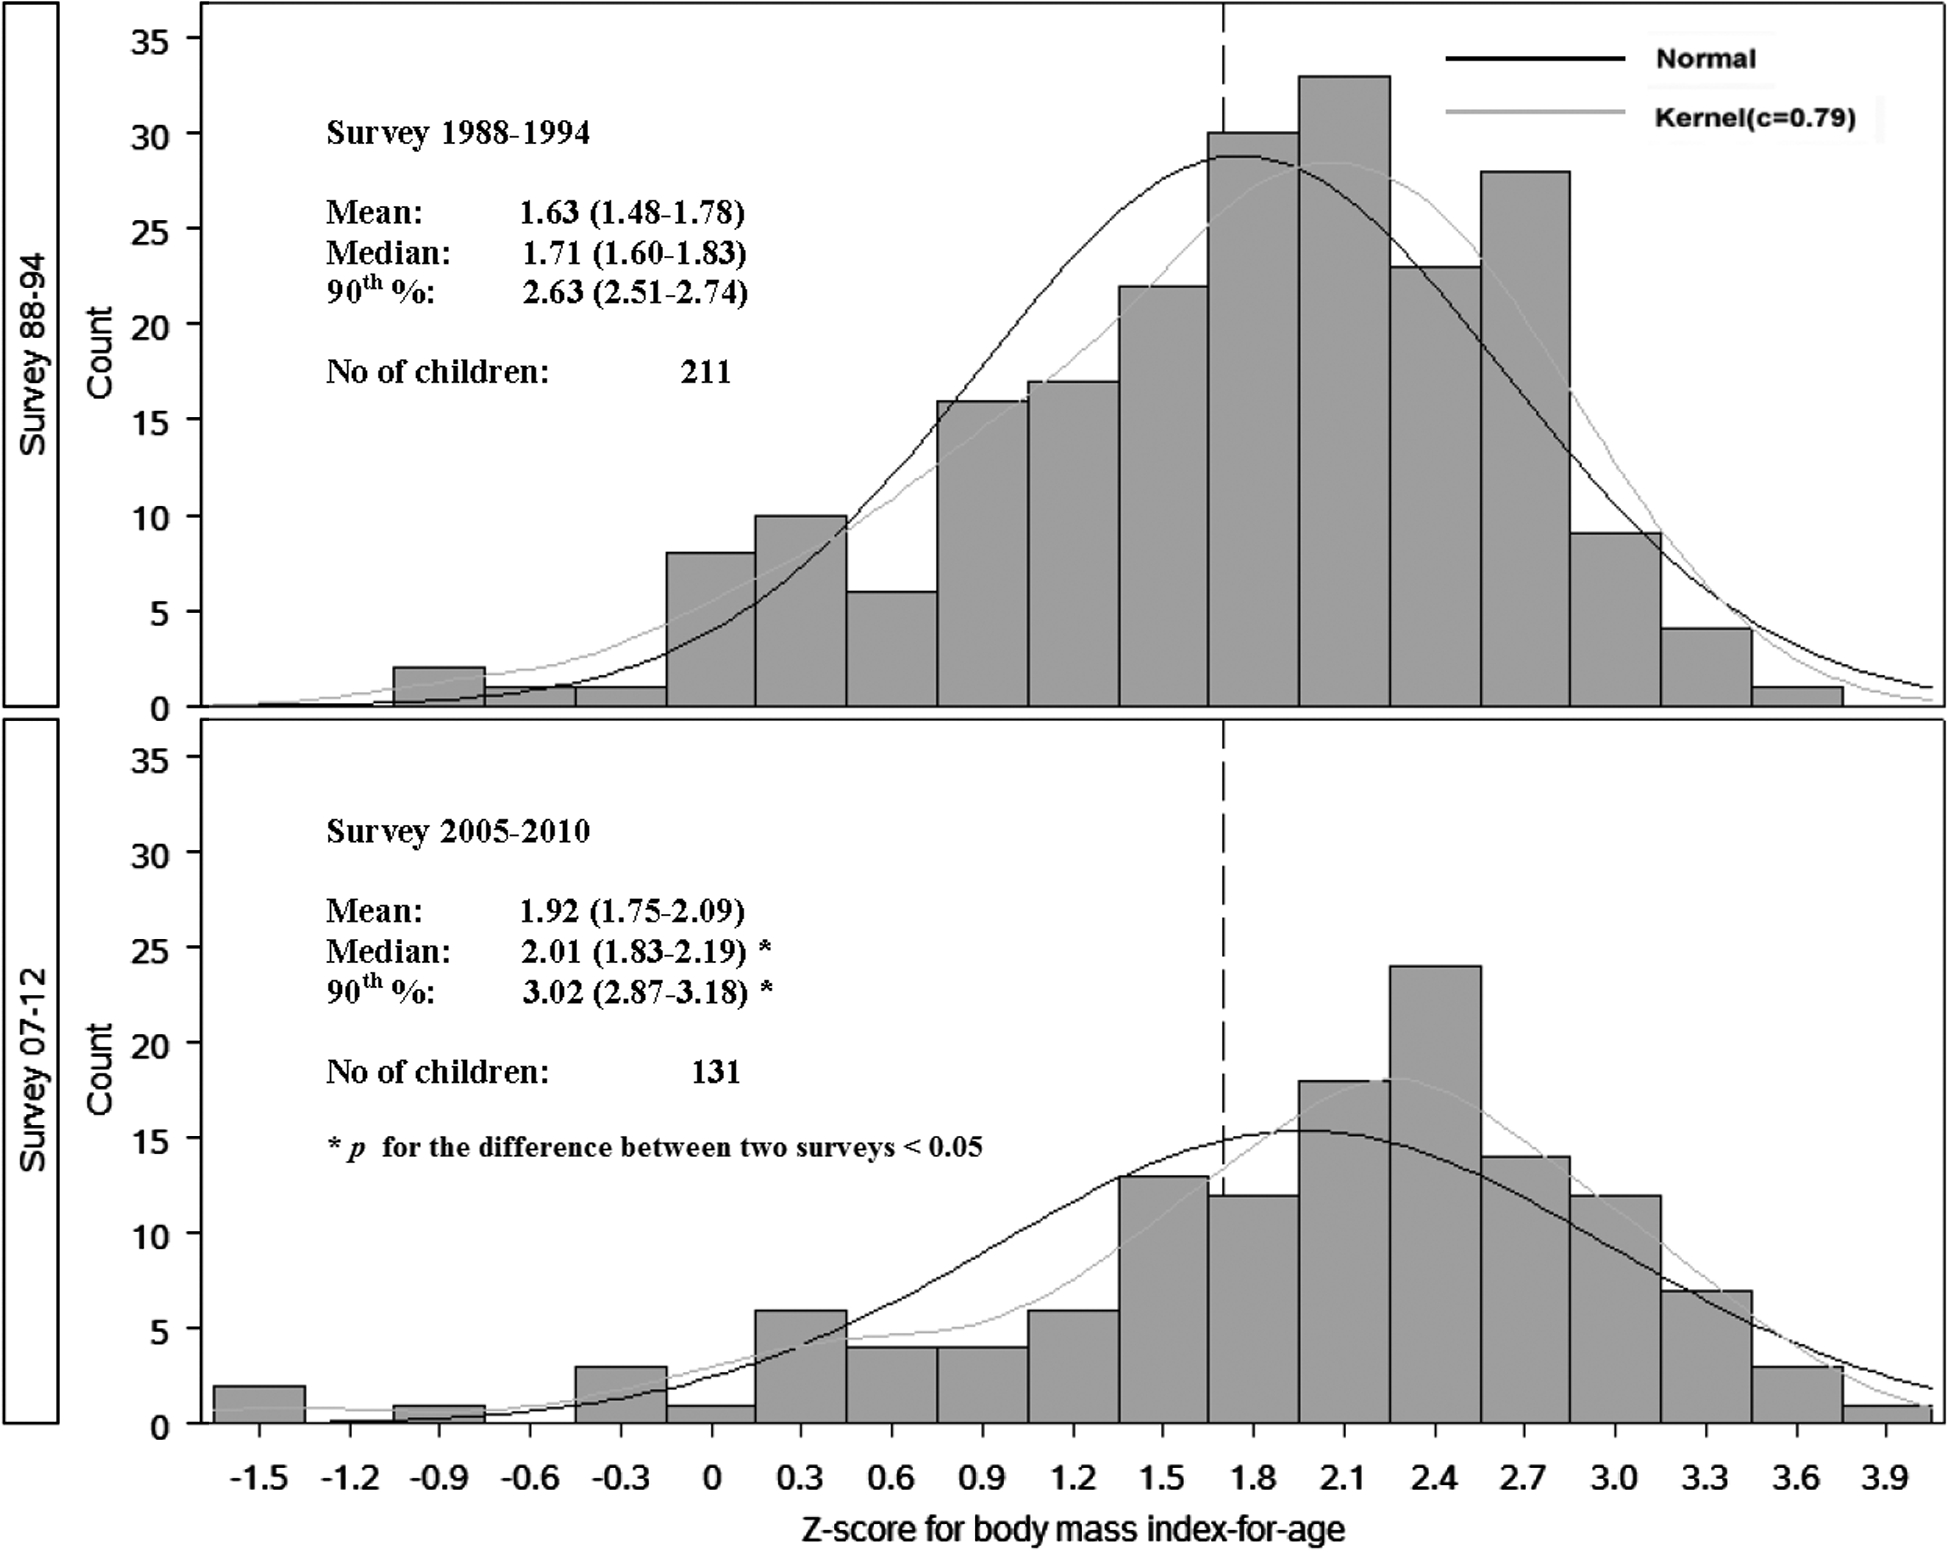
SAS software (version 9.3; SAS Institute Inc., Research Triangle Park, NC) was used to calculate weighted populations and related standard errors (SEs) for each sociodemographic stratum, with appropriate weighting and nesting variables (Table 1). Three steps were taken to complete the analyses. The first step was an assessment of parentally perceived and directly measured body weight status to identify any trends showing incongruence (Fig. 1). Normal weight, overweight, and obese children were included. The second step only included children who were perceived as overweight by parents. Distribution (i.e., means and medians) of age- and sex- standardized BMI z-score was calculated and compared. The goal was to examine any shift in BMI z-score distribution between early and recent surveys (Fig. 2). To determine in which population subgroup the most shifting occurred, mean BMI z-scores were assessed by sociodemographic stratum (Table 2). We conducted a third step using data from directly measured overweight children only because we recognized that an increase in the body weight of the child population may be the cause of shift in mean and median of z-scores. 20 Here, we controlled for the BMI z-score to evaluate the probability ratios (PRs; 2007–2012 over 1988–1994) of children with identical BMI z-scores and being perceived as overweight by parent (Fig. 3). PRs were used to evaluate the propensity of parents to perceive their directly measured overweight/obese child as overweight. Data from early and recent surveys were consolidated to create a dummy variable and compare parameters of the two surveys. We used modified Poisson's regression for multivariable adjustment. 28 Our primary rationale for using the modified Poisson's regression is that when it is applied to binomial data, the error for the estimated risk will be overestimated; however by modifying the Poisson's regression, we can rectify the problem. 29 Whenever appropriate, in the multivariable adjusted models, in addition to the dummy variable, we included child's BMI z-score, gender, race/ethnicity, age, and family income.
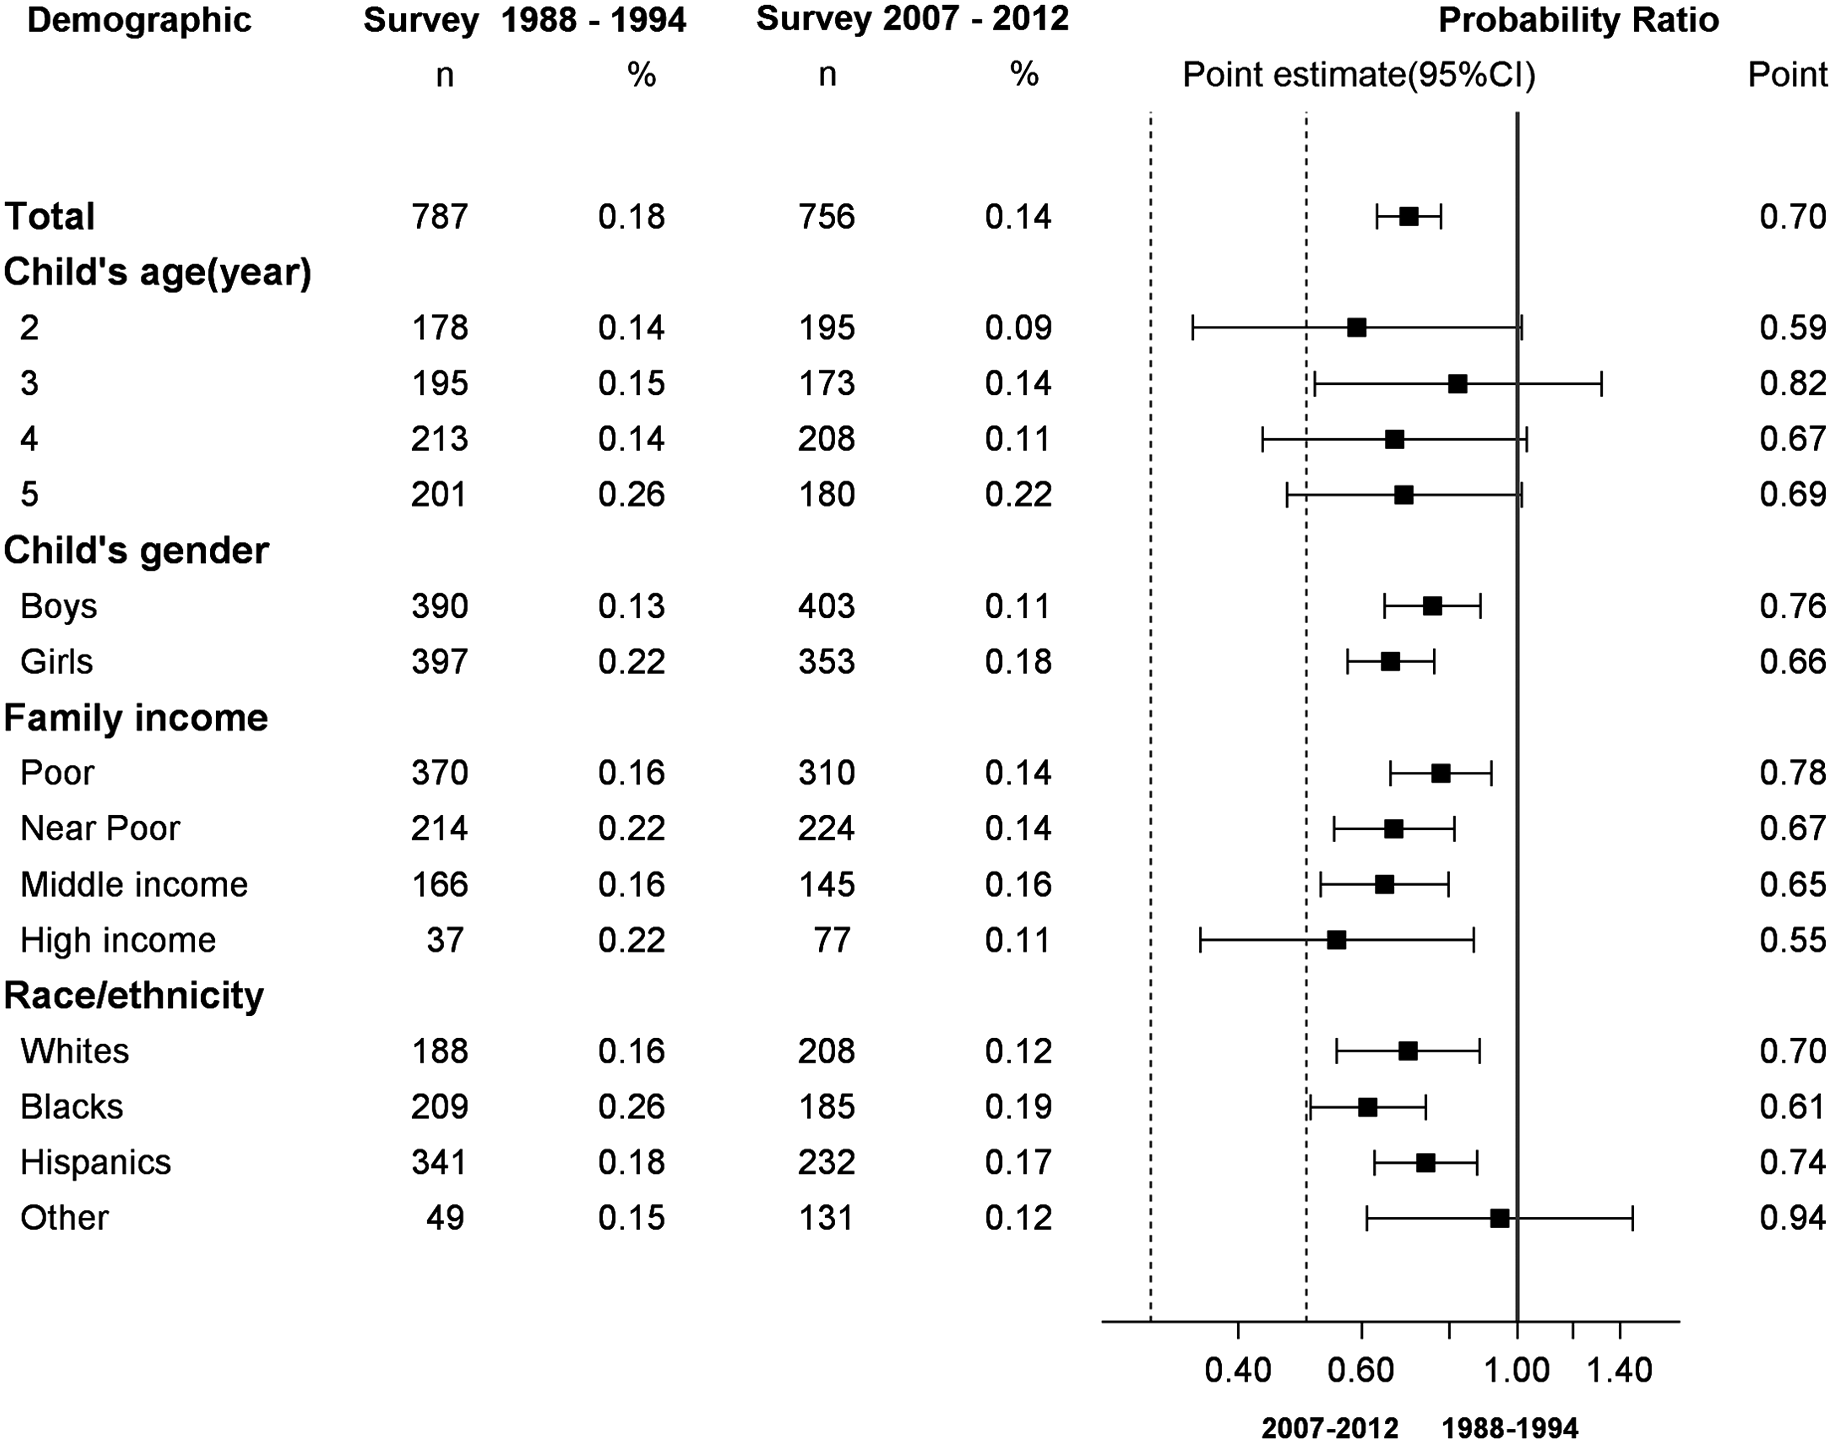
Probability of being parentally perceived as overweight. Sample of actual overweight/obese children ages 2–5 years; National Health and Nutrition Examination Survey 1988–1994 and 2007–2012. CI, confidence interval.
Selected Characteristics a of Weighted Study Population
Characteristics estimated from samples of children ages 2–6 years; NHANES 1988–1994 and 2007–2012.
Test for the difference of the variables (characteristics, listed in the first column of the table) between two NHANES survey periods, namely, 1988–1994 (early survey) and 2007–2012 (recent survey). p values were from t-tests (unequal variances) for continuous variables or chi-square tests for categorical variables.
Family income level was measured by a poverty index ratio (PIR), calculated by comparing the midpoint for the family income category and the family size with the federal poverty line. PIR values below 1.00 were categorized as below the official poverty threshold, 1≤PIR<2 was defined as near poor, 2≤PIR<4 defined as middle-income, and PIR≥4 as high income.
SE, standard error (of means or proportions); NHANES, National Health and Nutrition Examination Survey.
Medians of BMI z-Scores and BMI Percentiles a
Sample of overweight (parentally perceived) children ages 2–5 years; NHANES 1988–1994 and 2007–2012.1,2
Listed by sociodemographic stratum parentally described overweight adolescents, NHANES 1988–1994 (n=211) and 2007–2012 (n=131).
The Ns were presented as unweighted.
The BMI was calcuated using directly measured body weight and height. The percentiles, medians, and the corresponding 95% confidence intervals were calculated using SAS survey procedures with appropriate weighting and nesting variables.
Change of BMI z-score=Z-score of the recent survey (2007–2012) – Z-score of the early survey (1988–1994).
p<0.05. The statistical significance was roughly assessed by examining the 95% CIs. If 95% CIs overlapped between two survey periods, then p value for the difference was 0.05; otherwise, p<0.05;
The 95% CIs of medians were not determinable owing to small sample sizes.
Races/ethnicities other than whites, blacks, and Hispanics, particularly, non-Hispanic Asians, were oversampled in NHANES 2011–2012, but not in NHANES 1988–1994.
CI, confidence interval; NHANES, National Health Examination and Nutrition Survey.
Results
As nationally representative samples, study participants were evenly distributed between boys and girls for both early and recent survey (Table 1). Overall, children participating in the recent survey were significantly heavier than their counterparts in the early survey, mean BMI z-scores increased from 0.23 (SE, 0.02) to 0.37 (0.02; p<0.01), and a significantly lower percentage of children were categorized as normal weight in the recent survey (77.2[1.08]%) than in the early one (82.10[0.89]%). Hispanic population significantly increased from the early survey (9.39[0.78]%) to the recent one (15.4[1.52]%).
Figure 1 shows the mismatch between parent perceptions and child actual weight. Almost all parents perceived their overweight boys as “about the right weight” (Fig. 1, middle panel) in both the early (96.55 [95% confidence interval (CI)], 93.98, 99.12) and recent survey (94.87 [91.52, 98.22]). Parents with girls did only slightly better, with 87.80 (81.73, 93.87)% in the early survey and 93.12 (88.18, 98.07)% in the recent survey. More than three quarters of parents interviewed in the recent survey perceived their obese sons as “about the right weight” (top section of the right panel), and the percentage of obese girls parentally perceived as “about the right weight” reached 58.52 (46.05, 70.99)% in the early survey and increased to 67.86 (56.99, 78.74)% in the recent survey (bottom section of the right panel). Overall, the misperception was highly prevalent among parents; it was more prevalent in the recent survey compared with the early one. However, the changes were not statistically significant among either overweight or obese children.
Figure 2 shows the BMI z-score distributions among children perceived as overweight by parents (unweighted n=211 in the early survey and n=131 in the recent survey). Median BMI z-score for being parentally perceived as overweight significantly increased from 1.71 in the earlier survey to 2.01 in the recent survey (p<0.05). The BMI percentile corresponding to median BMI z-score for being parentally perceived as overweight in the early survey was 95.7th percentile, the rough cut point for obese class; the BMI percentile corresponding to median z-score for being parentally perceived as overweight in the recent survey increased to 97.8th percentile, the category of severe obesity. On average, in the early survey, an obese child was more likely to be perceived as overweight, and in the recent survey, a severely obese child was more likely to be perceived as overweight. Table 2 compares the medians of BMI z-scores and BMI percentile of the study population between two surveys by sociodemographic stratum. The largest increase (Δ Z-score=0.45) in BMI z-scores between surveys occurred among perceived overweight children from nearly poor families (from 1.63 [1.37, 1.90] to 2.08 [1.98, 2.18]; p<0.05), followed by middle income (1.69 [1.58, 1.80] to 2.02 [1.83, 2.21]; p<0.05).
A forest plot (Fig. 3) displays the adjusted PRs of being accurately perceived as overweight between the two surveys among actual overweight/obese children (unweighted n=787 for the early survey, the reference period; n=756 for the recent survey). Overall, after controlling for BMI z-scores, age, race/ethnicity, sex, and family income, overweight/obese children participating in the recent survey were 30% less likely to be correctly perceived as overweight (PR=0.70 [0.63, 0.78]) by their parents, compared to their counterparts from the early survey. Differences in the likelihood of appropriately being perceived as overweight between the two surveys were not statistically significant by age stratum. However, across the race/ethnicity strata, the declining tendency of parents to perceive an overweight/obese child as overweight was most pronounced among black children (PR=0.61 [0.51, 0.74]) and least among the other racial/ethnic group (PR=0.94 [0.61,1.46]). Both boys and girls in the recent survey were less likely to be correctly perceived as overweight (PR=0.76 [0.65, 0.89] and PR=0.66 [0.57, 0.76], respectively). The declining tendency of perceiving overweight/obese children as overweight among parents became more noticeable as family income increased.
Discussion
Consistent with other studies,7,14–19,30–32 in a nationally representative study of parents (mainly mothers), we found that a considerably high number of parents incorrectly perceived their overweight/obese preschool child as being “just about the right weight.” In addition, this misperception became more prevalent in the recent survey given that an estimated 30% reduction in correct perceptions was observed, compared to the early survey, after controlling for BMI z-scores. In the early survey, the majority of parentally perceived overweight children were overweight or obese, but in the recent survey, the majority of the parentally perceived overweight children were obese or severely obese. The declining tendency of parents to perceive an overweight/obese child as overweight was most pronounced among black children.
Synonymous with the increasing obesity rates, parents may be misperceiving their child's weight. Instead of using science-backed growth charts as the standard with which to compare their child, parents are possibly looking to peers as the standard. Social comparison theory suggests that individuals evaluate themselves in relation to others, rather than against an absolute scale.33,34 The parental misperception might be culture specific and varied across sociodemographic stratum. The declining tendency to appropriately perceive an overweight/obese child as overweight was most pronounced among black children, maybe because there are stark differences in childhood obesity, whereby black children have among the highest rate.35,36
In addition to social comparison theory, the ineffectiveness of communication between parents and the medical community might explain a substantial part of the misperception and the declining tendency to categorize their overweight/obese children as being just right. Few parents were able to understand the growth charts and implications the data presented. 37 The prevailing message to mothers of toddles and preschool children is to encourage growth. 15 A study showed that heaviness may be viewed as a reflection of inherited build or even as an indicator of good health. 38 Mothers may put greater emphasis on other factors, such as physical activity and social participation, and believe that overweight is a condition that will be outgrown. In general, assessing body weight or composition without objective measurements is difficult, especially in an age group continuously experiencing body composition and size changes. Previous research conducted among low-income mothers (who incorrectly perceived their overweight preschool children as “about the right weight”) showed that these mothers expressed a distrust of growth charts, 39 as well as suggesting that the charts are ethnically biased, making them invalid.39,40
It is also important to note that the definition of overweight may be confusing to parents because it has shifted over time and is different among various health professional organizations. 41 For example, it was recommended that children with a BMI ≥95th percentile based on the CDC 2000 Growth Chart for age and gender should be considered overweight by the Expert Committee on Clinical Guidelines for Overweight in Adolescent Preventive Services in 1994. 42 On the other hand, in an effort to convey the urgency of childhood obesity, the IOM, in 2005, defined children with a BMI of ≥95th percentile for age and gender as obese. 27 These changes occurred between the two surveys used by the present study. It is also likely that parents may not fully recognize their child's weight status unless it reaches the obese level. 43 In addition, parents might be unwilling to label their child as overweight owing to societal pressures of maintaining a lower weight and/or the stigma often attached to obesity.
Preschool children have limited control on their obesogenic behaviors (such as availability of unhealthy foods), which, to a large extent, reflect the habits of the whole family, in particular, parenting style of mothers or other caregivers. 44 As previously stated, parental recognition of their child's overweight status is paramount in childhood obesity prevention efforts. Such recognition of their child's overweight status and of the associated health risks with their child being overweight are driving forces motivating parents to act. 31 Previous research has shown that parents with accurate perceptions have a greater readiness to make weight-related changes in health-related behaviors and are more effective in doing so. 45
The current study has important strengths. This is the first study, to our knowledge, to evaluate generational shifting of weight-related social norms of preschool-aged children from a parental perspective and we use multiethnic nationally representative data with consistently high response rates (>85%). 46 Observations from different survey years are instructive for overall trends, notwithstanding its cross-sectional nature. However, we recognize that more than two cross-sections may be appropriate to evaluate dynamic patterns of perceptions of social norms in a timeframe longer than used in the current study. This study is subject to other noteworthy limitations. A small number of parentally perceived overweight children made the conclusion less sociodemographically specific. Given that mothers (compared to fathers and other family members) take the majority of the responsibility for shopping and preparing food, as well as have a stronger influence on a child's general lifestyle, 47 it may be most informative to evaluate the maternal perspective of children's weight. However, it was not possible to concentrate on maternal perception owing to the fact that proxy-child relationship data were not available for the recent survey. Sample sizes would be further reduced for some sociodemographic stratum if nonmaternal proxies were excluded. In addition, we recognize that parents may not report their true perceptions of child's weight given that they feel they may be identified “as bad parents” or “at fault.” That is, parental perceptions of a child's weight status may not in be the parent's true perception. Further, residual confounding is a potential limitation.
Conclusions
Providing early opportunities for preventative and treatment interventions among children at risk for overweight and obesity has been recommended as the propriety for childhood obesity prevention. Given their personal interaction with parents and children on a recurrent basis and the trust parents place in their family physicians, pediatricians and other healthcare providers are ideally situated to promote and encourage healthy weight perceptions and parental awareness of their child's weight status. Expert panel guidelines advocating for screening for childhood overweight, through the clinician's office and clinician-family discussion, have been published as early as 1998. 48 Additionally, persistent efforts have been made by various professional organizations to promote early identification of childhood obesity and elevate parental awareness of adverse effects of obesity in children.49–53 In addition, there have been various childhood obesity prevention and intervention initiatives that have occurred between 1988–1994 and 2007–2012 that can, in part, account for the decline in correct perception—including First Lady Michelle Obama's recent Let's Move! Campaign, announced on February 9, 2010. Taken together with others,51,54 the current study implicates that the opportunity has not yet been fully utilized and pediatrician's commitment may need revitalizing. Substantial gaps in the US medical system exist to participate meaningfully in childhood obesity prevention efforts. 55 Strategies are needed to explore how to encourage clinician discussions with parents about appropriate weight for their child and strengthen capacity for childhood obesity prevention. 55
Footnotes
Acknowledgments
The authors thank James Williams for commenting on an early version of the manuscript. The authors gratefully acknowledge the efforts of Shilpa Dutta, Kenneth Pass, James Williams, and William Goedel for their assistance with the preparation of the manuscript.
Author Disclosure Statement
No competing financial interests exist.