




Abstract
Abstract
Background:
Schools play a role in addressing childhood obesity by implementing healthy eating and physical activity strategies. The primary aim of this case study was to describe prevalence of overweight and obesity among elementary school students in a rural Mid-western community between 2006 and 2012. The secondary aim was to use a novel approach called “population dose” to retrospectively evaluate the impact dose of each strategy implemented and its estimated potential population level impact on changes in overweight and obesity.
Methods:
Weight and height were directly measured annually beginning in January 2006 to assess weight status, using BMI (kg/m2), for all kindergarten to fifth-grade students (N ≈ 2400 per year). Multiple evidence-based strategies were implemented in nine schools to increase physical activity and healthy eating behaviors. BMI reporting and revised school meal programs were implemented districtwide. Comprehensive school physical activity programs, school food environment, and supportive/promotional strategies were implemented at individual schools.
Results:
The absolute change in prevalence of obesity (BMI ≥95th percentile) decreased from 16.4% to 13.9%, indicating a 15.2% relative change in prevalence of obesity in 6 years. There was an inverse relationship between the number of strategies implemented and prevalence of overweight and obesity over time.
Conclusions:
District and school-level approaches have the potential to impact childhood obesity. Schools can successfully implement strategies to address overweight and obesity, but the extent of implementation between schools may vary. Population dose analysis can be used to estimate impact of clusters of strategies to address overweight/obesity.
Introduction
One third (34.2%) of children ages 6–11 years are overweight or obese, 1 and childhood obesity continues to be a major focus of public health efforts in the United States. 2 Childhood obesity is associated with risks for developing conditions such as hyperlipidemia, hypertension, and type 2 diabetes,3–5 as well as social and emotional health challenges, including being bullied,6,7 poor self-esteem, and depression. 8 Good health and social outcomes are important goals for school health policy and program efforts, 9 and a socioecological approach should be employed for achieving positive health and social outcomes in schools. 10 Schools can play a vital role in addressing childhood obesity through the coordination of strategic planning, implementation, and evaluation of school-based healthy eating and physical activity (PA) policies and practices. 11
The CDC has synthesized research and best practices related to promoting healthy eating and PA in schools, providing nine guidelines with multiple strategies for implementation. 11 Although it is unknown how many strategies are needed to achieve health outcomes, it is widely accepted that there should be multiple strategies implemented at multiple socioecological levels to increase PA and healthy eating as well as reduce obesity.12–14 A recent review of evaluated obesity prevention studies and their impact on BMI found strong evidence to support the efficacy of school-based prevention programs, particularly for elementary school-aged children. 15 Recommendations from the review suggest that future studies should be designed to evaluate both impact (reduction in obesity) and process (implementation). 15
It has been suggested that future research should have more practical utility for decision makers and be broadened to enhance usability in the “real world.”12,16 A challenge to researchers implementing multistrategy obesity prevention interventions is how best to compare and determine the overall impact of diverse intervention strategies using a common metric. The Center for Community Health and Evaluation (CCHE) 17 has proposed an approach to estimate the impact of multistrategy interventions on an average person's behavior—in other words, the relative change in behavior across both those who have been exposed to an intervention strategy and those who have not been exposed. CCHE refers to this estimated impact as dose. Dose is a product of the intervention's reach and strength (a quantitative measure of impact based on frequency, intensity, and outcomes from the literature).
The primary aim of this case study was to describe the prevalence of overweight and obesity among elementary school students in a rural Midwestern community between 2006 and 2012. The secondary aim was to use a novel approach called population dose to retrospectively evaluate the impact dose of each strategy implemented and its estimated potential population-level impact on changes in overweight and obesity.
Methods
Study Population
Kearney Public School (KPS) District is located in Kearney, Nebraska, a Midwestern community of approximately 30,000 people. Between 2006 and 2012, approximately 2400 elementary students were enrolled each year in grades kindergarten through fifth in nine schools. Five of the nine schools had over 40% of students receiving free or reduced federal meals, the threshold for Title I designation, 18 and the district was primarily Caucasian (85%).
Intervention Strategies
A chronological view and description of the strategies included in this case study can be found in Table 1. KPS implemented the following strategies districtwide: BMI screening and referral program; local school wellness policy; the Carol M. White Physical Education Program grant (PEP grant no. Q215F080323); district wellness team; healthier school meal program; and a new physical education (PE) curriculum. In addition to implementing the district-wide strategies, each of the nine individual schools implemented, to varying degrees, a comprehensive school physical activity program (CSPAP) and healthier school food environment strategies. Supportive and promotional education strategies, including the implementation of the wellness policy, formation of wellness teams, school to family education programs, educational presentations to school staff, and data evaluation by administrators and teachers, were implemented to build capacity in support of PA and healthy eating–related strategies. All strategies were not implemented simultaneously, but were phased in over the 6 years. KPS provided existing aggregate data for this study, and the use of these data was approved by the University of Nebraska at Kearney Institutional Review Board.
Overview of District-Wide and Individual School Strategies Implemented in Kearney Public Schools (KPS) between 2006 and 2012
Strategies were implemented during the academic semester indicated in the timeline and continued through the 2012 academic year.
PEP, Physical Education Program; PE, physical education.
Body mass index screening and referral program
KPS has been measuring each student's (kindergarten to fifth grade) weight and height annually since 2006 as part of yearly health screenings completed by the school nurses and trained university volunteers. Individual student data were not followed over time; this was a series of seven annual, cross-sectional screenings from 2006 to 2012. Weight was measured using a Befour platform digital scale (PS6600; Befour Inc., Saukville, WI) to the nearest 0.1 pounds. Height was assessed using a standard portable stadiometer, measured to the nearest 0.25 inch. Both instruments were calibrated routinely. Both weight and height were measured without shoes and in normal street clothes without jackets and sweatshirts. These data were then entered into a BMI Web application developed at the University of Nebraska Kearney. Each student's BMI (kg/m2) was calculated and percentile determined using the sex-specific BMI-for-age percentiles from the CDC 2000 Growth Charts. The accepted definition for normal weight was defined as a BMI percentile between the 5th and 84.9th percentile, overweight was defined as 85th–94.9th percentile, and obesity defined as equal or greater to the 95th percentile. 19 Each year, parents received a BMI report card describing their child's BMI. Students identified as obese were referred to a community-based child obesity treatment program. 20
Evaluation Procedures
Because there was variability in both district-wide and individual school strategy implementation and subsequent exposure among schools, we calculated dose using an approach developed by the CCHE 17 with evidence for predictive validity. 21 Dose was retrospectively calculated for four independent strategy groupings (set of coordinated activities 21 ): (1) CSPAP, which included both quality PE and PA opportunities outside of PE (e.g., recess, classroom PA breaks, and afterschool programs); (2) school food environment, which included all food in school outside of the meal program, such as classroom food rewards, classroom parties, and fundraisers; (3) BMI screening, reporting, and community obesity treatment program; and (4) school meal program.
The CCHE defines dose as an estimate of community-level change in the expected desirable outcome as a result of a community change strategy or strategies. 21 We used implementation data regarding frequency, duration, magnitude of changes, and evidence from the literature to estimate behavior change and their estimated impact on BMI change. Behavioral outcomes of interest were increasing PA, decreasing unhealthy/high calorie foods, and increasing healthy food consumption. The dose of each strategy is the product of reach and strength of the strategy.
Reach calculation
Reach was equal to the percentage of students enrolled in KPS grades K–5 who were exposed to a strategy (number of students exposed [participated] / number enrolled in each school). Reach was calculated for each individual school (n = 9). For example, if 50 students in a school with 150 enrollment participated in the lunchtime walking program, then reach of that strategy would be 33%.
Strength calculation
Strength is equal to the degree to which students exposed to a strategy might change their healthy eating and/or PA behaviors to make healthier choices as a result of being exposed. Frequency of exposure, intensity of exposure, degree to which the healthy choice is the only choice, and supporting promotional and educational strategies are all factors that can be used to determine strength. 17
Strength scores were based on empirical evidence collected and analyzed by the CCHE. 17 CCHE calculated strength scores in a blinded manner, only reviewing implementation data for each strategy without knowing the BMI trends over time, to help ensure an unbiased analysis. Strength was calculated for each individual school (n = 9). For example, if a new PE curriculum was implemented in a school and it increased moderate-to-vigorous physical activity (MVPA) minutes from 10 to 12 minutes every day, then the strength of that strategy would be 1.1%. In the absence of baseline data, we use CDC estimates of PA that state that elementary school-aged children get an average of 85 minutes of MVPA per day. 22 If we increase activity by 2 minutes to baseline on 5 of 7 days a week, during 8 months a year that school is in session we get 1.1% change in PA overall.
Statistical Analysis
Absolute and relative change in percent of children whose BMI percentile was between the 85th and 94th percentile (overweight) and equal to or greater than the 95th percentile (obese) were calculated between 2006 and 2012. Each year, a census was collected from all students in grades K–5.
The number of district-level strategies were described each year between 2006 and 2012 in an additive format and graphed. A dose score was calculated at the end for individual school strategies based on level of implementation (reach × strength), as described above.
Results
Ninety-seven percent of the total student body was screened for height and weight each year, with minimal fluctuation in percent of students receiving free and reduced lunch (7.1%) and a 9.75% mobility rate within the elementary schools (Table 2). Therefore, the change in the prevalence of overweight and obesity reflects the actual difference in the population. Figure 1 shows the percent of overweight and obese students attending KPS elementary schools annually from 2006 to 2012. The absolute change in prevalence of obesity decreased 2.5%, from 16.4% to 13.9%, indicating a 15.2% relative change in prevalence of obesity in 6 years. The prevalence of overweight decreased from 15.5% in 2006 to 14.3% in 2012, indicating a relative percent change of 7.6%. The prevalence of overweight and obesity combined from 2006 to 2012 decreased by 3.7% (31.9% to 28.2%, an 11.6% relative decrease). However, there was a wide range within schools of BMI trends over time, with a range of overweight and obesity change from a 10% increase in school A to a 12% decrease in school F. Figure 2 illustrates the number of annual district-wide strategies implemented from 2006 to 2012 and the corresponding annual district-wide prevalence of overweight and obesity (≥85th percentile for BMI).

Prevalence of overweight and obese students attending elementary school between 2006 and 2012, Kearney, Nebraska.
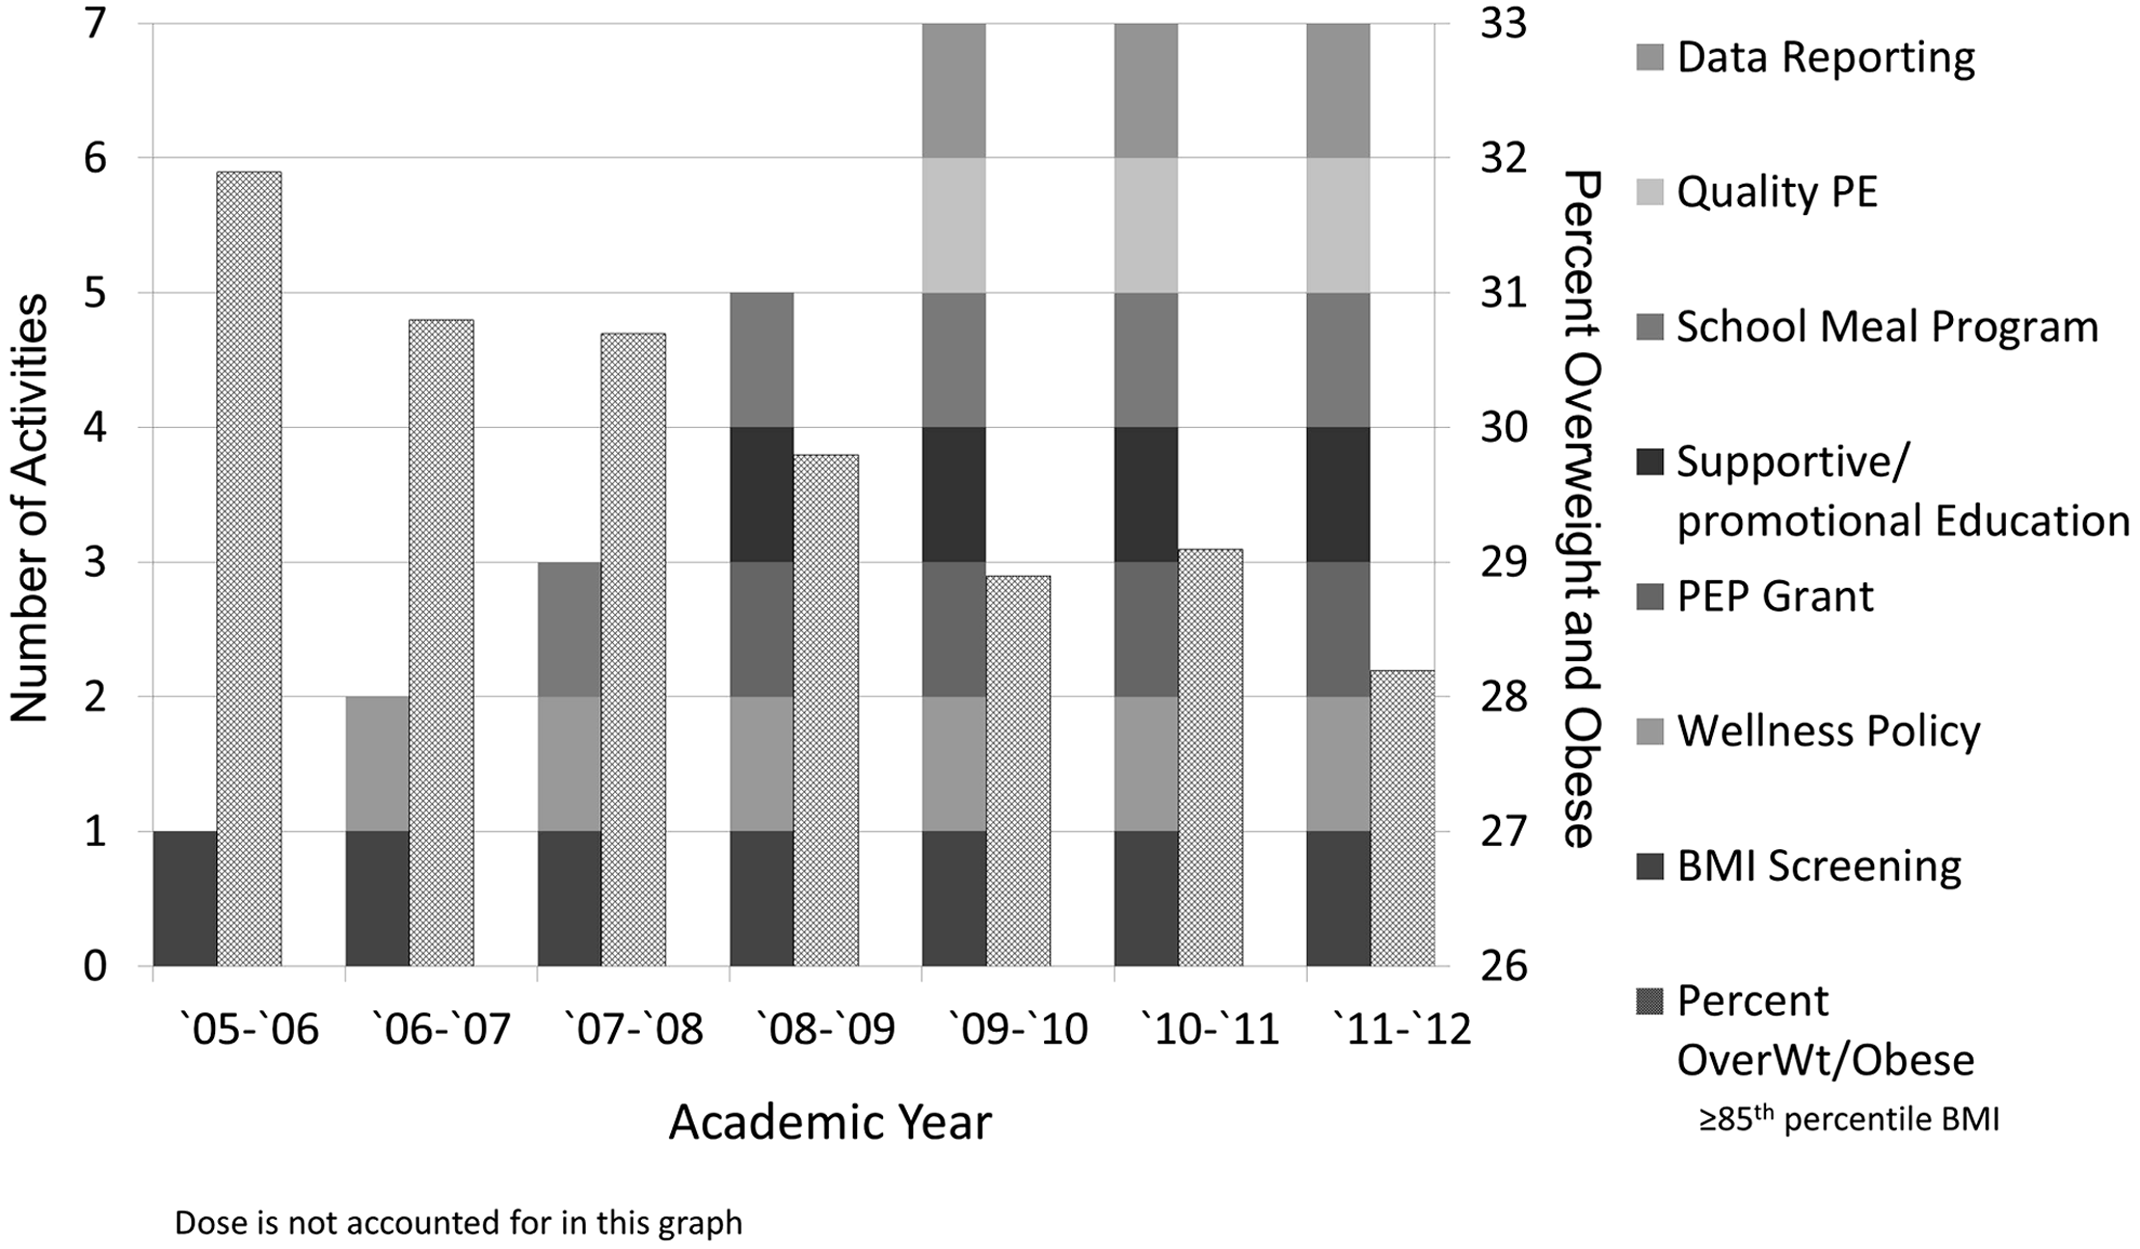
Number of district-wide obesity prevention activities from 2005 to 2012 and corresponding prevalence of overweight and obesity, Kearney, Nebraska.
Individual School Demographic Characteristics by Year
n, school enrollment;
FRL, percent of students receiving free or reduced lunch;
N/A, mobility rates were not available.
Table 3 provides a detailed schematic of how dose scores were calculated for each strategy based on estimated strength and reach within each school. The highest dose scores calculated were for CSPAP (5.6–9.7%), owing to the relatively high reach and strength of the strategies. The BMI screening, reporting, and obesity treatment program had the lowest dose (0.6–1.6%), owing to the low reach of the treatment program, even though the strength was very high for those who participated in the intensive obesity reduction classes.
Calculation of Dose Scores Including Strength Categories for Each Strategy Implemented, Factors Influencing Strength Ratings, Estimated Reach, and Dose Ranges
Dose was calculated for each individual school by multiplying reach × strength. The classification of strength is based on criteria adopted by the Center for Community Health and Evaluation “Measuring and Increasing the ‘Dose’ of Community Health Interventions” (www.cche.org, September 2014).
Figure 3 represents the dose for each strategy implemented at the individual school level from 2006 to 2012. As shown in Table 2, dose scores were calculated over the 6 years with frequency and duration impacting strength scores. Schools that showed absolute decreases in overweight and obesity prevalence of greater than 10% are noted in Figure 3.
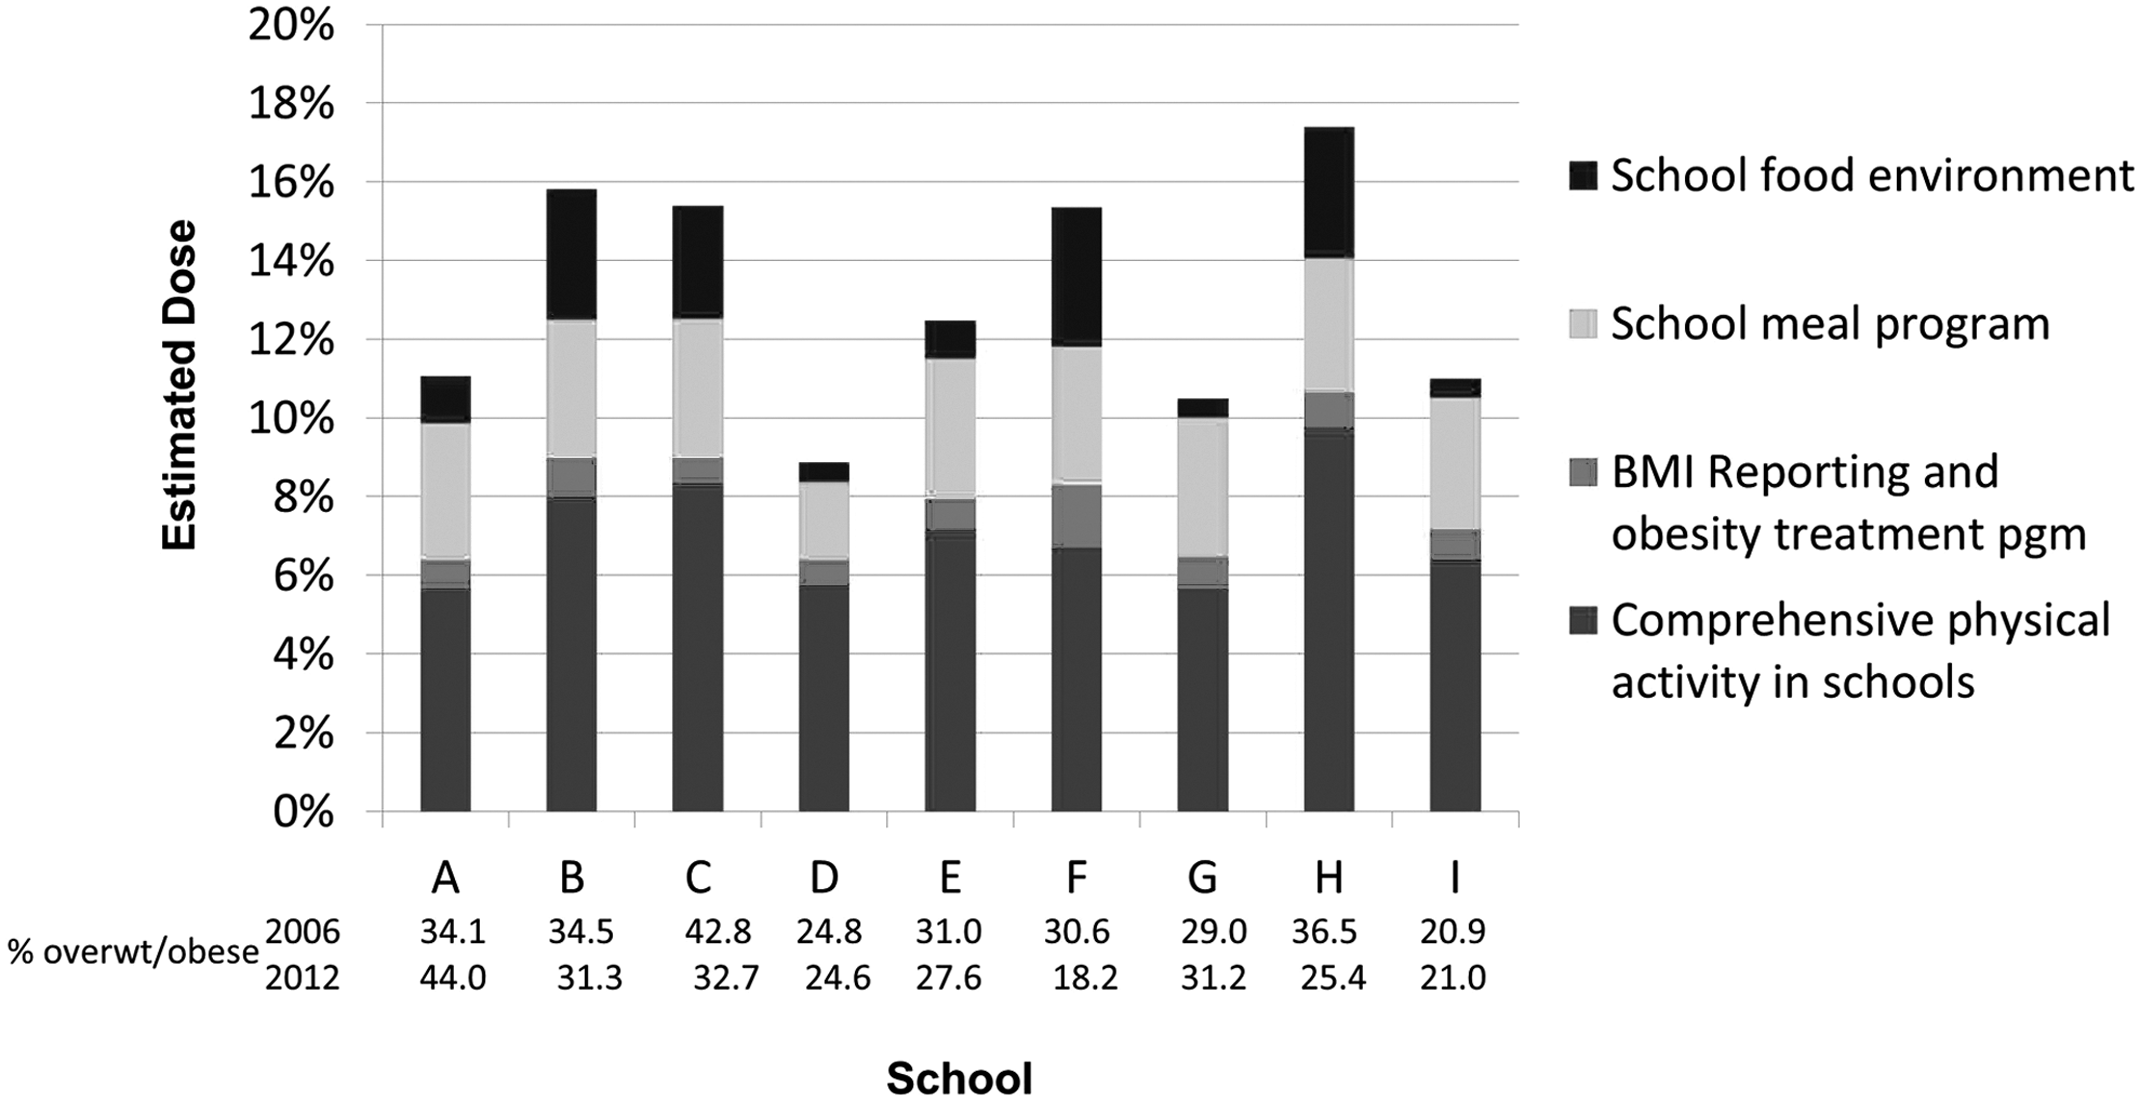
Dose (estimated impact) for each strategy implemented at the individual school level with overweight and obesity prevalence from 2006 to 2012.
Discussion
This retrospective case study revealed a 2.5% absolute decrease in obesity from 16.4% in 2006 to 13.9% in 2012, a 15.2% relative change. The prevalence of overweight and obesity combined decreased from 31.9% in 2006 to 28.2% in 2012, an 11.6% relative change. Although these changes only reflect one school district, they are in contrast to the National Health and Nutrition Examination Survey national data that documented a 2.6% absolute increase in obesity prevalence between 2006 and 2012 among 6- to 11-year-old children (15.1% [11.3–20.1] in 2005–2006 to 17.7% [14.5–21.4] in 2011–2012; P > 0.05). 1 It is also worth noting that there was a wide range within schools, with some schools showing as much as a 12% reduction in overweight/obese and other schools showing as much as a 10% increase in overweight/obese over this same time period.
The overall reduction of overweight and obesity prevalence from 2006 to 2012 may have been the result of several strategies being implemented across KPS. Establishing causality is difficult using a retrospective study design 23 and was not an aim of this study. Some strategies were districtwide and potentially reached all students, whereas other strategies were implemented at the school level to varying degrees. The five school-level strategies included CSPAP, school food environment, BMI reporting and obesity treatment program, school meal program, and supportive/promotional education programs. These strategies are identified in the literature to have potential impact on obesity, PA, or nutrition and represent a socioecological approach to obesity prevention.11,13,14,20,24–28 Multifaceted school-based programs for 6- to 11-year-olds that include both nutrition and PA components have been found to both improve health and be cost saving. 12 The current retrospective case study describes efforts to reduce obesity and would be considered a more natural intervention compared to past studies that were more controlled intervention studies. Each strategy was evaluated at the individual school level, which allowed us to differentiate between the schools.
The dose scores derived in this study are based on all enrolled students at each elementary school in KPS, even those who were not exposed to all strategies. 17 According to the CCHE, 17 cumulative dose scores for each school suggest that for all elementary students enrolled, there was an estimated 8.9–17.4% change in healthy eating and or PA behaviors. 17 These estimates are not meant to be taken literally, but rather indicated to us that significant, measurable changes in behaviors that impact BMI were occurring in these schools. It is generally accepted that the main cause of obesity is due to imbalance between energy intake and energy expenditure. We would therefore expect that, collectively, the strategies implemented throughout KPS that had the most impact on nutrition and PA behaviors to show greater reduction in overweight/obesity, and this inverse relationship is, in fact, what we found.
The greatest reductions in overweight/obesity prevalence occurred in schools F, H, and C (Fig. 3). Dose scores for these schools were also higher, ranking fourth, first, and second of nine and ranging from 12.8% to 17.4%. Comparatively, schools A, D, G, and I, with the least change in BMI or who showed increases, were ranked lowest in terms of dose scores (8.9–11.1%). One of the greater discrepancies in dose between school G and schools F, H, or C include the participation rate in the obesity treatment program. School G had the highest school enrollment among all schools and, given their overweight/obesity rate, translates into approximately 120 overweight/obese students, of which only 9.0%, or approximately 11 students, participated. Comparatively, school F had an average attendance of 290 students, a similar baseline overweight/obesity rate (30.6% to school G [29.0%]), and 34% of students participated in the obesity treatment program. This would equate to approximately 30 students who participated in the obesity treatment program, nearly 3 times that of school G.
Interestingly, school C only reported 4.0% of obese students participating in the obesity treatment program, but it also had the highest overall dose score and the highest baseline overweight/obesity rate (42.8%). These findings suggest that it may be important to implement strategies at the primary (e.g., School Food Environment), secondary (e.g., BMI screening program), and tertiary (e.g., obesity treatment program) levels of prevention. This hypothesis can be tested in future studies. Parents have reported supporting the BMI screening program in KPS (Heelan and colleagues, unpublished), and the family-based pediatric obesity treatment program has demonstrated efficacy. 20 Though we cannot pinpoint exact commonalities between schools with the greatest reduction in obesity, it does appear that having a high dose cluster of strategies, regardless of their makeup, is a common factor. The use of a retrospective study has certainly provided data to generate hypotheses for future research. 23
The adoption and implementation of district and school-level strategies were not uniform across schools. The district-level wellness policy was important for identifying specific PA and nutrition strategies that schools should implement. It was difficult to get individual school administrators to agree to make significant changes within their schools until they were presented with the district-wide and individual school overweight and obesity prevalence data in December 2009. The data demonstrated to school principals the importance of PA and healthy eating.
The discrepancy between schools in degree of implementation may be the result of differences in funding, teacher-student ratio, general infrastructure, and capacity for implementing the process of health promotion in schools using a socioecological approach. 10 Any combination of these factors could lead to natural variation in the timing of adoption and degree of implementation of strategies. 29 For example, all elementary schools changed their policies on classroom parties, snacks in the classroom, and food rewards. However, level of implementation varied considerably given that one school prohibited all food outside of school meals whereas other schools required, to varying degrees, only healthy food brought into the school for snacks and fundraisers.
The findings of this retrospective case study are not generalizable to other school districts. Conversely, an advantage of retrospective case studies include the opportunity to study rare occurrences, 23 in this case a school district whose prevalence of obesity decreased during the same period when obesity remained level nationally. 1 Additionally, this type of study can act as a good pilot study to help identify feasibility issues and generate hypotheses for future studies. 23 As a result of this case study, valuable insights into interpreting the differences in implementation of several strategies across a school district were gleaned. Calculating dose could allow stakeholders to better comprehend the differences in implementation between schools and how each strategy could impact obesity prevalence, even in situations where yearly BMI measurements are not feasible. Community stakeholders can work together to determine the feasibility issues surrounding sustained measurement and reporting of strategy implementation.
The study has several limitations. First, the study did not evaluate changes in environments outside of the school setting, such as the home or the community, that may have also influenced a child's weight status over time. Changes in these environments may have also contributed to observed changes in obesity status. Second, whereas strategy exposure and participation data were collected throughout the years of the study, dose was assessed at the end of the study period and reflects an estimation of implementation at the end of the 6 years of the evaluation.
Finally, a quantitative number was assigned to categorize the oftentimes qualitative implementation data for a given strategy. However, the calculated dose scores do allow for relative comparisons of strategy implementation between schools. The dose score has been helpful to visualize that a district-wide policy or strategy does not necessarily suggest that all strategies will be uniformly implemented. Future research should test approaches for implementing district policies at the school level and their relationship to health-related outcomes. Future research should also continue to focus on developing data collection methods that are user-friendly to practitioners who are conducting noncontrolled studies in the area of obesity prevention, as well as evaluating the validity of the method employed for this study.
Conclusions
This unique retrospective case study has revealed success at implementing school-based obesity prevention strategies. Dose data support that school-based obesity prevention strategies may have contributed to decreases in the prevalence of overweight and obesity. In addition to district-wide policies, individual schools should evaluate their ability to adopt environmental, policy, or programmatic changes that meet their school's needs and resources. The evaluation approach used for this study allows decision makers to compare the impact of differentially implemented school-based strategies.
Footnotes
Acknowledgments
Funding was provided by a Carol M. White Physical Education Program Grant (no. Q215F080323). The authors acknowledge Carol Renner, Associate Superintendent, and Cari Franzen, Wellness Coordinator, and the students, staff, and administration of Kearney Public Schools, Kearney, Nebraska. The authors also acknowledge Elena Kuo, Evaluation Consultant for the CCHE, for her assistance with using the CCHE approach to measuring population dose. The findings and conclusions in this report are those of the authors and do not necessarily represent the official position of the CDC.
Author Disclosure Statement
No competing financial interests exist