
Abstract
Abstract
Background:
To further understand the psychometric properties of the Sizing Me Up—a newly developed quality of life (QoL) instrument related to weight status. We extended the target population to a community sample, including obese, overweight, normal-weight, and underweight children.
Methods:
Based on the data of 497 students in third to sixth grades, we used the following approaches: analysis of variance to detect the QoL scores among groups; confirmatory factor analysis (CFA) to examine the original structure; and Rasch analysis to test the misfit items, disordered response descriptors, and differential item functioning (DIF) items.
Results:
Obese children had the lowest QoL total score; overweight children had lower QoL total score than normal-weight children; and underweight children had lower QoL in social avoidance than normal-weight children (all p < 0.01). CFA suggested that the factor structure is acceptable. Rasch corroborated that there were no misfit items; however, 10 items showed disordered thresholds in response descriptors and 6 items displayed significant DIF.
Conclusions:
Sizing Me Up can be applied to underweight children in the community and it can yield valid and reliable scores. Future studies are needed to explore the issues of disordered response descriptors and DIF items. Additional revisions for the Sizing Me Up may be warranted.
Introduction
Childhood obesity is a rising global public health problem of increased significance since 1990s, especially in high-income countries.1,2 While ∼11.7% of children in developed countries suffered from overweight and obesity in 2010, the problems are projected to increase to ∼14.1% by as quickly as 2020. 1 This increase in global trends of childhood obesity may result in long-term adverse health outcomes, such as cardiovascular disease and diabetes. 2
In response to the childhood obesity crisis, researchers have started investigating the quality of life (QoL) for obese and overweight children,3,4 and impaired QoL has been found in clinical samples across countries.5–7 These studies, however, used a generic QoL instrument such as PedsQL to assess the QoL for obese or overweight children, and possible biases may have occurred: an obese child may rate a low QoL because of problems not related to body weight (e.g., chronic disease such as type I diabetes, acute symptoms such as stomach ache). 8 Therefore, using a weight-related QoL instrument can help healthcare providers better understand the impact of obese/overweight on children's QoL.
Sizing Me Up, developed in 2009, is a 22-item instrument designed for measuring children's weight-related QoL. 9 Sizing Me Up has been validated among two samples in the United States: obese children aged 5–13 years seeking treatment and being referred by physicians in a hospital-based pediatric weight management program 9 and a community sample comprising fourth and fifth graders. 10 Based on the concepts of classical test theory (CTT), Zellar and Modi 9 demonstrated sound psychometric properties of Sizing Me Up; Cushing and Steele 10 further used confirmatory factor analysis (CFA) to verify its structure.
The psychometrics of Sizing Me Up, however, can still be further evaluated, considering some limitations from the previous two studies.9,10 First, this instrument has only been tested using a sample of children within a relatively small age range (fourth to fifth graders) in a community. 10 Although Zellar and Modi 9 recruited children 5–13 years of age, they used a clinical sample and their results may not be generalizable to a community.
Second, considering that obesity is a global trend and that those individuals may encounter different obesity-related life difficulties in various countries and social contexts, this measure requires cross-cultural validation. The impact of obesity on children's QoL can be largely influenced by the cultural norm. In cultures that considered obesity is an individual's responsibility and thinness is highly associated with beauty, the cultural environment might foster stigma against obese children and result in poor QoL for them. 11
Third, other psychometric properties, such as response ordering (i.e., the difficulty across the item response scale) and unidimensionality in a Rasch model, have not been investigated. Both Zeller and Modi 9 and Cushing and Steele 10 used CTT to validate and assess psychometric properties of Sizing Me Up. When further using Rasch models to validate the scale, a more complex psychometric technique that links the probability of a particular response to the person's ability or level of the construct being measured, Rasch models can provide more complex psychometric information than CTT.12,13
Specifically, Rasch analyses provide estimates using the probability of an answer for each item on the Sizing Me Up, and the estimates reflect a respondent's real condition regarding weight-specific QoL. 14 Therefore, the ordinal scale of Sizing Me Up can be converted into a ratio score. Given the nature of nonadditive in an ordinal scale, psychometric testing of Sizing Me Up-adopted CTT methods may be biased. Hence, Rasch analysis is a potential candidate that helps clinicians better understand the feasibility of Sizing Me Up.
CTT based on the equation of X = T + E (where X represents an observed score; T as a true score; E as an error term) to assess reliability (e.g., Cronbach's α) and validity (e.g., concurrent validity) treats Likert-type scale as a continuous scale. 15 Unfortunately, Likert-type scale is not an interval scale, and treating it as a continuous scale may result in some bias. Moreover, the psychometric performance of an instrument using CTT substantially relies on the respondents' characteristics; that is, the same instrument may perform hugely different psychometric properties across various populations. 14 In contrast, Rasch analysis overcomes the aforementioned disadvantages of the CTT by providing item-level statistics that will not be influenced by different samples.14,16,17 Despite the advantages of Rasch analysis, CTT stills has its strength of easy for understanding and can reveal certain amount of psychometric information for clinicians and researchers who are not familiar with Rasch analysis.
Our study aimed to fill in the above research gaps by validating the Taiwan version of Sizing Me Up in a community sample of third to sixth graders, including normal-weight and underweight children, in East Asia using Rasch analysis. In addition to the Rasch analysis, we also used CTT to examine the psychometric properties of the Sizing Me Up. Specifically, we tested concurrent validity with the criteria of depression, self-esteem, BMI, and PedsQL score; known group validity using different weight status categories; and construct validity using CFA. In concurrent validity, we anticipated that the scores of Sizing Me Up would be negatively and moderately correlated with depression scores and BMI values and positively and moderately correlated with the self-esteem scores and PedsQL scores based on their directions of scoring. In known group validity, we expected that normal-weight children would have the highest Sizing Me Up scores, while obese children would have the lowest scores.
Methods
Participants
This study has been reviewed and approved by the Institutional Review Board of the National Cheng Kung University Hospital. The study was then conducted during the spring semester in southern Taiwan (March to June, 2010). The corresponding author first contacted 10 schools in southern Taiwan for recruiting participants through convenience sampling. Afterward, teachers in these schools assisted to invite third- to sixth-grade students to participate. Signed informed consents were obtained from the children and parents interested in participating. A total of 569 students and one parent of each participated student signed the informed consents; however, 71 students reported incomplete answers in the Sizing Me Up, and one of the rest did not provide his height and weight; thus, they were excluded for data analysis. Finally, we analyzed the data of 497 students. In addition, after 2 weeks, 88 completed the second time Sizing Me Up without any missing value. All the students completed all the measures in school in a group of 5–20 under the supervision of the corresponding author and one of their class teachers.
Measures
Body–mass index
The children's height and weight data were obtained from school records and were used to calculate BMI. Based on Taiwanese norms, we used the BMI to assign each student to one of the following weight status categories: underweight, normal-weight, overweight, or obese category. 3
Sizing Me Up
Sizing Me Up is a 22-item questionnaire that measures weight-related QoL. The structure of Sizing Me Up includes five underlying constructs (Emotion [four items], Physical [five items], Teasing/marginalization [two items], Positive attributes [six items], and Social avoidance [five items]). The stem of the items in Sizing Me Up is “… because of your size,” and each item describes a condition during the past time frame for respondents to answer. The descriptor scale includes none of the time, a little, a lot, and all the time. A linear transformation from the response descriptors to a 0–100 scale is suggested by the developers
9
; a higher score indicates better QoL. Specifically, the score calculation for each domain uses the following steps: first, code None = 1, a little = 2, a lot = 3, and all the time = 4; second, reversely code the descriptor scale for all the items except for the items in Positive attitude domain (the coding becomes None = 4, a little = 3, a lot = 2, and all the time = 1); and third, use the following formula to transform the domain score from 1–4 to 0–100:
100. The maximum possible sum is the no. of the domain item × 4; the minimal possible sum is the no. of the domain item × 1. For example, if a respondent scores 10 in Emotional domain (four items), the Emotional domain score will be
Pediatric QoL Inventory Version 4.0
The PedsQL 4.0 includes 23 items that ask the frequency of a difficulty that occurred in the past 2 weeks; each item response ranges from 0 (never) to 4 (almost always) on a five-point Likert-type scale. Response of each item was transformed into a 0–100 scale based on the developer's instructions18,19; higher scores represent better QoL. Specifically, the five-point Likert-type scale is converted into 0 = 100, 1 = 75, 2 = 50, 3 = 25, and 4 = 0 for each item. Then, the average of the responses of 23 items is calculated to represent the total score of PedsQL 4.0. The Taiwanese version of the PedsQL 4.0 had adequate internal consistency (α = 0.68–0.90) 20 and test–retest reliability (ICC = 0.67–0.82). 21 The construct validity of the PedsQL 4.0 cross-validated between child and parent reports has been established for the Taiwanese version. 22
Children's Depression Inventory
The Children's Depression Inventory (CDI) contains 27 items. Each item scores from 0 to 2; a higher score means more depression. The Taiwanese version of the CDI score showed good reliability, including internal consistency (α = 0.81–0.89) and test–retest reliability (ICC = 0.85).23,24
Rosenberg Self-Esteem Scale
The Rosenberg Self-Esteem Scale includes 10 items; each item scores from 1 (strongly agree) to 4 (strongly disagree). The scores of negatively worded items were reversely recorded; thus, a higher score indicates a higher level of self-esteem. 15 In addition to the satisfactory internal consistency (α = 0.77) and test–retest reliability (r = 0.63–0.85),25–27 its unidimensionality has been confirmed in a Taiwanese sample. 28
Translation Procedure for Sizing Me Up
Because Sizing Me Up had never been translated into Mandarin, we first obtained permission from the developers to translate it (Drs. Zellar and Modi) before further psychological testing. We adopted a standard translation procedure that includes forward translation, back translation, and reconciliation.29,30 The forward translation was done by two independent Taiwanese translators who had lived and studied in the United States for more than 2 years. The reconciliation was done by the two forward translators and the corresponding author. The back translation was done by one Taiwanese translator with a master's degree in foreign languages and literature, and her major was English literature. The back translation was examined by the developers who also gave instructions to revise the translated Chinese version of Sizing Me Up. The final translated version was approved by the developers. We made two changes in the translation to adapt to Taiwanese culture. We translated the original term “gym” into “physical education courses” in Mandarin because the concept of “gym” is not yet popular among children at this age. Another change is that “being picked first for recess or gym” was translated as “being representative for physical education courses or exercise/sports competition.”
Statistical Analyses
Demographic data were analyzed using descriptive analyses, internal consistency using Cronbach's α, and test–retest reliability using ICC. Concurrent validity was examined using four different criteria: CDI, Rosenberg Self-Esteem Scale, BMI, and PedsQL. Known group validity was tested for children with different weight status categories using one-way analysis of variance with Scheffé's method, accounting for multiple comparisons.
CFA was performed based on the theoretical framework of Sizing Me Up; that is, five first-order underlying constructs and one second-order construct (QoL). To determine whether the framework is supported, we used the following fit indices: a nonsignificant χ2 value; values of the Tucker-Lewis index, comparative fit index, and the incremental fit index >0.9; and values of root mean square error of approximation and standardized root mean residual <0.08.31,32
Five Rasch analyses with partial credit model were used to examine the unidimensionality of each domain of Sizing Me Up; that is, the item properties in each domain were separately examined. We chose using partial credit model instead of rating scale model for the Rasch analyses because we believed that the descriptor scale distributes differently in each item. That is, although the items share the same descriptor scale in the Sizing Me Up, the respondents were children and may not treat the descriptor scale the same across all the items. In addition, the reason we used five separate unidimensional models instead of a multidimensional model in the Rasch analysis is that we want to demonstrate the psychometric properties of each underlying construct that provide different information from our CFA model. In addition, Linacre stated, “In Rasch measurement, we are attempting to perform the same process of splitting a multidimensional world into unidimensional variables, but now with social science. Asserting and then building unidimensional variables has been very useful in physical science. We expect it will also be in social science.” 33
Each item was determined as to whether it fits well in its embedded construct based on infit MnSq and outfit MnSq with an acceptable range between 0.5 and 1.5.34,35 Infit refers to inlier-sensitive fit and indicates the pattern of responses targeted on the respondent, while outfit refers to outlier-sensitive fit and is more sensitive to items with difficulty and distant from a person. 35 An MnSq value <0.5 suggests that the item is redundant, while >1.5 suggests that the item is out of concept. Furthermore, Rasch analysis can report item difficulty with a log-odd unit (i.e., logit). Then, we examined whether thresholds of categories were disordered based on step difficulty (i.e., difficulty between two response categories nearby, such as none of the time vs. a little), while step difficulties should be monotonically increased with categories. 36 Finally, we used t tests with Bonferroni adjustments to detect differential item functioning (DIF) items; a nonsignificant t value suggests a DIF-free item. DIF was assessed to test whether the difficulty parameter of an item differs across various groups, assuming a latent trait measured by items in the test. Because there were four groups (obesity, overweight, normal-weight, and underweight) with six comparisons, the significant p value for DIF items was set at 0.05/6 = 0.0083.34,37 In addition to testing significant DIF items, we also examined the magnitude of DIF using DIF contrast: the difference of the difficulty values between two groups. 36 A DIF contrast <0.5 logits suggests that the magnitude of DIF is trivial and can be acceptable. 37
The descriptive statistics, internal consistency, test–retest reliability, concurrent validity, and known group validity were analyzed using SPSS 23.0 (IBM Corp., Armonk, NY); CFA, using LISREL 8.8 for Windows (SSI, Inc., Lincolnwood, IL); and Rasch models, using WINSTEPS 3.75.0 (Winsteps, Chicago, IL).
Results
Table 1 reports the demographics, anthropometrics, and patient-reported outcome scores. Reliability, including internal consistency and test–retest reliability, was adequate or close to acceptable for all domain scores of Sizing Me Up and satisfactory for the total score of Sizing Me Up. Moreover, domain scores and total score of Sizing Me Up were all significantly and moderately correlated with CDI score; with BMI; with PedsQL score, except for the Positive attributes domain score. The Positive attributes domain score, however, was significantly and moderately correlated with Rosenberg Self-Esteem Scale score (Table 2).
Demographics, Anthropometrics, and Patient-Reported Outcome Scores for Participants
CDI, Children's Depression Inventory.
Reliability and Concurrent Validity of Sizing Me Up Taiwanese Version
p < 0.05; **p < 0.001.
ICC was used for test–retest reliability.
Rosenberg Self-Esteem Scale.
Adjusted for age.
α = Cronbach's α; CDI, Children's Depression Inventory; ICC, intraclass correlation coefficient.
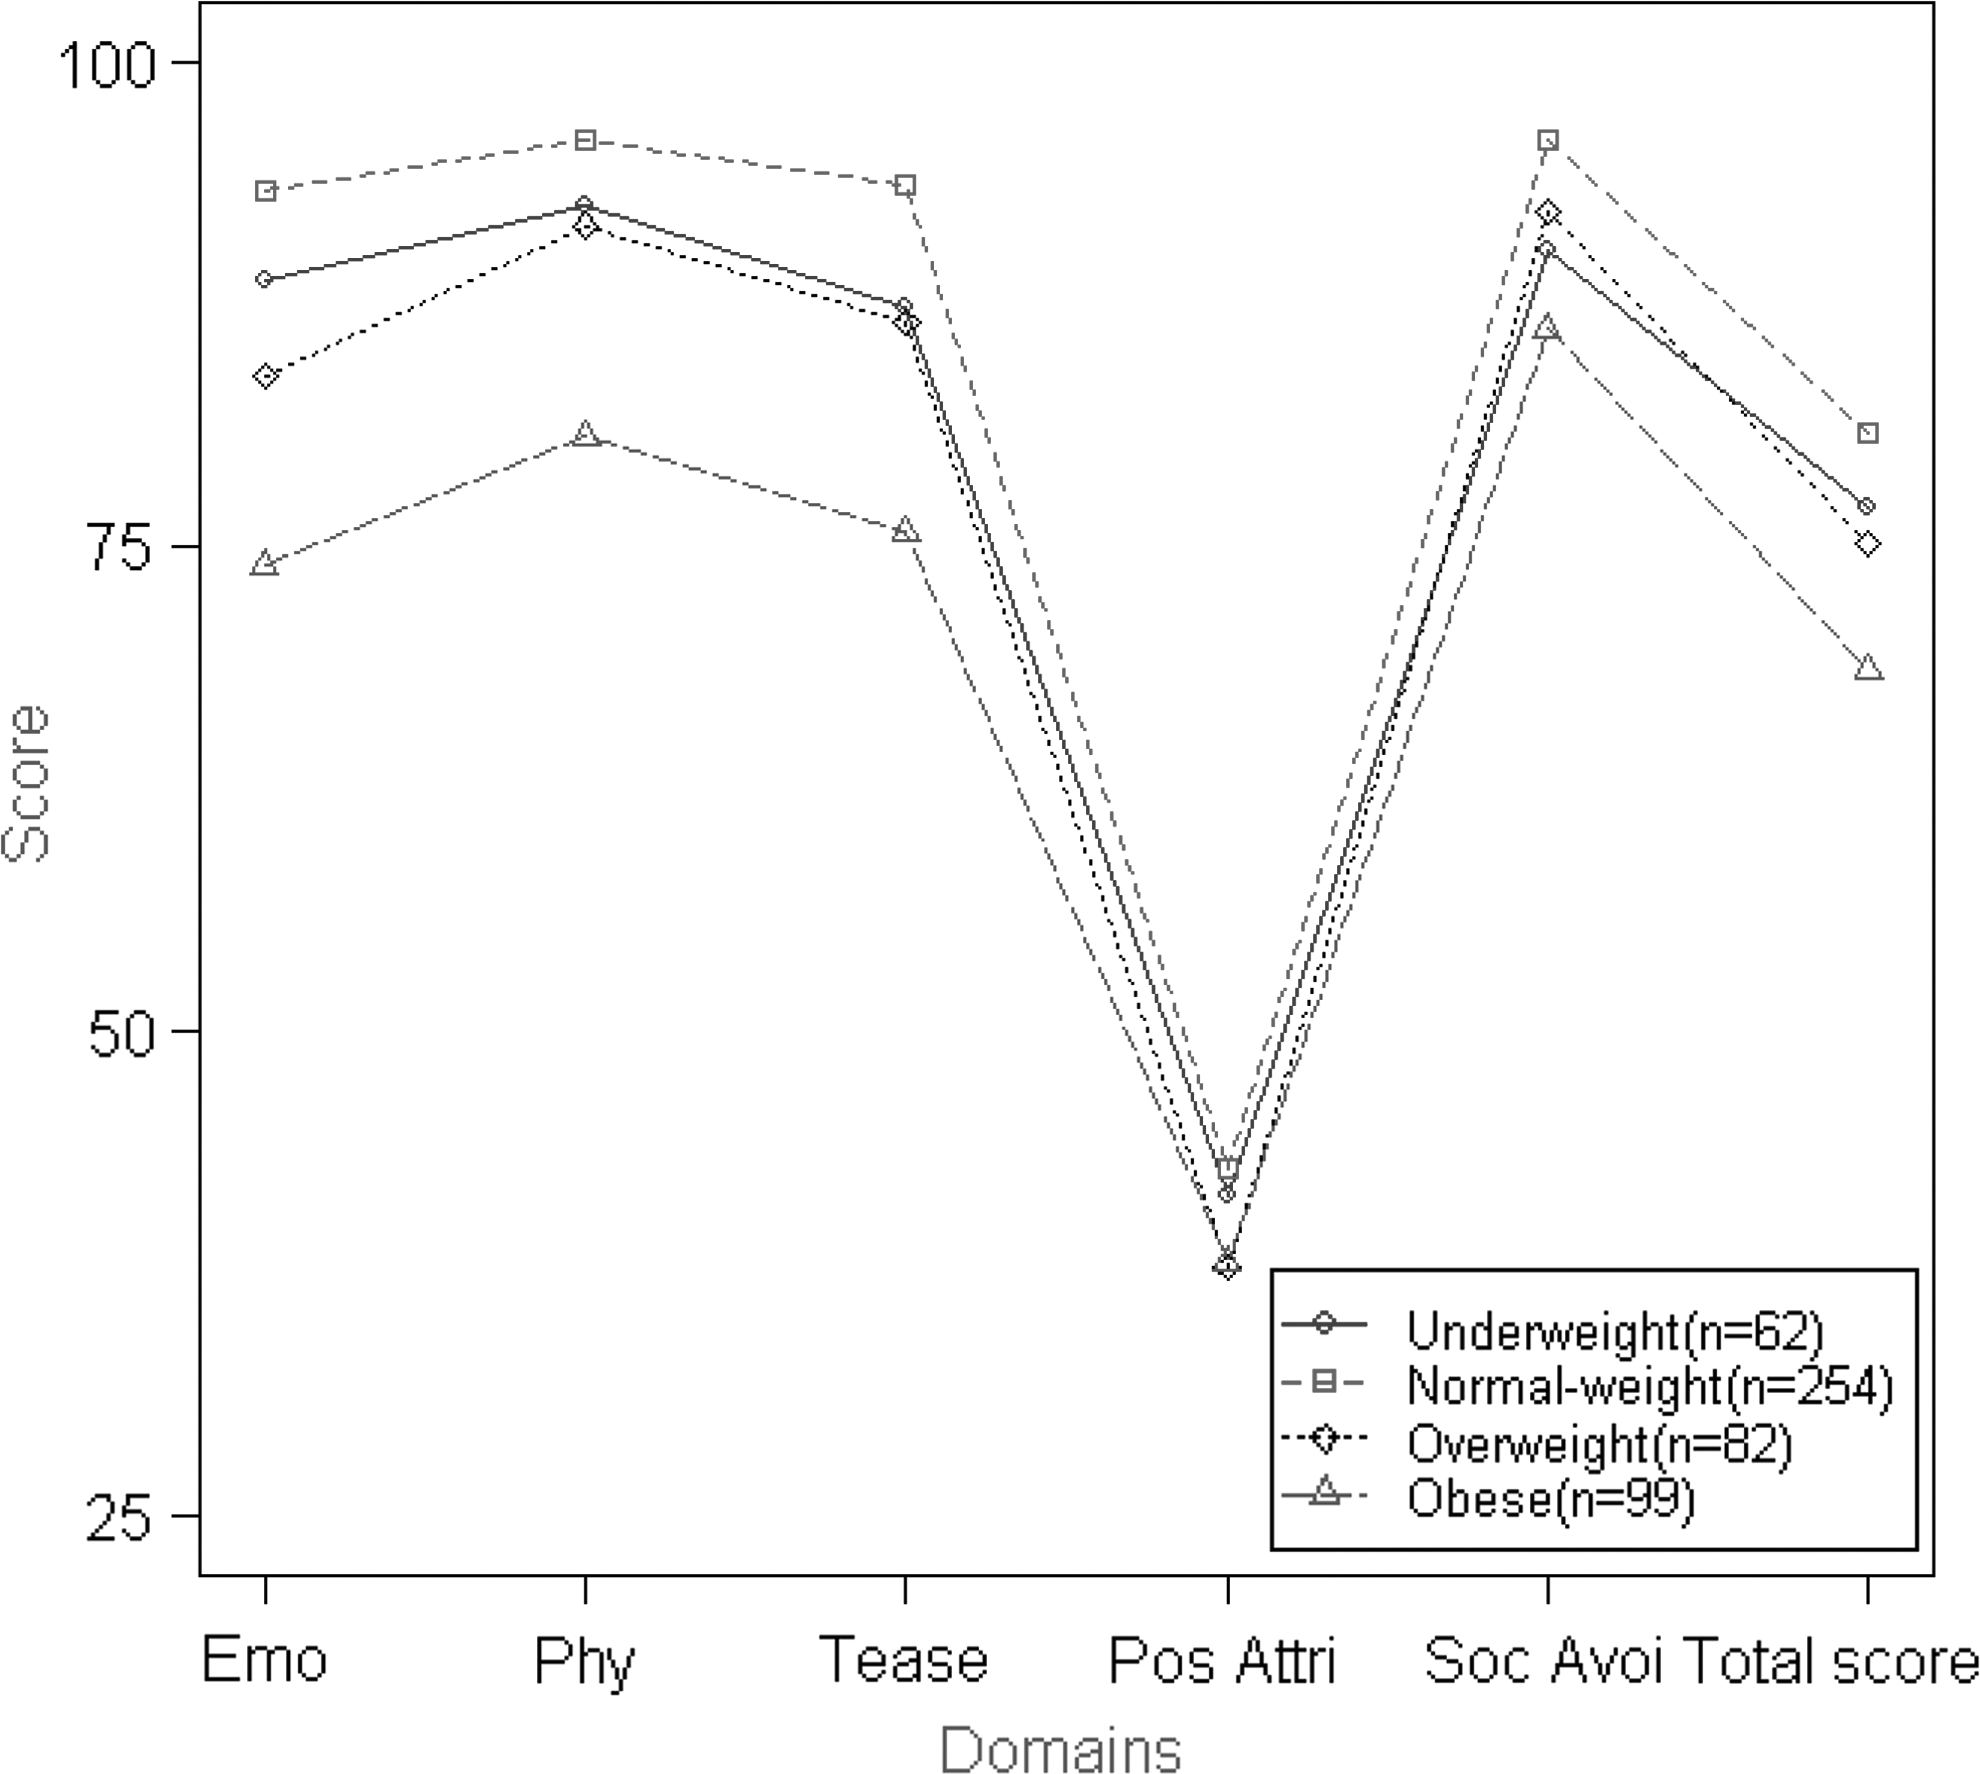
Known group validity was examined for each domain score of Sizing Me Up. The results showed that obese children had the lowest scores in four of the five domains and the total score (p < 0.001); overweight children had lower scores in the Emotion and Teasing/marginalization domains and total score (p ≤ 0.002) than normal-weight children; and underweight children had lower score in the Social avoidance domain (p = 0.001) than normal-weight children (Fig. 1).
Construct validity was supported by both CFA and Rasch analyses. All fit indices, except for the significant χ2 value, were satisfactory in the second-order CFA model (Fig. 2). In addition, all infit and outfit MnSq statistics suggested that all item scores of Sizing Me Up fit well in their belonging constructs (Table 3); however, 10 items showed disordered thresholds in their response descriptors, which included four items in the Physical domain, the other four in the Social avoidance domain, and one item each in the Emotion and the Positive attributes domains (Table 3).

Rasch Analyses on Sizing Me Up
With disordered item thresholds in response descriptors.
Item descriptions revised due to cultural adaptation.
In addition, six items displayed significant DIF. The DIF contrasts were as follows: 1.05 (p = 0.005, normal-weight vs. overweight children) and 1.43 (p < 0.001, normal-weight vs. obese children) for S12 (Had problem fitting into your desk); 0.47 (p = 0.006, normal-weight vs. overweight children) and 0.44 (p = 0007, normal-weight vs. obese children) for S8 (Stood up for/help others); and −1.22 (p = 0.001, normal-weight vs. overweight children) and −1.02 (p = 0.002, normal-weight vs. obese children) for S22 (Choose not to participate in physical education courses or recess). In addition, the DIF contrasts between normal-weight vs. obese children were −0.59 (p = 0.002) for S14 (Were representative for physical education courses or exercise/sports competition) and 0.74 (p = 0.002) for S19 (Got upset at mealtimes), and between normal-weight versus underweight children, the contrast was 1.50 (p = 0.002) for S4 (Felt mad). Of the six items, 5 (S12, S22, S14, S19, and S4) were substantial DIF.
Discussion
We validated Sizing Me Up with a community sample in an East Asian context in a community sample using reliability, concurrent validity, known group validity, CFA, and Rasch analysis. Findings from all analyses confirmed the application of Sizing Me Up in an East Asian context as being appropriate; however, we identified some disordered items using Rasch analyses, particularly items related to Physical and Social avoidance domains. We extended the literature by providing more precise analysis on the response structure using Rasch analyses.
The disordering of responses that we observed in certain items may be due to the children's cognition and apprehensive ability of the four-point scale not fully developed yet 38 especially in items within the Physical and Social avoidance domains. It appeared that children in our sample had problems differentiating the severity represented by choices wording “a little” and “a lot” within a specific question; hence, we did not observe an increasing difficulty pattern in the Rasch analysis. Based on the results, we conclude that children in our sample can only differentiate extreme answers, such as none of the time and all the time; while anything in between was viewed similarly and the intensity level was hard to distinguish. This is particularly a problem when children are answering questions that ask their physical-related problems and they are being socially withdrawn due to their body size. Other measurements that assessed children at younger age also display some disordering of responses using Rasch analysis.39–41 Future study might consider assessing Sizing Me Up in a three-point scale and reassess the reliability and validity in an East Asian sample.
Four questions were interpreted differently between normal-weight and overweight/obese samples and resulted in substantial DIF contrasts, including having problem fitting into your desk, being representative for physical education courses or exercise/sports competition, got upset at mealtimes, and choose not to participate in physical education courses or recess. Some questions might not be fully applicable in Taiwanese culture, such as physical education courses and recess-related questions, because physical education courses and recess are usually not optional in the regular educational system. 42 When questions are not culturally competent for children in an East Asian sample, it is more likely for children in various weight groups to use a different thinking process to answer this item. We recommended some changes of the text can be made to make the scale more culturally competent. For example, “having problem fitting into your desk” can be changed to “feeling uncomfortable sitting on your chair”; “being representative for physical education courses or exercise/sports competition” can be changed to “being praised for your performance for recess or gym”; and “choose not to participate in physical education courses or recess” can be changed to “choose not to participate in recess.” Healthcare providers may also consider omitting these items when using Sizing Me Up in Taiwanese culture. Additionally, feeling mad is the only question that exhibited substantial DIF contrast between the normal sample and the underweight sample. Comparing with other items in the Emotion domain (feeling sad, frustrated, or worried), feeling mad is the item that contains less self-critical or pessimistic thoughts. More studies are needed to verify whether there exists a real difference in feeling mad between children with normal-weight and underweight or whether this item may have been interpreted differently in these two groups.
Although the Sizing Me Up has never been tested among an underweight population, we validated that the scale may apply to a nonobese population in most of the psychometric assessment. Moreover, a slightly inverse U-shaped relationship between weight status and QoL was found in our sample: underweight children in our sample also significantly reported lower body size-related QoL than the normal-weight sample. QoL among underweight children was rarely mentioned or assessed in the literature, mainly due to not having enough sample of underweight children 6 or not being separated from the normal-weight group. 43 Extending the applicability of Sizing Me UP to nonobese children may help healthcare providers understand and identify the problems encountered by underweight as well as overweight/obese children.
Our study has some limitations. First, this community sample in Taiwan may not be generalized to other East Asian samples, considering the diversity of Asian culture. Second, although questions in Sizing Me Up were carefully translated and culturally adapted, we still could not fully capture the original meanings of every question. Some questions, as we suggested in the discussion previously, may not apply to our cultural context. Other examples include the Positive attributes domain, a much lower score in our sample was observed compared with the U.S. sample. 10 Taiwanese culture, rooted in Confucianism that emphasizes being humble and modest, might especially reflect on positive attributes. 44
Conclusion
We recommend using Sizing Me Up in other similar East Asian community settings. We also concluded that Sizing Me Up might be assessed among children with normal-weight or underweight. Because some questions do not show perfect fit in the Rasch and DIF analysis, we caution that when using this measure in an East Asian context, researchers and clinicians need to be aware of the potential different cognitive process and cultural variations.
Footnotes
Acknowledgments
The authors thank the teachers who assisted them to recruit the participants and all the children and their parents who agreed to participate in the study.
Author Disclosure Statement
No competing financial interests exist.