
Abstract
Abstract
Background:
Adult BMI trajectories outperform single BMI measurements as predictors of cardiovascular mortality; however, it is unknown whether this also holds in childhood. We aimed to identify BMI trajectory categories from birth to adolescence, and examine their associations with adolescent cardiovascular function and structure.
Methods:
Adolescents from a community-based prospective birth cohort completed 11–16 BMI measurements between birth and adolescence. BMI trajectory categories were identified using latent class analysis. Associations between trajectories and cardiovascular outcomes (14 years) were assessed using adjusted linear regression models (n = 187). Cardiovascular outcomes included systolic/diastolic blood pressure, augmentation index, pulse wave velocity, carotid intima-media thickness, and retinal arteriole-to-venule ratio. Regression models were adjusted for child age, gender, height, socioeconomic status, and puberty status at outcome.
Results:
Three BMI trajectories emerged that diverged sharply by the age of 1 year. BMI increments were thereafter roughly parallel for those in the low normal (39%) and high normal (51%) groups, but steeper in the consistently overweight (10%) group, which was notable for lack of an obvious adiposity rebound. Cardiovascular function and structure were similar across the three trajectory groups. The only exception was augmentation index, which was 7.8% (95% CI: 2.6 to 13.0) higher in the consistently overweight individuals than the low normal individuals.
Conclusions:
We found little evidence that those with consistently higher BMI from infancy experienced poorer cardiovascular function or structure by the age of 14 years. Nonetheless, childhood BMI trajectories track strongly, meaning resolution of risky BMI, while essential to decrease later cardiovascular risk, is unlikely without intervention.
Introduction
Unless prevalent early-life risk factors such as childhood obesity 1 are reduced, cardiovascular disease prevalence will likely continue to rise. Interventions that are effective in preventing or reversing childhood overweight remain elusive,2,3 but are vital because overweight/obese children who resolve to normal weight by adulthood have the same risks of hypertension and carotid artery atherosclerosis as those never overweight. 4 This suggests that cardiovascular damage from excess adiposity either develops in the period between adolescence and adulthood or develops with childhood overweight, but is reversible with weight loss.
Cross-sectional associations between obesity and aspects of cardiovascular structure and function are conflicting. Overall, overweight is associated with high blood pressure in 15–17 year olds 5 and, in separate meta-analyses, with arterial stiffness in 5–24 year olds 6 and retinal venular widening and reduced arteriolar–venular ratio in 6–20 year olds 7 . 8 In contrast, both null and positive associations have been reported between obesity and large artery changes measured by carotid intima-media thickness.9–12 Measuring the early variation of cardiovascular function and structure in adolescence may give an early indication of risk of cardiovascular morbidity and mortality in adulthood. 13 Reporting this combination of functional (blood pressure and arterial stiffness) and micro- and macrovascular structural [retinal arteriole-to-venule ratio (AVR) and carotid intima-media thickness] cardiovascular measures together provides an overall snapshot of the evolution of cardiovascular health and pathogenesis, 14 with functional abnormalities hypothesized to precede structural changes.14,15
Early-life adiposity is cross-sectionally associated with various pediatric precursors of CVD. 8 However, a weakness of all cross-sectional studies is their inability to determine how the timing, duration, and severity of childhood adiposity throughout the early life course might impact cardiovascular risk. Traditional longitudinal studies that draw only on two time points (exposure and outcome) share this difficulty. A further weakness is that most studies focus on one main aspect of cardiovascular health (e.g., arterial stiffness, the microvasculature, or the macrovasculature). Examining multiple aspects of the cardiovascular system in a single population could shed greater light on how and when functional and structural cardiovascular abnormalities develop in response to exposures.
Trajectory analysis is well suited to the study of life-course questions. In adults, BMI trajectories outperform one-time BMI measurement as predictors of mortality risk. 16 In the American National Longitudinal Study of Adolescent Health, 16-year olds with a large BMI increase in late adolescence, who maintained their high BMI into adulthood, had the greatest odds of hypertension at age 28 years (men: OR: 3.99, 95% CI: 3.16 to 5.03; women: OR: 3.43, 95% CI: 2.84 to 4.13) compared to consistently normal-weight individuals. 17 Boyer recently reported that higher BMI at 15 months and steeper subsequent BMI gains to 10 years predicted higher systolic blood pressure at the age of 15 years. 18 These studies confirm the importance of both timing of BMI changes and severity of BMI for blood pressure.
With enough measurements, children in community-based populations can be readily classified into “categories” of empirically derived BMI trajectories from early life,19–22 although these usually lack the detail to delineate early variation within the infant period. Whether and how BMI trajectories are associated with objective measures of cardiovascular function and/or structure by adolescence has not been reported. This may be an important missing link, since variations in these outcomes by this age are clearly associated with adult cardiovascular disease and mortality.7,23,24
Our study addresses these issues, taking a life-course approach linking multiple repeated measures of BMI, in a community sample from birth, with cardiovascular phenotype at 14 years. The small sample size enabled very frequent childhood contacts during which body measurements were collected and an intensive and comprehensive cardiovascular assessment at age 14 years that would not typically be viable for larger studies. We aimed to (1) identify categories of BMI trajectories from birth to adolescence and (2) examine their predictive associations with functional and structural cardiovascular measurements in adolescence. Given the long latency of CVD development, we do not expect to see the pronounced structural and functional abnormalities observed in high-risk 25 or adult populations. Rather, we hypothesize incremental differences in cardiovascular risk factors that may be important for long-term health outcomes. 26
Method
Study Population
The PEAS Kids Growth Study is a longitudinal prospective study examining how early growth and development impacts later cardiovascular health. Parents of 493 first-born children (49% female) living in three local government areas (urban, suburban, and semirural) of Melbourne, Australia, 27 were recruited between June 1998 and February 2000 into the Parent Education and Support (PEAS) Program. Study inclusion criterion included sufficient parental English to complete questionnaires (aimed at a grade-6 level of written English). The study was a quasi-experimental trial with a period of prospectively recruiting children who became historical controls followed by a similar period recruiting intervention children in the same areas. 27 The PEAS program was delivered through the pre-existing, universal, and government-funded Maternal and Child Health (MCH) program visits. Both groups received routine MCH visits throughout the first 2 years of life (at 2 weeks and 2, 4, 8, 12, 18, and 24 months), with parents in the intervention group receiving additional advice regarding common parenting problems (e.g., cry–fuss behavior) at key ages. 27 The two groups were similar on child BMI and other outcomes reflecting child health and family wellbeing at 2 years and so were thereafter followed as a single combined cohort.
PEAS families still residing in metropolitan Melbourne were invited into the prospective PEAS Kids Growth Study at child age of 4 years. Participants completed six visits between child ages of 4 and 6.5 years, followed by single visits at 10 and 14 years. The project was approved by The Royal Children's Hospital Human Ethics Research Committee (HREC 28135). Parents provided written consent at each phase of the study, and adolescents were also given the opportunity to consent in writing at the most recent appointment (aged 14 years).
Procedures and Measurements
Parents completed written questionnaires at every wave. These were supplemented with objectively measured physical health measures collected by MCH nurses (2 weeks to 2 years), researchers in home visits (4–10 years), and clinic-based assessments or home visits (14 years).
Repeated BMI exposure (all waves)
Over the first 2 years of life, highly trained MCH nurses recorded one measurement of each of length and weight at each routine visit; researchers transcribed these from parent-held child health records, along with child birth weight and length recorded by the birthing hospital. Subsequently, researchers measured height (Invicta portable rigid stadiometer, Leicester, UK) twice to 1 decimal place in light clothing without shoes and socks (except where measures differed by >1 cm, when a third height measurement was collected). Weight was measured once using digital scales (4–6.5 year follow-ups, Tanita TI-THD 646; 10 and 14 year-old follow-ups, Tanita BC-351, Tokyo, Japan). BMI (kg/m2) was calculated from up to 16 measurements of mean height and weight between birth and 14 years. The single measure of length available for the infant BMI may have increased measurement error slightly; however, routinely collected child health record measures have previously been deemed adequate for research purposes. 28
Cardiovascular function and structure outcomes (adolescent wave)
Table 1 describes the measurement protocols undertaken by trained researchers. Agreed population cut points associated with increased adult CVD risk are available and widely used for pediatric hypertension (high blood pressure). 29 While reference values for cIMT exist and arbitrary cut points (i.e., 75th centile) are sometimes used for our other cardiovascular functional and structural outcomes, these have not yet been linked to increased CV risk and so were not utilized. Rather, all cardiovascular outcomes were assessed in their continuous form.
PEAS Kids Growth Study Outcomes and Potential Confounders
AIx, augmentation index; AVR, arteriole-to-venule ratio; cIMT, carotid intima-media thickness; CRAE, central retinal arteriole equivalent; CRVE, central retinal venule equivalent; PEAS, Parent Education and Support; PWV, pulse wave velocity; SEIFA, socioeconomic indexes for areas.
Potential confounders identified a priori are also described in Table 1.
Data Analysis
Baseline sample characteristics were summarized for the retained, not retained, and entire samples (Table 2). To be included in trajectory analysis, we required participants to have at least four BMI measurements collected throughout childhood (one at birth, one between 2 weeks and 2 years, one between 4 and 6.5 years, and one between 10 and 14 years) (n = 252). This ensured that trajectories were generated for those with mostly complete data [mean BMI measurements of included participants = 15.4 (SD: 0.9)]. To be included in regression analysis, participants were required to have also completed a cardiovascular assessment at the adolescent follow-up (n = 187).
Baseline Sample Characteristics
Retained participants include those who had height and weight measured at least four times (once at birth, between 1 month and 2 years, between 4 and 6.5 years, and between 10 and 14 years) and had cardiovascular measurements performed at the adolescent follow-up.
Reported from 4-year parent questionnaire.
Using Mplus v5 Software, 30 LCA was conducted to identify and assign participants to their most-likely BMI trajectory category (Aim 1). BMI trajectory categories were identified using up to 16 raw BMI values between birth and 14 years. LCA was used rather than parameterizing growth (i.e., with linear or quadratic variables) to allow enough flexibility to detail the shapes of trajectories during early life. 31 LCA models categorize individuals into meaningful subpopulations/categories with similar measured variables. 32 The flexibility of this modeling technique enables empirical patterns to be detected, not bounded by linear, quadratic, or cubic conventions. An optimal three-trajectory model (entropy = 0.95) was selected based on the model fit statistics coupled with the need for our smallest group to include at least 10% of the sample (see statistics and further description in Supplementary Table 1; Supplementary Data are available online at www.liebertpub.com/chi).
Linear regression models adjusted for the potential confounders (Stata v13.0) were then used to assess associations between BMI trajectories (as explanatory variables) and each adolescent cardiovascular outcome (Aim 2). We report p-values from the combined Wald test evaluating associations between the high normal or consistently overweight groups with the low normal reference group.
It is plausible that associations between BMI trajectories and outcomes are simply a reflection of current BMI. To test this proposition, we repeated each regression analysis in post hoc analyses, including current raw BMI as an additional explanatory variable.
Results
Sample Characteristics
Figure 1 summarizes the study flow. While 252 (51% of original participants) had sufficient information collected throughout early life to generate detailed growth trajectories, only 187 (38% of original PEAS participants) met the inclusion criteria for the subsequent regression analyses. Table 2 shows that retained participants [mean age 14.5 years (SD 0.5)] were broadly similar on most characteristics to those not retained, but were more likely to be female (54.5% vs. 45.1%) and have mothers who had completed tertiary education (45.9% vs. 34.7%).
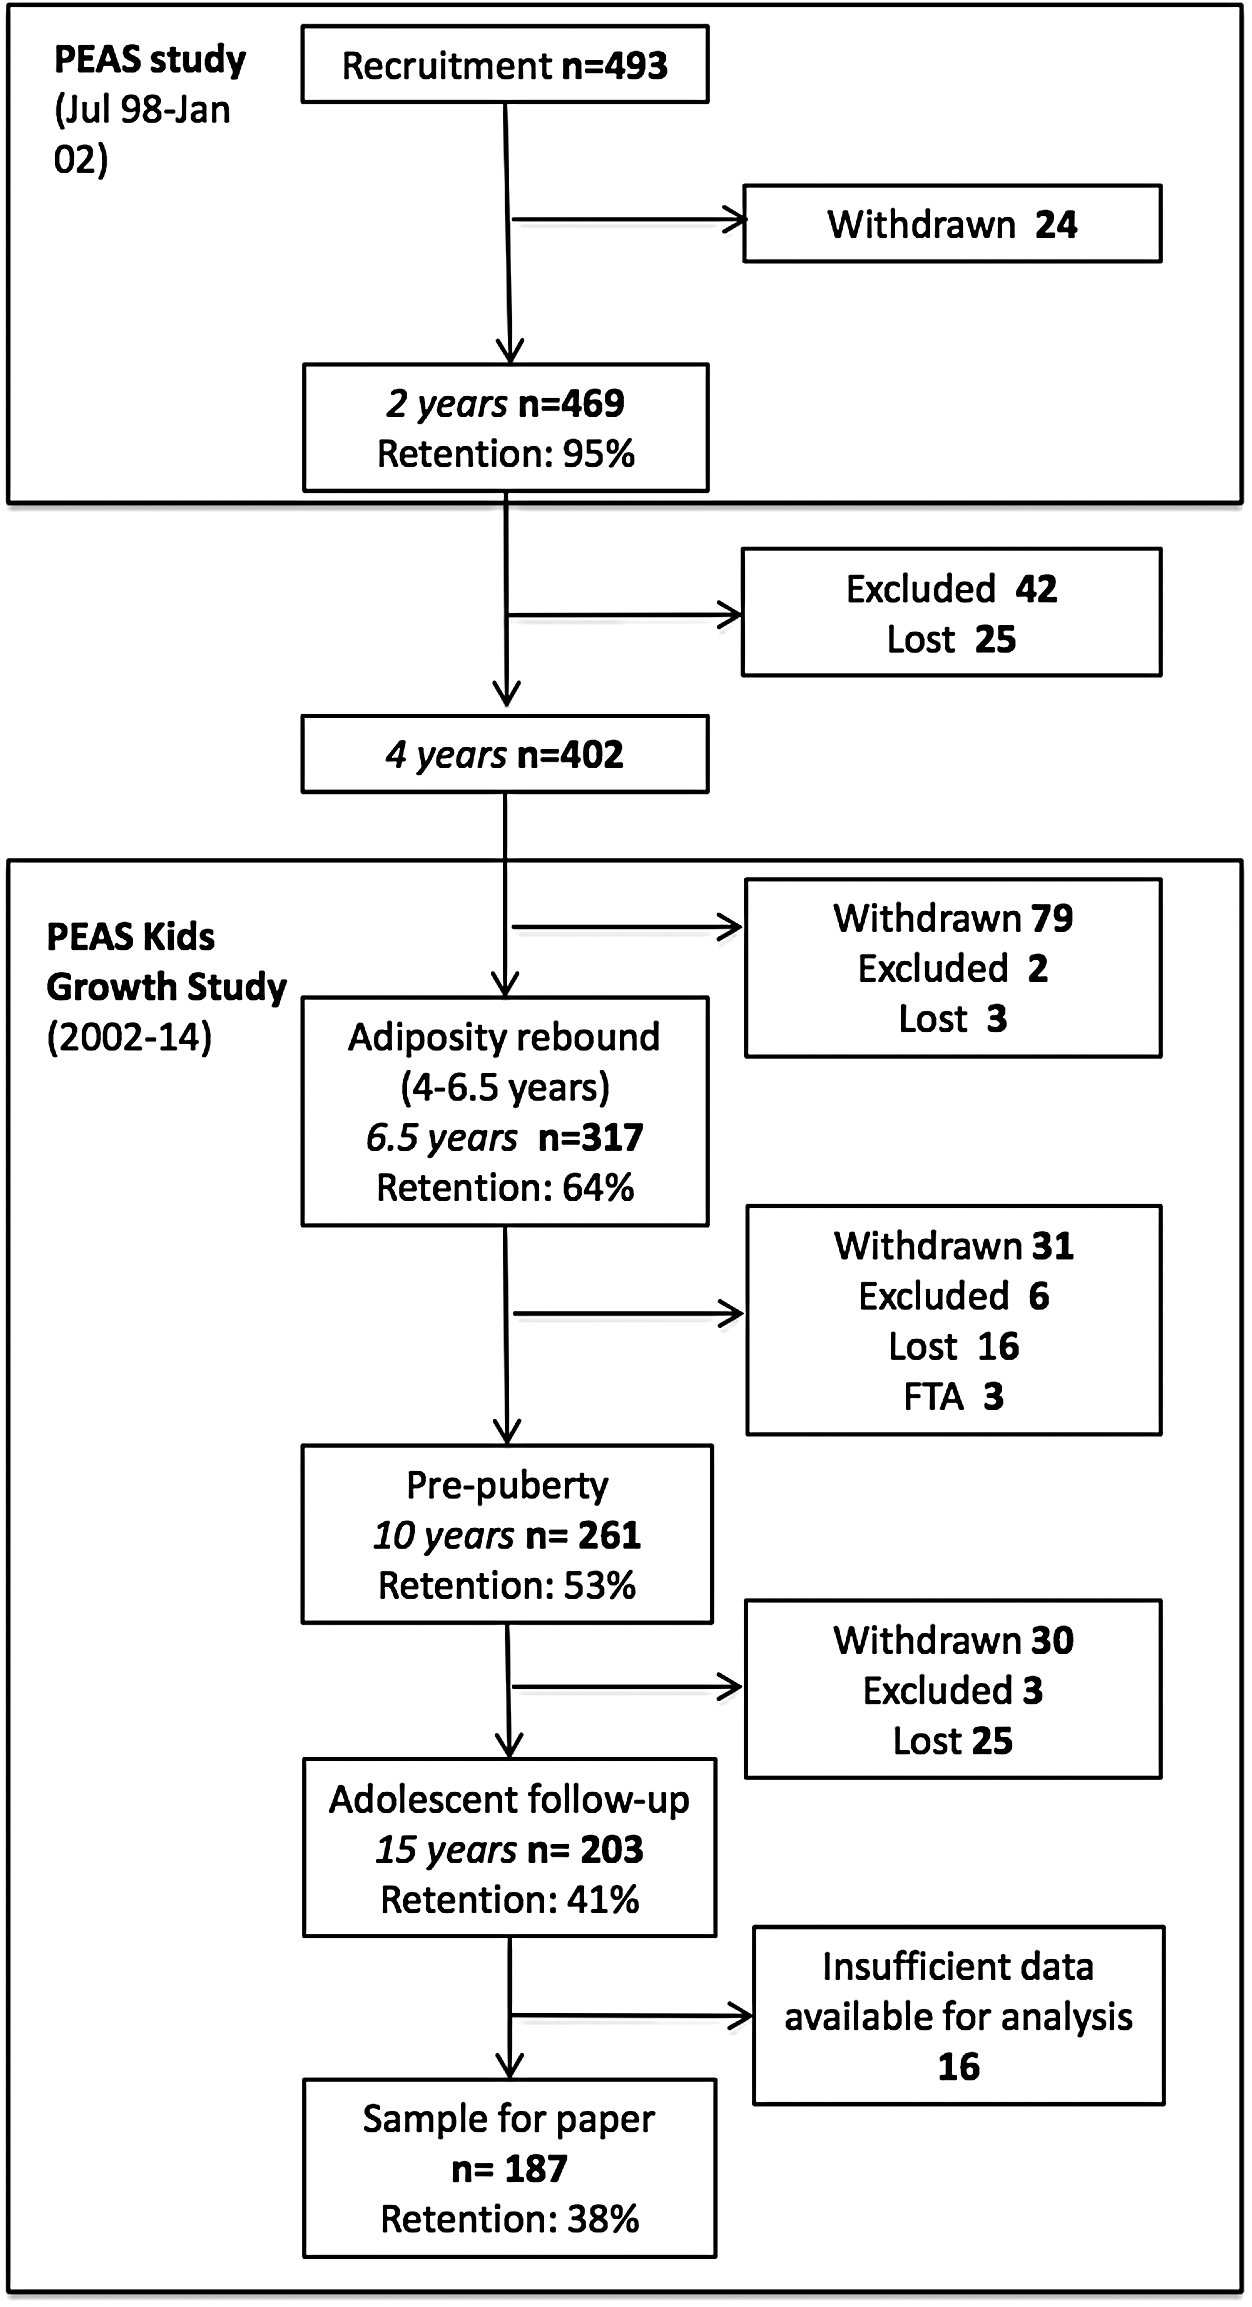
PEAS Kids Growth Study flow. PEAS: Parent Education and Support, Retention (%) calculated as participants in study as a proportion of those originally recruited into the study.
Retained participants were also slightly more advantaged than the Australian population (mean disadvantage score 1049, SD 42 vs. Australian population mean 1000, SD 100) 33 and their mothers had slightly higher rates of tertiary education than Australian women aged 25–64 (46% vs. 40%). 34 However, the prevalence of overweight and obesity (23% of PEAS participants at outcome) was similar to that recently reported in Australian 2- to 18-year olds (21%–25%). 1 Most participants were in the later stages of puberty with 0% classed as pre-pubertal, 3.9% classed as early pubertal, 15.6% classed as mid-pubertal, 66.1% classed as late pubertal, and 14.4% classed as post-pubertal.
Typologies of Early-Life BMI Trajectories (Aim 1)
Three BMI growth trajectory categories were identified between birth and adolescence that clearly diverged in infancy. Figure 2 shows mean BMI values for individuals in each trajectory category at each time point. Gender-weighted averages of the International Obesity Task Force cutoffs for overweight and obesity reported by Cole 35 are overlaid in the figure to aid in the interpretation of observed BMI. Thirty-nine percent of participants were classified as low normal and 51% as high normal BMI. BMI in children following the high normal trajectory increased more steeply than low normal before 1 year, but thereafter progressed approximately in parallel. BMI in the ∼10% classified as consistently overweight increased most steeply in the first year, showed little evidence of a clear adiposity rebound, 36 and continued to steadily diverge upwards until around 10 years, after which differences between groups remained consistent.
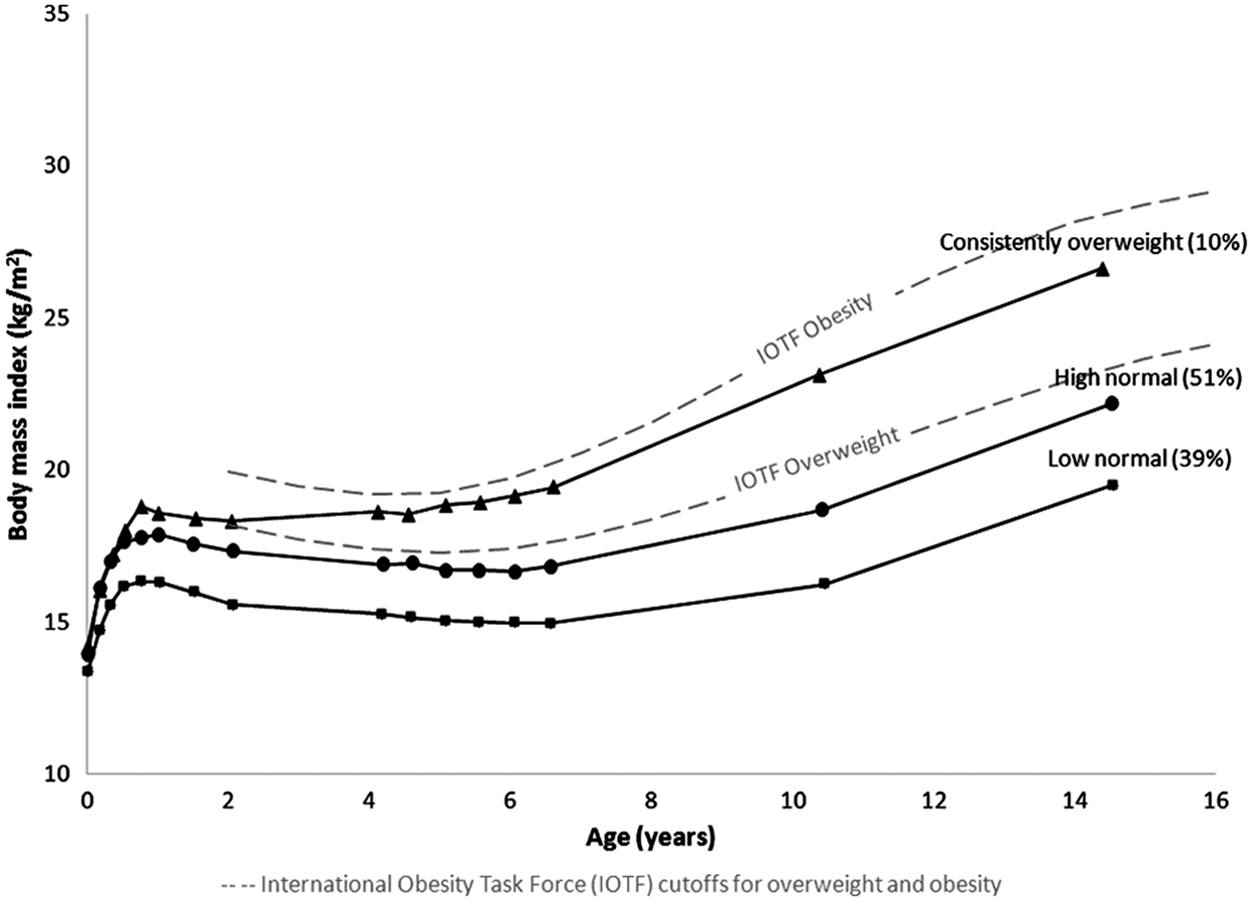
Childhood BMI trajectories from birth to adolescence. International Obesity Task Force cut points for childhood overweight and obesity are included to aid interpretation.
Associations of Trajectories with Adolescent Cardiovascular Function and Structure (Aim 2)
Table 3 describes cardiovascular outcomes by BMI trajectory category. There was little evidence that high normal individuals differed from the low normal reference group across the range of cardiovascular functional and structural outcomes. Cardiovascular structural outcomes were also similar in the consistently overweight and low normal reference group (cIMT β: 0.02, 95% CI: −0.03 to 0.06; AVR β: 0.6, 95% CI: −3.0 to 4.3), as were diastolic blood pressure (β: −0.8 mmHg, 95% CI: −4.4 to 2.7) and pulse wave velocity (β: 0.0 m/sec, 95% CI: −0.4 to 0.4), a more direct indicator of arterial stiffness.
Mean (SD) of Cardiovascular Outcomes for Each Trajectory Group and Adjusted Mean Differernces (95% CI) for High Normal and Consistently Overweight Cardiovascular Outcomes Compared to Low Normal Children
p-value from Wald test testing the combined significance of comparisons of high normal and consistently overweight trajectories to the reference category: low normal.
Limited sample for cardiovascular structure measures due to inability of some participants to attend visit at Melbourne's Royal Children's Hospital (Carotid intima-media thickness sample = 95; retinal AVR sample = 101). A priori potential confounders in the adjusted models were child age, gender, height, maternal education, SEIFA, and puberty status at outcome.
Bolded individual values are significant at the level p < 0.05.
However, consistently overweight individuals had a mean augmentation index that was nearly one standard deviation (7.8%, 95% CI: 2.6 to 13.0) higher than low normal individuals. While not statistically significant, adjusted mean systolic blood pressure was slightly higher (β: 2.3 mmHg, 95% CI: −2.5 to 7.2) in consistently overweight individuals, with the confidence intervals including the possibility of an important increment.
The post hoc analyses (Supplementary Table 2) suggested that lifetime BMI trajectory adds little, if any, additional information about adolescent cardiovascular outcomes, over and above current BMI. Current BMI more saliently explained the variance in the two measures (augmentation index and systolic blood pressure) than the consistently overweight BMI trajectory (Table 3). Thus, a 1 kg/m2 higher current BMI was associated with a 0.7% (95% CI: 0.2 to 1.2%) higher augmentation index and a 0.6 mmHg (95% CI: 0.2 to 1.1) higher systolic blood pressure.
Discussion
Children following low normal, high normal, and consistently overweight BMI trajectories were represented in our study sample. Virtually all of the BMI difference between high normal and low normal trajectories was already present by this age, but mean BMI in the 10% classified as consistently overweight continued to steadily diverge upwards until at least 10 years. The lack of robust differences in cardiovascular function or structure in the high normal or consistently overweight individuals compared to low normal individuals suggests that, in nonclinical samples, life-course BMI is not a strong predictor of cardiovascular phenotype in healthy populations to at least 14 years.
Strengths include the extensive follow-up of this community-based sample from birth to adolescence. Height and weight were measured on average 15 times during four critical periods for the development of healthy weight (birth, infancy, the typical period of adiposity rebound, and throughout adolescence). This allowed for more precise visualization of the early-life separation of individuals into distinct BMI trajectories before 1 year of age. With equipment such as the SphygmoCor XCEL, only recently developed to a point viable for community samples, 37 no prior population studies have to our knowledge objectively examined vascular function, early markers of atherosclerosis, and microvascular damage as “hard” adolescent outcomes of total childhood adiposity exposure.
Limitations include the substantial loss to follow-up over the 15-year course of the study, with disproportionate retention of families with more educated mothers limiting generalizability to more disadvantaged children who are known to have poorer cardiovascular outcomes. 38 In addition, cardiovascular structure measures were only collected for those able to attend a clinic-based assessment (54% of sample), with equipment not available for home visits. Nonetheless, our study reflected the range of BMI expected in a community sample and the use of confidence intervals allowed us to indicate the precision of our estimates taking into account sample size. 39 We traded off retention and sample size against the large number of BMI measurements and labor-intensive phenotypic cardiovascular measurements available in this cohort. The resulting sample size also precluded differentiation of less-typical trajectories of BMI change sometimes reported in larger population cohorts (e.g., resolving overweight). 21
Our sample size precluded stratification to examine the possibility that relationships between BMI trajectories and cardiovascular outcomes differ by child age, gender, and puberty status. However, including these additional variables as potential confounders in our regression models changed neither the direction nor significance of our results. The PEAS Kids Growth Study did not collect blood samples; while examining metabolic markers would have been interesting, the aim of this study was to examine cardiovascular function and structure. In addition, findings could also be dramatically different in clinically or morbidly obese teenagers, who were not represented in this cohort. Nonetheless, to our knowledge this is the largest birth cohort to date with this duration and frequency of BMI measurement and range of objective adolescent cardiovascular measurements.
In consistently overweight compared to low normal children, augmentation index was higher (indicating increased arterial stiffness), but pulse wave velocity did not differ. These conflicting results for arterial stiffness could represent a developmental cardiovascular sequence, whereby aortic wave reflection characteristics underlying the augmentation index estimate represent the first hint of vascular damage, preceding measurable changes in pulse wave velocity. Alternatively, these discrepancies could represent error or lack of precision in one or both measures. 40 We consider pulse wave velocity the more reliable indicator because it is more directly measured, whereas augmentation index indirectly estimates aortic stiffness from the same brachial waveform as blood pressure. 40 At time of writing, internal SphygmoCor equations had been validated only in adults. 40 Once validated adolescent equations become available, these relationships should be re-examined.
Neither diastolic nor systolic blood pressure differed significantly between trajectory categories. This was surprising because, like other studies, we have previously shown that blood pressure is concurrently related to higher BMI in this sample at 14 years. 41 In fact, post hoc analysis confirmed that concurrent BMI was more saliently associated with systolic blood pressure than the preceding BMI trajectory categories, consistent with Attard's trajectory study of BMI trajectories (16–28 years). 17 She postulated this might reflect “the immediate effects of excess weight on blood pressure in terms of greater cardiac output and vascular resistance.” 17
A recent systematic review reported strong cross-sectional associations between obesity and increased retinal venule caliber, and in some cases decreased arteriole caliber. 7 This was not borne out in this study, either cross-sectionally 41 or in these longitudinal analyses. Our confidence intervals for cIMT are narrow even in the small consistently overweight (−0.03, 0.06) trajectory group, from which we infer that clinically significant differences in early-stage carotid atherogenesis are unlikely. Our estimates in this same group are similarly null for AVR, but the wider confidence intervals mean that a 3.0% decrease or 4.3% increase in AVR compared to low normal individuals is possible. We therefore hope this study will stimulate larger replications despite their practical challenges.
We conclude that the BMI trajectories that were identified separate in infancy and thence track strongly. However, these very distinctive trajectories show little association with cardiovascular phenotypes by mid-adolescence. We interpret this in light of previous research showing that BMI continues to track strongly from adolescence to adulthood 42 and both adolescent overweight and subsequent BMI trajectories increase cardiovascular risk. 43 Thus, the mid-teens may indeed represent a “tipping point” after which the vascular system no longer adapts to childhood adiposity and readily measurable vascular damage begins to occur.43,44 If so, the window of opportunity to prevent irreversible cardiovascular damage by shifting adverse BMI trajectories to healthier profiles may close soon after the mid-teen years. Finding effective weight interventions—both preventive and treatment based—throughout the first 14 years of life must remain a priority.
Footnotes
Acknowledgments
Ms. Hanvey was supported by an Australian Postgraduate Award Scholarship; Dr. Mensah by Australian NHMRC Early Career Fellowship 1037449 and Career Development Fellowship 1111160; and Prof. Wake by NHMRC Senior Research Fellowship 1046518. The Australian National Health & Medical Research Council (NHMRC) and the Victorian Government funded Phases 1–3 of the study, with the most recent Phase 4 unfunded. Research at the Murdoch Childrens Research Institute is supported by the Victorian Government's Operational Infrastructure Support Program. We thank Greta Goldsmith for analyzing our carotid intima-media images, the Centre for Eye Research, Australia, for analyzing our retinal photographs, and the PEAS Kids Growth Study parents, children, and researchers who have generously contributed their time over the last 15 years.
Author Disclosure Statement
No competing financial interests exist.
References
Supplementary Material
Please find the following supplemental material available below.
For Open Access articles published under a Creative Commons License, all supplemental material carries the same license as the article it is associated with.
For non-Open Access articles published, all supplemental material carries a non-exclusive license, and permission requests for re-use of supplemental material or any part of supplemental material shall be sent directly to the copyright owner as specified in the copyright notice associated with the article.