




Abstract
Abstract
Background:
Infant feeding practices are a focus of early obesity prevention. We tested whether infant growth velocity increased after breastfeeding termination and complementary food introduction.
Methods:
Our secondary analysis included a sample of 547 mother-infant dyads from a longitudinal randomized controlled trial conducted in Michigan and Colorado. Infant anthropometrics at birth, baseline, and 6- and 12-month follow-up were standardized to BMI-for-age z-score (ZBMI) according to World Health Organization (WHO) growth charts. We used growth curve models with time-varying predictors to quantify effects of breastfeeding termination and timing of complementary food introduction on growth velocity.
Results:
Median breastfeeding duration was 2.0 months [confidence interval (CI) = 2.0–2.5]; median introduction of complementary foods occurred at 3.0 months (CI = 2.8–3.2). Breastfed infants not yet introduced to complementary foods had an average ZBMI growth velocity of 0.050 (CI = −0.013 to 0.113) z-score units per month [zpm], not significantly faster than WHO growth trajectory (p = 0.118) defined as 0 zpm. Breastfeeding termination had negligible effect on ZBMI growth velocity (γ11 = 0.001, CI = −0.027 to 0.030, p = 0.927). Introduction of complementary foods increased ZBMI growth velocity relative to an average child in the sample, but not significantly (γ12 = 0.033, CI = −0.034 to 0.100, p = 0.334). Growth velocities for infants receiving complementary foods both before and after breastfeeding termination were significantly faster than the WHO growth trajectory (0.083 zpm, CI = 0.052–0.114, and 0.084 zpm, CI = 0.064–0.105, respectively, p's < 0.001).
Conclusions:
Average postcomplementary food introduction growth velocity was significantly higher than WHO growth trajectory, but did not differ from the sample's initial average trajectory. Growth curve models can accurately estimate effects of feeding practices on infant growth to direct obesity prevention efforts.
Introduction
Childhood obesity affects nearly one of every six children in the United States, and disproportionately affects low-income minority individuals.1,2 The strong association between rapid weight gain in infancy and childhood obesity rates suggests the need for early prevention efforts.3–8 Rapid weight gain in infancy also has been inversely associated with insulin sensitivity and positively associated with trunk fat and waist circumference.9,10 Infant growth trajectories, like child obesity risk, have been linked with a multitude of interrelated genetic and environmental factors, including infant feeding practices, racial/ethnic background, prenatal nutrition, and maternal socioeconomic status.11–17 As modifiable factors, infant feeding practices have been a recent focus of early obesity prevention research.
Breastfeeding and age at introduction of complementary foods (defined as introduction of solid foods) are modifiable infant feeding practices with the potential to promote healthy infant growth. 18 The American Academy of Pediatrics (AAP) and the World Health Organization (WHO) both recommend exclusive breastfeeding until about 6 months of age, followed by continued breastfeeding as complementary foods are introduced.19–21 Support for these recommendations with regard to rapid infant weight gain and subsequent obesity risk is far from conclusive warranting further investigation. For example, although recent systematic reviews estimate a 10%–15% reduction in obesity risk for breastfed children compared to those who were never breastfed, the association of breastfeeding duration and obesity was unclear, in part, due to variation in breastfeeding duration classification.22,23 A recent large randomized controlled trial found no association between exclusive breastfeeding duration and BMI at six and a half years of age. 24 Likewise, evidence supporting an association between delayed introduction of complementary foods and reduced rapid infant weight gain is both limited and mixed. Ten of 17 observational studies in a 2015 systematic literature review supported an inverse association in which early introduction of complementary foods predicts more rapid subsequent infant growth. However, many of those studies did not consider reverse causality, the possibility that faster growth or larger size predicted earlier introduction of complementary foods. 25 A similar 2013 systematic literature review found only 5 of 21 articles to support that early introduction of solid foods (defined as <4 months of age) had a significant association with higher childhood BMI. 26
These reviews underscore not only the importance of further research in the area of infant feeding practices and subsequent infant weight gain but also the need to adopt more sophisticated methods for modeling infant growth trajectories. Methods are needed that can more easily quantify the effects of time-varying predictors, such as breastfeeding duration or age at complementary food introduction, as well as rule out reverse causality. This analysis demonstrates that growth curve modeling provides an excellent framework for directly quantifying growth velocity, variability in velocity, and the effects of time-varying predictors. Meanwhile, growth velocity estimates from such models can be used as covariates in survival analysis models to test reverse causality hypotheses.
Subjects and Methods
This article reports secondary analyses from a multisite, longitudinal randomized controlled trial 27 (registered as ACTRN12610000415000 at www.anzctr.org.au) designed to test the efficacy of the Healthy Babies intervention at improving maternal responsiveness, feeding style, and infant feeding practices. Following baseline data collection, participants were assigned to either the intervention or control group through minimization that treated county recruitment location as the sole balancing covariate.28,29 Follow-up data collection occurred when the infant was about 6 and 12 months of age. This secondary analysis pooled data for the intervention and control groups into a single cohort as infant growth trajectories did not differ between groups. *
Sample size planning for the original study was described in the published protocol. 27 The researchers deviated from the published protocol by recruiting additional participants to offset unexpectedly high attrition. A convenience sample of 547 low-income mothers of infants living in Colorado (N = 231) and Michigan (N = 316) was recruited through community agencies providing services to pregnant women and mothers of infants [i.e., Expanded Food and Nutrition Education Program, the Supplemental Nutritional Assistance Program (SNAP), and the SNAP for Women, Infants, and Children]. Enrollment occurred between January 26, 2010 and June 12, 2012. Data collection occurred from February 11, 2010 through September 25, 2013.
The study protocol's inclusion criteria specified that mothers had to be (1) over 18 years old, (2) low income (defined as <185% of the federal poverty level and thus eligible for federal food assistance programs), and (3) willing and able to provide informed consent. Infant criteria included (1) being <4 months old at screening, (2) not introduced to complementary foods at the time of screening, (3) having a full-term low-risk birth (defined as 37–42 weeks gestational age) † , and (4) weighing between 2500 and 4000 g at birth. Recruiting some mothers during pregnancy led to a minor deviation from the intended birth weight criterion (7% of the infants weighed 1701–2499 g and 7% weighed 4001–4734 g, but all were healthy full-term births). Exclusion criteria included (1) infants with male caregivers ‡ and (2) mothers and/or infants diagnosed with feeding or eating disorders. Table 1 summarizes participant characteristics.
Infant and Maternal Characteristics
A small percentage of babies did not fit the intended birth weight and infant age inclusion criteria because some pregnant women were recruited before the birth of their babies. All babies deviating from the birth weight criterion were considered healthy and full term. Mothers were recruited if their due date was past their 18th birthday; however a few delivered just before their 18th birthday.
Anthropometry
Participants reported infant length and weight at birth; trained data collectors measured infant weight and recumbent length at baseline and 6- and 12-month follow-ups. Infants were weighed wearing a clean diaper on an electronic scale, rounded to the nearest half ounce. Infant BMI calculations followed the Centers for Disease Control's guidelines. 30 Infant weight, length, and BMI were standardized to z-scores measuring weight-for-age z-score (WAZ), length-for-age z-score (HAZ), and BMI-for-age z-score (ZBMI), using WHO Anthro software. 31 For interpretation, z-scores were converted to percentiles.
Feeding Practices
An instrument developed by the authors assessed infant feeding practices. Infant feeding practices assessed included if and for how long the infant was breastfed (at each time point participants were asked if they were still breastfeeding and if not to report approximately how long the infant had been breastfed in the past) and when complementary food introduction occurred. Complementary foods were defined as providing anything other than breast milk or formula, including cereal mixed in formula or breast milk.
Statistical Analyses
We used survival analyses to (1) estimate selected quantiles for breastfeeding termination age and age at complementary food introduction and (2) test for “reverse causality” by examining whether higher infant ZBMI at birth and higher ZBMI growth velocity predicted earlier breastfeeding termination or earlier introduction of complementary foods. All survival models measured ages in days; we divided by 30.4375 to report estimates in months.
Breastfeeding termination age was precisely measured but some observations were right censored (i.e., some infants were still breastfeeding at their last observations, so we know only that their termination ages must be greater than their ages at those observations). Breastfeeding termination age was analyzed with a semiparametric Cox survival model because the assumptions of various parametric models were untenable. Because age at complementary food introduction was interval censored, it was analyzed with a parametric accelerated failure time model based on the Weibull distribution.
We used growth curve models
32
to analyze the infants' ZBMI, WAZ, and HAZ trajectories across four observations (birth, baseline, and 6- and 12-month follow-up) as a function of time-varying predictors [infant age, time since breastfeeding termination (TimeBT), and time since introducing complementary foods (TimeCF)]. Both TimeBT and TimeCF were coded 0 at all observations before the respective events. The ZBMI model was:
The random effect u0i on the intercept (γ00, the average value at birth) captured individual variations in ZBMI at birth. The random effect u1i on the age slope (γ10, the average growth velocity) captured individual variations in growth velocity among infants. These random effects quantify the heterogeneity of infant growth trajectories. The age slopes (γ10 + u1i) are initial growth velocities relative to the WHO growth charts [in z-score units per month (zpm)] for breastfed infants who have not yet been introduced to complementary foods, while the breastfeeding termination and complementary food introduction slope coefficients (γ11 and γ12, respectively) represent postevent changes in growth velocity (i.e., upward or downward trajectory deflection in zpm). We estimated adjusted average growth velocities for infants under different combinations of feeding practices (before vs. after breastfeeding termination and before vs. after introduction of complementary foods) using contrasts. The random effects for each infant (u0i and u1i, which are centered on the average intercept and average slope, respectively) became predictors in the survival models. We report marginal and conditional R2GLMM to quantify variance explained. 33
We graphed two predicted growth trajectories for average infants (random effects u0i = 0, u1i = 0). In one, they stop breastfeeding and are introduced to complementary foods at the sample median ages for these events (from respective survival analyses). In the other, they are introduced to complementary foods at 6 months and continue breastfeeding until 12 months (i.e., complied with feeding guidelines).
Data management was conducted with SPSS version 23 (IBM Corp, Armonk, NY). All analyses were conducted with R version 3.3.3 and a few R packages.34–40 Survival models were estimated with the coxph and survreg functions from the survival package.41,42 Growth curve models were estimated with the lmer function in the lme4 package. 43 We report 95% confidence intervals (CIs) throughout the results. The corresponding author can provide materials for reproducing the results.
Results
Although none of the infants had been introduced to complementary foods at screening and therefore met the eligibility criteria, 20% were already introduced to complementary foods at baseline. About half the infants (54%) were currently breastfeeding at baseline (although 82% had been breastfed at some point). Table 2 shows cross-tabulations of infants' current and lifetime breastfeeding status with complementary feeding status.
Current and Lifetime Breastfeeding Status by Complementary Food Status at Baseline
One can infer that infants who had not yet been introduced to complimentary foods and who were not breastfeeding were exclusively formula fed. All percentages use the total sample size (N = 547) as the denominator.
The breastfeeding termination age survival analysis without covariates shows that 25% of the mothers stopped breastfeeding by the time their infants were 0.1 month old (CI = 0.1–0.6), 50% stopped by 2.0 months (CI = 2.0–2.5), and 75% stopped by 6.0 months (CI = 5.0–9.5). § The age of complementary food introduction survival analysis without covariates shows that 25% of the infants were introduced to complementary foods by 2.0 months (CI = 1.8–2.2), 50% by 3.0 months (CI = 2.8–3.2), and 75% by 4.2 months (CI = 3.9–4.4).
Parameter estimates for ZBMI, WAZ, and HAZ growth models are shown in Table 3. The age-adjusted nature of ZBMI means that average infants on the WHO growth chart would have ZBMI = 0 at birth (γ00 = 0, u0i = 0) and individual growth velocities of exactly zero (γ10 = 0, u1i = 0) because they would stay at the same ZBMI score as they got older. The ZBMI intercept (γ00 = −0.521, CI = −0.620 to −0.422, p < 0.001) shows that infants in this sample were on average about half a standard deviation leaner than the WHO average at birth. The intercept random effect suggests that 95% of the infants' birth ZBMI scores (γ00 + u0i) fall in the [−2.00 to 0.96] range.
Growth Curve Models Regressing ZBMI, WAZ, and HAZ on Age, Time since Breastfeeding Termination, and Time since Complementary Food Introduction
All growth curve models were estimated through restricted maximum likelihood (REML) using a sample of Ni = 547 infants. Marginal R2GLMM is the variance explained by the fixed effects; conditional R2GLMM is the variance explained by the entire model (both fixed and random effects). 41
BF, breastfeeding; CF, complementary foods; Est, estimate; HAZ, length-for-age z-score; No, number of longitudinal observations; WAZ, weight-for-age z-score; ZBMI, BMI-for-age z-score.
Infants who were still being breastfed and had not been introduced to complementary foods (γ10 = 0.050, p = 0.118) had an average ZBMI growth velocity of 0.050 zpm (CI = −0.013 to 0.113), indicating that they were growing slightly faster than expected according to the WHO growth charts, but not significantly so. The age slope random effect suggests that 95% of the infants' individual growth velocities (γ10 + u1i) fell in the [−0.08 to 0.18] zpm range.
Terminating breastfeeding had a negligible effect on ZBMI growth velocity (γ11 = 0.001, p = 0.927), increasing it by a mere 0.001 zpm (CI = −0.027 to 0.030). Thus, children who were no longer being breastfed but had not been introduced to complementary foods (i.e., exclusively formula fed) had an average growth velocity of 0.051 zpm (CI = −0.027 to 0.130), a rate that does not differ from the WHO growth velocity charts (p = 0.311).
The CI for the complementary food introduction effect was wide enough to encompass zero (γ12 = 0.033, CI = −0.034 to 0.100, p = 0.334), suggesting that it was itself not significant. However, the postcomplementary food introduction adjusted growth velocities were nevertheless significantly larger than zero both before and after breastfeeding termination (0.083 zpm, CI = 0.052–0.114, and 0.084 zpm, CI = 0.064–0.105, respectively, p's < 0.001). This counterintuitive result occurs because the adjusted velocities are estimated by contrasts that sum multiple parameters (Table 3). Adding the complementary food introduction effect to the initial velocity increases the point estimate, decreases the standard error, and narrows the resulting CI. These factors nudged the adjusted velocity's lower CI bound above zero. Therefore, these infants' ZBMI scores began increasing noticeably faster than expected according to the WHO growth charts after introducing complementary foods.
Figure 1 illustrates the infant growth curve trajectories. Both trajectories indicate substantial cumulative change in ZBMI over 15 months, rising from the 30th to the 74th and 70th percentiles, respectively. This suggests that delaying complementary food introduction from the observed median age of 3.0 months to the recommended age of 6 months would reduce BMI-for-age percentile at 15 months by about four points. Marginal and conditional R2GLMM values reveal that the fixed effects explain only about 7% of ZBMI variance, while the fixed plus random effects together explain 42%.
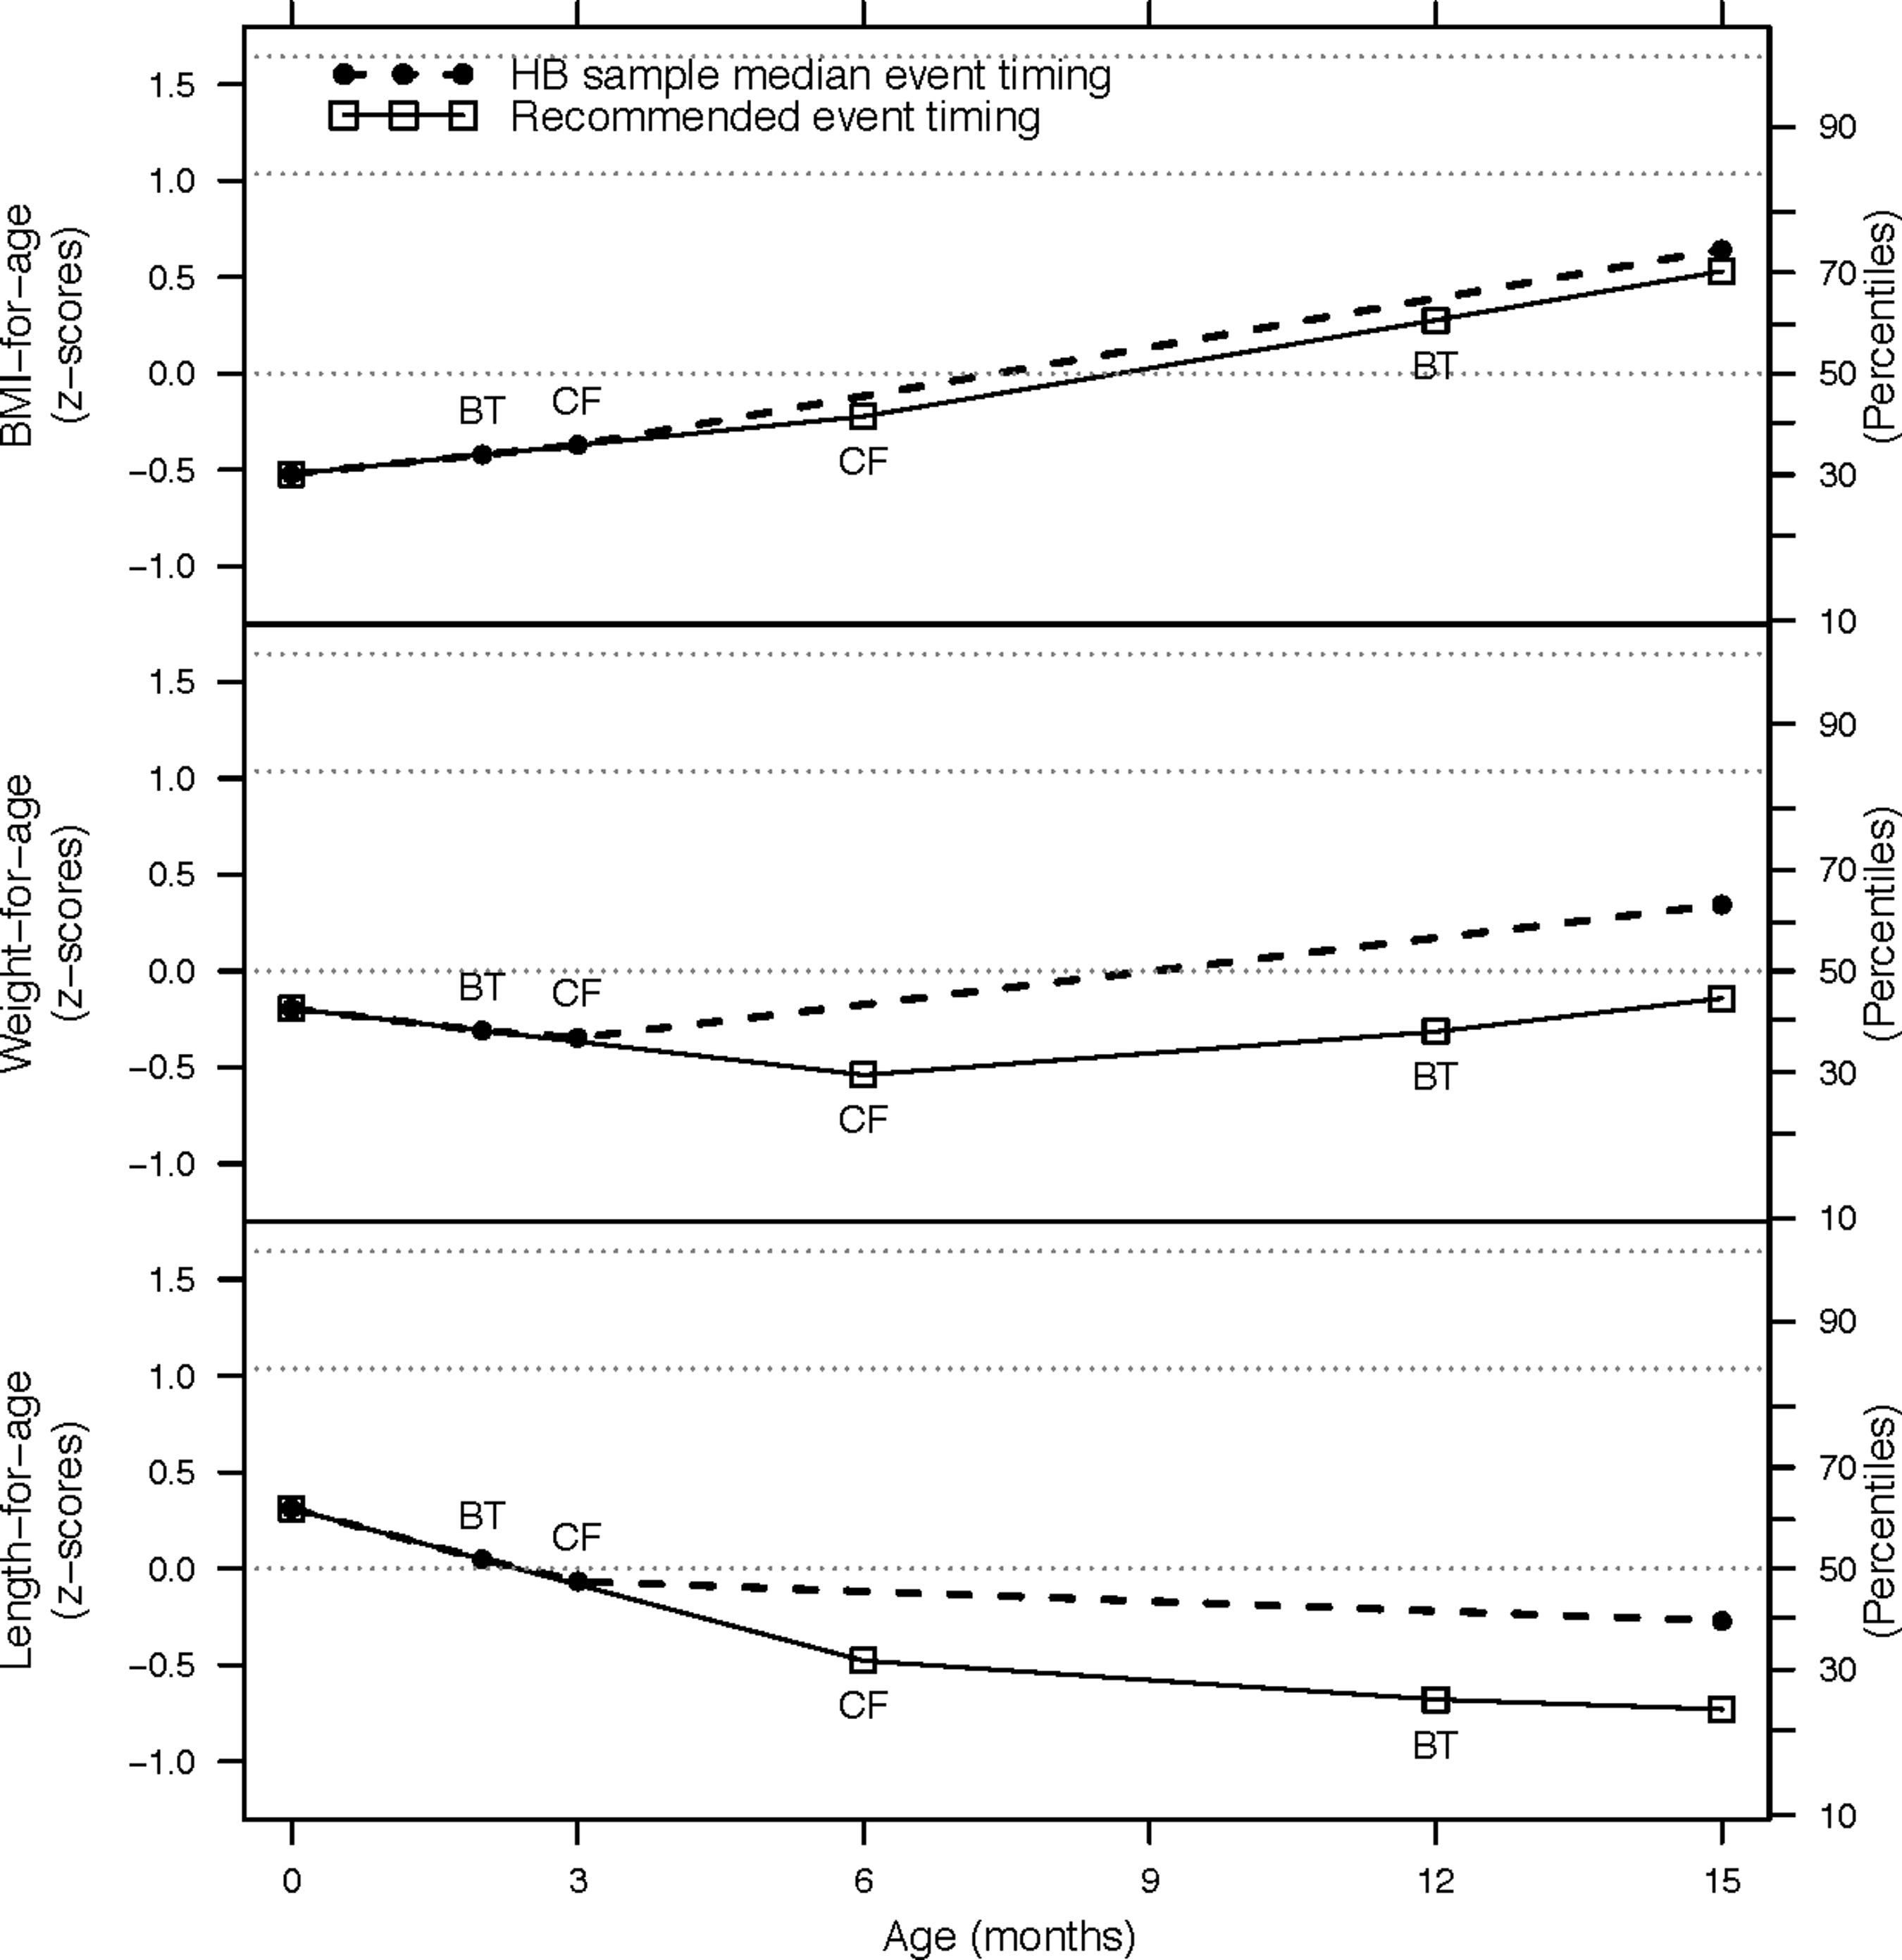
Predicted ZBMI, WAZ, and HAZ growth curves as a function of age for an average infant under two event timing scenarios for breastfeeding termination and complementary food introduction. The two event timing scenarios include one consistent with the median timing of events in this Healthy Babies study sample (circles, breastfeeding terminated at 2 months, complementary foods introduced at 3 months) and another consistent with recommended feeding guidelines (squares, complementary foods introduced at 6 months, breastfeeding terminated at 12 months). Dotted horizontal reference lines are at the 50th, 85th, and 95th percentiles for each outcome. BT, breastfeeding terminated; CF, complementary foods; HAZ, length-for-age z-score; WAZ, weight-for-age z-score; ZBMI, BMI-for-age z-score.
Table 4 shows that neither covariate improved prediction in the survival models regressing breastfeeding termination age and age at complementary food introduction on initial ZBMI and initial ZBMI growth velocity. The models suggest that infants with high growth velocity (u1i = 0.11 zpm) ** have the same median breastfeeding termination age (2.0 months, CI = 0.6–4.0) as average infants from the sample (2.0 months, CI = 2.0–2.5), although their CI is wider. Similarly, such infants have a median age of complementary food introduction of 2.6 months (CI = 2.1–3.4) that is only slightly lower compared with average infants (3.0 months, CI = 2.8–3.2). These findings are inconsistent with the reverse causality hypothesis.
Survival Model Testing for Reverse Causality by Regressing Breastfeeding Termination Age and Complementary Food Introduction Age on ZBMI at Birth and ZBMI Growth Velocity
Both survival models were estimated with the survival package in R version 3.3.3. BF termination age was analyzed with a Cox model (coxph function) and yielded R2 = 0.003; CF introduction age was analyzed with an accelerated failure time model (survreg function) using a Weibull distribution. Both age variables were measured and modeled in units of days; we converted selected estimated ages predicted by the model to months (30.4375 days/month) for reporting purposes.
CI, confidence interval; HR, hazard ratio; LRT, likelihood ratio test.
Discussion
This secondary analysis demonstrated the utility of growth curve models with time-varying predictors for accurately quantifying and visualizing postevent changes in infant BMI z-score growth velocity after two key changes in feeding practices (breastfeeding termination and introduction of complementary foods). Model predictions allowed comparison of expected trajectories for an average child in the sample under varying assumptions about the timing of those events. We focused on what would happen if feeding practice changes were delayed from times typical for this sample to times more compliant with current infant feeding guidelines. The results in Figure 1 suggest that delaying complementary food introduction would reduce BMI-for-age percentile at 15 months by about four points. The cumulative effect of delaying complementary food introduction by a few months is modest because that event only increased velocity by a small amount.
Although breastfeeding termination alone had a negligible effect on growth velocity, adjusted growth velocities for infants being fed complementary foods (both breastfed and nonbreastfed) were significantly different from expectations based on WHO growth charts. This finding can be corroborated with two recent studies supporting timing of complementary food introduction as a more potent indicator of obesity risk than breastfeeding.44,45 Nevertheless, there are other important reasons for extending breastfeeding duration, such as protection against otitis media. 46 In addition, due to limitations in the original questionnaire, the effects of exclusive vs. nonexclusive breastfeeding could not be assessed in this study, a fact that may have contributed to the results' lack of potency.
The discrepancy between marginal and conditional R2GLMM shows that modeling individual variability in ZBMI at birth and ZBMI growth velocity is important. The fixed effects in the ZBMI model account for only 7% of the variance. This suggests that breastfeeding duration and timing of complementary food introduction play only a small part in explaining the rapid increase in BMI-for-age in this sample. Growth curve models can easily accommodate additional time-invariant and time-varying predictors to further explain individual variation in initial scores or growth velocity. For example, modeling refined time-varying covariates such as exclusive breastfeeding duration, caloric intake, or diet quality could reduce the longitudinal residual error and further aid intervention strategies.
One important strength of these models is the ability to treat breastfeeding termination and timing of complementary food introduction as continuous rather than categorical variables to allow easier comparison between studies. Another strength is the ease of using survival models to rule out reverse causality by simply testing whether growth velocity estimates predict the timing of those events. These strengths address concerns in the WHO and Vail et al. literature reviews, respectively.22,25
A limitation of this study was the inability to determine exclusive breastfeeding duration in addition to the duration of any breastfeeding. Further study is needed to test the effect of exclusive breastfeeding duration on infant growth trajectory. Additional limitations include the lack of control for gestational age or maternal BMI and the small number of longitudinal assessments per infant. More assessments would increase statistical power and precision and facilitate modeling a greater variety of possible growth curve shapes.32,47 As with many longitudinal studies, attrition was higher than originally anticipated.
Although slight, our analysis does support a protective effect of following the AAP and WHO infant feeding recommendations on obesity risk. A recent nationally representative sample found that 74% of mothers introduce their infants to complementary foods before 6 months of age, while a separate study found that 40% of sampled caregivers introduced complementary foods before 4 months.48,49 Providing additional support for recommended infant feeding practices, particularly the ideal age at which to introduce solid foods, is essential and may increase compliance. Using the proposed model in a larger study could help provide more accurate estimates of the association between infant feeding practices and rapid weight gain. Such information could be used to refine early obesity prevention interventions targeting infant feeding practices.
Footnotes
Acknowledgments
This project was funded by the USDA of National Institute of Food and Agriculture, No. 2009-55215-05220. The authors extend their appreciation to the county Extension EFNEP staff from Michigan and Colorado for their participation in the Healthy Babies research study and to the other research team members: Drs. Susan Baker, Holly Brophy-Herb, Laurie Van Egeren, and Garry Auld. A special thanks to all of the mothers and infants who participated in this study. The authors also thank two anonymous peer reviewers for their helpful comments. The trial registration number for this study is ACTRN12610000415000.
Author Disclosure Statement
No competing financial interests exist.
*
The control group received an alternative educational program (rather than none at all). This may have weakened the intervention effect.
†
This criterion was implemented as planned, but 48 (9%) of the infants were born at 37 weeks gestation.
‡
Original outcomes included breastfeeding duration. Recruitment outlets primarily comprised women and children. Male caregivers were encouraged to attend intervention sessions with their partners.
§
Point estimates for the 25th and 50th quantiles are identical to the lower bounds of their respective confidence intervals because ties (infants with the same breastfeeding termination age) make the survival curve and the curve for its lower confidence limit overlap at those quantiles.
**
The largest observed value for an individual's deviation from the average growth velocity in our ZBMI growth model was u1i = 0.11. For simplicity, we assumed that this high growth velocity is paired with average initial ZBMI (u0i = 0.00).