




Abstract
Background:
Salivary alpha-amylase (sAA) initiates the digestion process in the mouth and its levels might influence feelings of hunger and the propensity toward obesity. This study aims to evaluate basal differences in sAA between adolescents with excess weight (EW) and normal weight (NW), and the associations between sAA levels and feelings of hunger after viewing food images.
Methods:
Adolescents (13–18 years old) classified as EW (n = 30) or NW (n = 30) participated in the study. Saliva samples were collected before the administration of a food-choice task. Hunger was evaluated before and after the food-choice task.
Results:
EW adolescents showed lower basal sAA levels than NW adolescents and a greater increase in hunger levels after viewing food images. In addition, sAA levels had a significant inverse relationship with the increase in hunger in EW adolescents, but not in NW adolescents. Finally, significant inverse associations between sAA, BMI, and body fat percentage were found.
Conclusions:
Levels of hunger and changes therein, after viewing food are dependent on sAA levels in EW adolescents. This finding indicates that sAA levels may be a mediator of feelings of hunger in individuals with overweight in the context of viewing food cues, suggesting the utility of the sAA enzyme as a marker of hunger and propensity toward obesity.
Introduction
Obesity is one of the most common chronic health risk factors; its prevalence continues to rise rapidly in children and adolescents, and it leads to several long-term health complications.1,2 Adolescence is a particularly high-risk period for weight gain because of the interaction of natural metabolic changes with behavioral risk factors. 3 Weight gain during adolescence is a major risk factor for adult obesity and metabolic syndrome. 4 Our “obesogenic” food environment is characterized by a plentiful supply of appetizing, high-energy, and low-priced food that is constantly accessible and aggressively promoted.5,6 Maintaining a healthy weight has become a difficult challenge in such an environment.
The processes regulating eating behavior are complex and comprise chemical, sensory, behavioral, homeostatic, and hedonic mechanisms, controlled by hunger and satiety signals in peripheral and central pathways.7–9 Regarding endocrine systems, some peptides and proteins, like leptin, insulin, ghrelin, and peptide YY provide information about metabolic physiology, and can therefore be used as biomarkers of eating behavior regulation and obesity.10,11
One such potential biomarker of eating behavior regulation is salivary alpha-amylase (sAA).12–14 Alpha-amylase, an enzyme present in many tissues, hydrolyses bonds of large polysaccharides, like glycogen and starch, yielding larger amounts of small molecules such as maltose and glucose. Alpha-amylase is found in saliva (i.e., ptyalin) and it starts the food digestion process in the mouth by breaking polysaccharides into progressively more simple soluble molecules (erythrodextrin, achrodextrin, and amylodextrin) to ultimately produce maltose and glucose. 15 Levels of sAA, through its influence on carbohydrate metabolism and digestion, may influence hunger levels and obesity predisposition.
There are polymorphisms present in the human genome encoding for sAA, in which between-subject differences in the number of copies can be observed. The number of gene copies is positively associated with levels of sAA. 16 A reduced number of copies in the sAA gene is associated with increased adiposity, BMI, obesity risk, 17 and metabolic abnormalities18,19 and with reduced preabsorptive insulin release. 20
Furthermore, recent studies have confirmed that in a food intake-related context, higher sAA levels are associated with a physiological measure of perceived satiety.21–24 In individuals with lower sAA levels, the digestion of carbohydrates will be slow, which would serve to maintain high levels of hunger over a longer period, leading to greater food consumption before achieving satiety. In the long term, this would increase the propensity toward obesity. BMI has also been found to be negatively correlated with average morning sAA levels. 25
This study aims to evaluate basal sAA differences between excess weight (EW) and normal weight (NW) adolescents, and the association between sAA and subjective hunger levels after viewing food images. Most studies have focused on the role of sAA as a biomarker of hunger after food consumption21–24 ; however, to date, very few studies have analyzed the association between sAA levels and feelings of hunger in a food-cue display context. Furthermore, no research has focused on evaluating sAA in adolescents with EW, and most recent studies have been focused on the number of copies of the sAA gene, with few directly comparing sAA levels between groups differing in body weight. 16 Given that lower sAA levels slow down the digestion of carbohydrates, low-glucose (pre-eating) levels would be maintained for longer, thus stimulating further eating. In this context, and according to the previous evidence, we hypothesize that sAA levels will be lower in excess than in NW adolescents and that levels of hunger, and changes therein, during the viewing of food images will be associated with sAA levels, with lower sAA being related to greater feelings of hunger in both groups.
Methods
Participants
The participants were 60 adolescents (25 male and 35 female participants) recruited between September and February 2017 from high schools in Jaén, Spain. They were all 13–18 years of age, and were selected based on their age-adjusted BMI percentile following the guidelines of the International Obesity Task Force criteria. 26 Adolescents with NW (n = 30) had age-adjusted BMI values between the 5th and 84th percentiles, and adolescents with EW (n = 30) had age-adjusted BMI values above the 85th percentile. Age, sex, BMI, and body fat percentage data are given in Table 1. The inclusion criteria were as follows: (1) age between 13 and 18 years and (2) no history of neurological, psychiatric, or eating disorders. All participants had normal or corrected to normal vision. This study was approved by the Ethics Committee of the Universidad de Jaén and the procedures followed were in accordance with the Declaration of Helsinki, 1975, as revised in 2008.
Participants' Sociodemographic Characteristics, BMI, and Body Fat Percentage
Value of Student's t-test.
Value of chi-squared test.
SD, standard deviation.
Saliva Sampling and sAA Analysis
The participants were instructed not to smoke, eat, or drink coffee for at least 1 hour before the experiment. All the experimental sessions were conducted at the same time of the day (4–5 pm). Saliva samples were collected by spitting directly into disposable glass-capped tubes (75 × 12 mm) set in a small polystyrene container suitable for storage in a freezer compartment.27,28 All tubes were labeled and dated after sample collection and stored at −20°C until analysis.
Saliva samples were diluted at 1:500 in bi-distil water after each sample was defrosted once. The sAA levels were analyzed by an enzymatic colorimetric assay using a Dimension Vista system. 29 Previously, two saliva pools were created with high and low concentrations of sAA activity; these were used as controls for each assay. The intra- and interassay coefficients of variability for sAA levels were <10% in our analysis. The obtained values are markers of enzymatic sAA levels in saliva (arbitrary units; U/mL). 30
Food-Choice Task
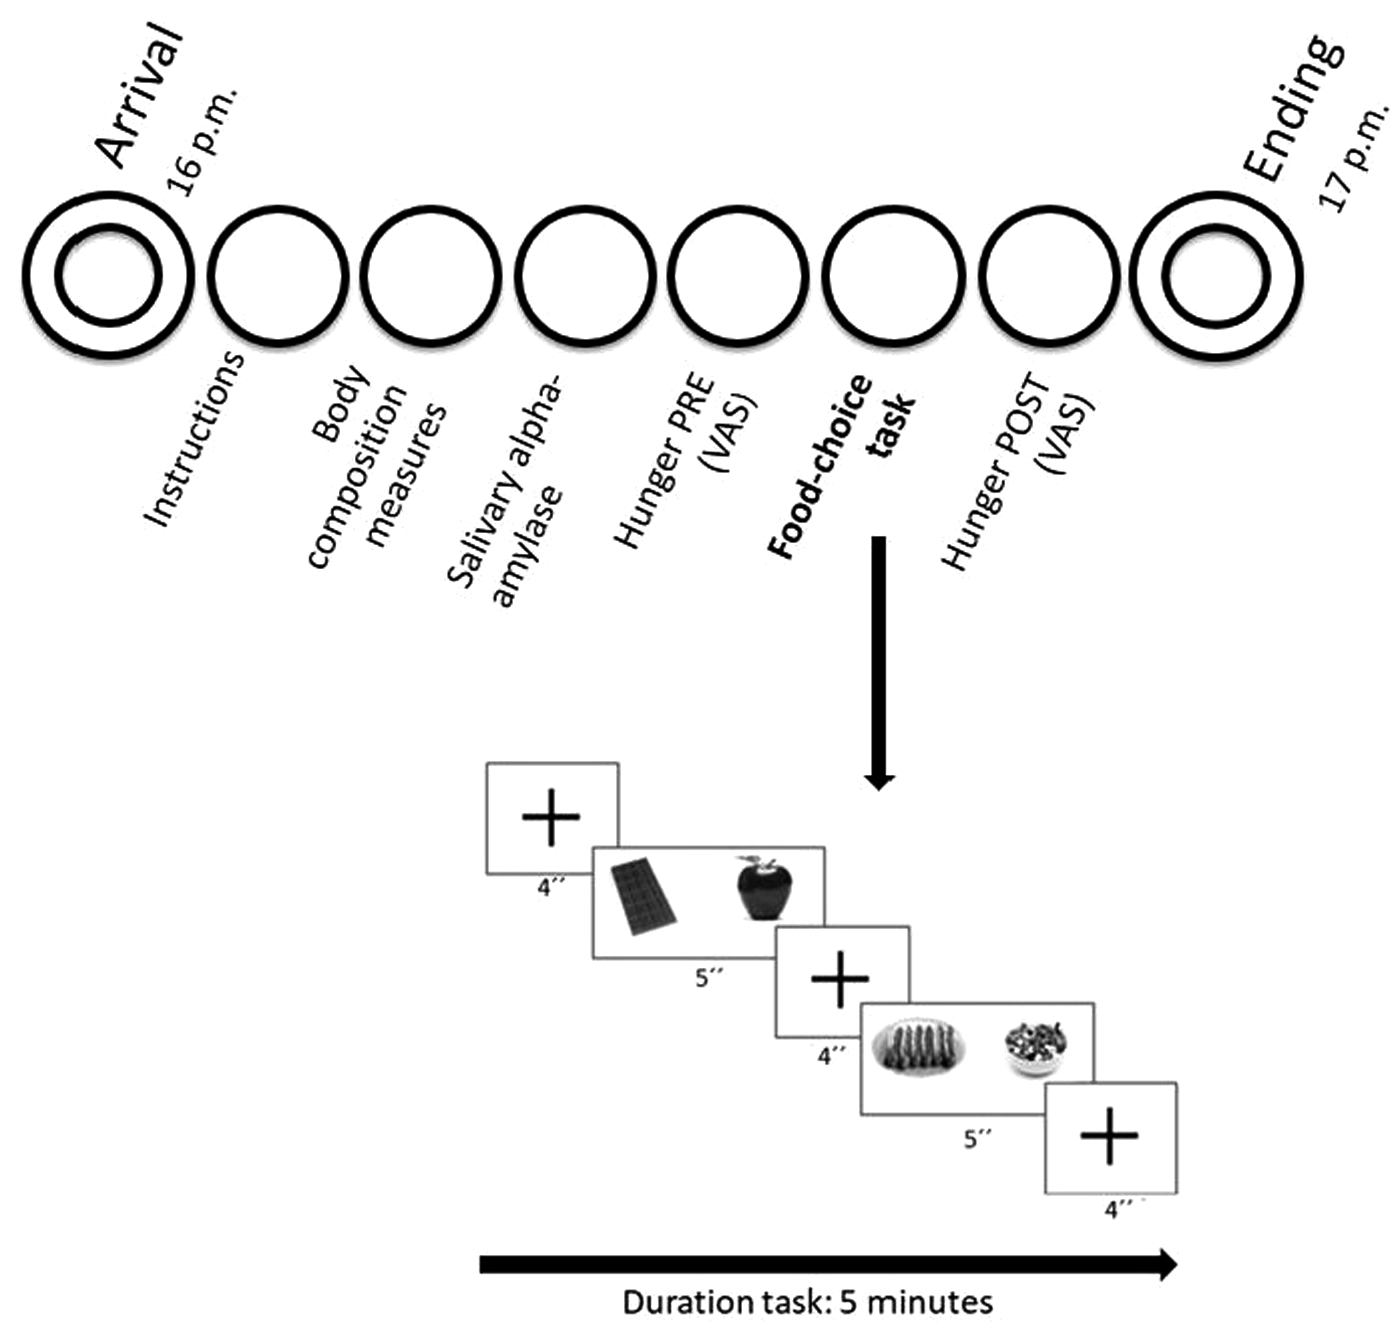
A food preference task was used in this study. Two types of food pictures were used: appetizing (high levels of fats and/or sugars) and healthy. All pictures were acquired ad hoc for the study under standardized presentation and lighting conditions. Therefore, all images were matched for visual properties (size, brightness, clarity, and contrast) and size (∼1 standardized portion for all images). The appetizing food images included sausages and chocolate, whereas fruits and salads were presented among the healthy food images. In each trial, pairs of these different types of food images were presented according to three conditions (appetizing vs. healthy, appetizing vs. appetizing, and healthy vs. healthy). Participants had to choose between the two possibilities on each trial by pressing a key on a computer keyboard. The total duration of the task was ∼5 minutes. Each trial began with a fixation cross, presented for 3–6 seconds (i.e., varying among trials). Then, the two food images appeared side-by-side on the screen for 5 seconds, with the positions of the appetizing and healthy foods (left or right side) varying among trials. The order of presentation of the pictures was counterbalanced across the adolescents. Subsequently, the fixation cross was presented again. The task was composed of a total of 30 choice trials (10 elections for each condition) preceded by four training trials.
Procedure
Figure 1 provides a schematic representation of the experiment. After obtaining permission from the high school's directors, the study was described to individual classes of students and their participation was requested. Students who were interested in taking part sent us a signed informed consent form (signed by their parents if they were minors). Then, the participants were assigned to an experimental group, and a specific day on which to complete the experimental session. Sessions started at 4 pm, and participants were required to be satiated (having had lunch about 1 hour before) and to not have taken any caffeine. Weight and height were self-reported by participants for recruitment purposes, and BMI was calculated in the laboratory using the height and weight data collected on arrival. Body composition parameters were also measured, using the Bodystat®1500 monitoring unit. Subsequently, saliva samples were acquired over ∼5-minute period. Then, participants performed the food-choice task. A visual analog scale (VAS) was used to rate subjective hunger levels, on a scale ranging from 1 (not hungry) to 10 (very hungry). The VAS was completed before (pretask) and after completion of the food-choice task (post-task). The total duration of the study was ∼1 hour. This study formed part of a larger investigation of the effects of hunger levels on risk taking in adolescents. A more detailed description of the study procedure can be found elsewhere. 31
Statistical Analyses
No deviation from normality or homogeneity of variance was observed in the hunger and sAA level data (all p-values <0.05 on both the Kolmogorov–Smirnov and Levene tests). Group comparisons were carried out with Student's t-test for independent samples. Hunger levels were analyzed by repeated-measures analysis of variance with time (pre- and post-task) as the repeated-measure factor and group (EW vs. NW) as the between-subject factor. In addition, analysis of covariance (ANCOVA) was performed including the covariable sAA, to assess its influence on hunger change, pre- vs. post-task. Correlations between variables were analyzed by Pearson's product–moment correlation coefficient. To simplify the analyses, hunger change scores were calculated as the post-task value minus the pretask value.
Results
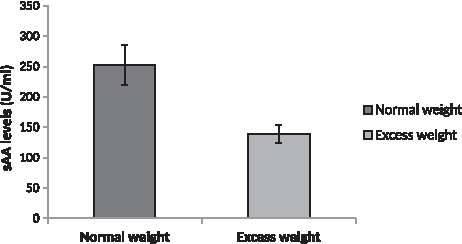
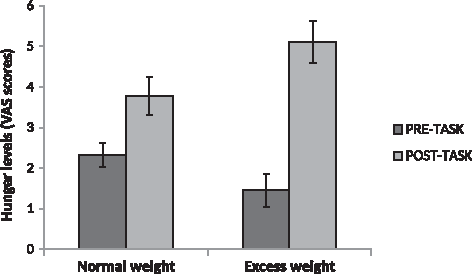
Group differences were found in sAA levels (t = −3.13, p = 0.003, δ = −0.82), with adolescents with EW displaying lower sAA levels than the NW adolescents (Fig. 2). Group differences in hunger levels did not reach significance in either the pretask (t = 1.75, p = 0.086, δ = 0.45) or post-task (t = −1.94, p = 0.057, δ = −0.5) evaluation (Fig. 3). However, a time × group interaction was found for VAS hunger scores (F(1,58) = 10.82, p = 0.002,
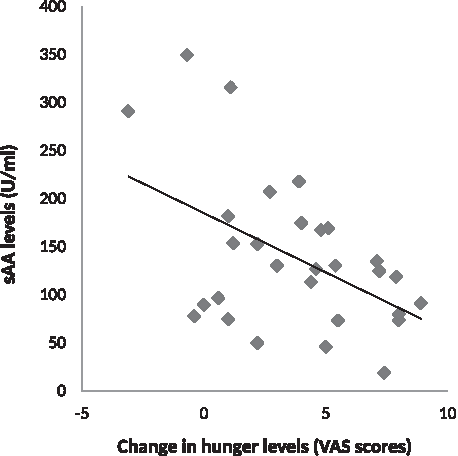
The ANCOVA revealed a sAA × group × time interaction (F(1,55) = 4.64, p = 0.014,
Discussion
Our results showed that adolescents with EW had lower basal sAA levels than NW adolescents. Furthermore, adolescents with EW displayed a greater increase in hunger levels (VAS scores) after viewing food images task than the NW adolescents. In addition, sAA levels had a significant inverse association with the change in hunger level in adolescents with EW, but not in NW adolescents. As expected, levels of hunger and changes therein during the viewing of food images were dependent on sAA levels, with lower sAA being associated with greater feelings of hunger. However, this was observed only in adolescents with EW. Finally, among the whole sample, significant inverse associations between sAA, BMI, and body fat percentage were found.
These results corroborate previous findings suggesting a negative association between BMI and sAA levels. Reduced copy numbers of the gene encoding for sAA have been reported in people with obesity,16–18 with evidence of an inverse association between enzymatic sAA levels and BMI emerging over a 9-year follow-up period 16 implying a possibly causative effect of sAA levels on decreased adiposity. However, until now no research had compared sAA levels between EW and NW adolescents.
Given the function of sAA in carbohydrate catalysis, increased sAA levels are associated with more rapid and effective carbohydrate digestion. Therefore, the serum glucose level rises more quickly and chemical satiety signals are generated earlier. Accordingly, sAA has been considered as a potential measure of satiety in food-related contexts.21–23 Chemical satiety signals include peptides, such as cholecystokinin, glucagon-like peptide 1, and peptide YY. These signals travel from the stomach to the brain; specifically, the hypothalamus receives and integrates this information to stimulate both satisfaction and satiety, thus controlling the duration of food intake episodes (i.e., volume of food ingested). 32 In individuals with lower sAA levels, the catalysis of carbohydrates will be slower, such that the low predigestion levels of glucose are maintained for long, thereby favoring greater food consumption. In the long term, these lower sAA levels synergize with learning and the consolidation of habitual eating patterns, thus potentially leading to obesity.
Our results are coherent with previous studies suggesting an association between sAA and perceived satiety in food-related contexts.21–23 Harthoorn 23 reported that sAA systematically increased upon food consumption and satiation, and therefore serves as a potential measure of satiety and subsequent food intake. Our results showed that sAA was negatively associated with both the change (increase) in hunger and hunger feelings after the food-visualization task, but not with hunger levels before the task. Furthermore, sAA levels were associated with the change in feelings of hunger in adolescents with EW, but not in adolescents with NW. This finding could be explained by the fact that individuals with EW maintain low glucose levels for long because of lower sAA levels, which favors an increase in feelings of hunger, and thus potential subsequent overeating. Furthermore, the literature shows that adolescents with overweight and obesity are more sensitive to food cues, and are thus more likely to respond to them.33–36
Previous studies have reported a positive association between sAA levels and feelings of satiation after food consumption.21–23 Our results showed a negative association between sAA levels and feelings of hunger after, but not before, viewing the food images in adolescents with EW. Therefore, our findings also indicate the special relevance of sAA to feelings of hunger evoked by viewing food images. Because these associations, and the mediating effect of sAA, were seen only in the adolescents with EW, sAA levels may influence the feelings of hunger and eating behaviors evoked by external cues in this population specifically. These results are innovative, where no previous study has explored the role of sAA in the context of viewing food images, nor its potential mediating effect on feelings of hunger.
Alpha amylase parameters have been shown to be associated with diabetes and metabolic abnormalities. Furthermore, a low serum amylase level was identified in diabetic patients (mainly those with insulin-dependent diabetes; type 1 diabetes).37,38 Another relevant mechanisms mediating sAA levels in adolescents with EW may be the development of insulin resistance. Obesity can induce insulin resistance, where the resulting increased insulin levels elicit dose-dependent stimulation of the sympathetic nervous system (SNS). 39 The greater SNS activity and related increase in noradrenaline levels stimulate β-adrenergic receptors of the salivary parotid glands, in turn increasing sAA secretion. 40 Therefore, this mechanism would likely increase (not decrease) sAA levels in adolescents with EW.
Regarding the limitations of this study, there are a number of issues that need to be addressed in future studies. These include the inclusion of fasted and nonfasted conditions, differentiation between participants with obesity, overweight, and NW, and the inclusion of adult participants. One important improvement could be the inclusion of a second measure of sAA after the food image task, to better evaluate the effect of the task on sAA levels and the influence of the sAA on the change in feelings of hunger. Furthermore, future studies should evaluate the longitudinal effects of sAA levels on weight gain. The lack of a control group in this study makes it difficult to discern whether the changes in feelings of hunger were the result of the viewing of food cues or the mere passage of time. Future studies including an appropriate control group will be necessary to address this limitation. Finally, although the results of performed ANCOVA suggest a causal role of sAA, we do not certainly know whether the reduced sAA levels in EW adolescents are a cause, a consequence, or simply a marker of high BMI. Future studies using other methodological designs should address this issue.
In summary, the results of this study showed that adolescents with EW experienced a greater increase in feelings of hunger after viewing food images, and that the magnitude of this increase was inversely associated with basal sAA levels. In fact, sAA levels concentrations could have influenced the change in hunger after viewing food images in adolescents with EW. This finding indicates that sAA levels might be a mediator of feelings of hunger in the context of viewing food cues in people with overweight, in turn suggesting the utility of the sAA enzyme as a marker of hunger levels, eating behavior, and obesity.
Footnotes
Authors' Contributions
M.M.-P. and G.A.R.d.P. designed the study. M.M.-P. carried out the experiment and analyzed the data. All authors were involved in writing the article and gave final approval to the submitted and published versions.
Funding Information
This work has not received any funding.
Author Disclosure statement
No competing financial interests exist.