
Abstract
Background:
Subtypes of pediatric oncology patients and childhood cancer survivors who are overweight or obese have worse prognosis than their healthy-weighted peers. Several studies have examined weight status in either pediatric patients or survivors with acute leukemia, but few have compared these data across various diagnoses.
Objectives:
We examined BMI from oncology diagnosis or presentation, through treatment, and into survivorship across the most common cancer types seen in pediatric oncology.
Methods:
Patients were categorized into three oncologic diagnoses: leukemia and lymphoma (n = 69), neural tumors (n = 80), and non-neural solid tumors (n = 80) at yearly intervals over the course of 11 years. To allow for comparisons across age groups, BMI percentiles were calculated with <5th percentile classified as underweight (n = 11), the 5th–84th percentile classified as a healthy weight (n = 129), and above the 85th percentile classified as overweight and obese (n = 87).
Results:
At presentation, 45.6% of leukemia and lymphoma patients were overweight or obese, and 44.3% of neural tumor patients were overweight or obese. These high obesity rates persisted into survivorship. Compared to the non-neural tumor group, the leukemia and lymphoma group had a significant increase in BMI percentile over time, while the neural tumor group did not.
Conclusions:
Pediatric patients with leukemia, lymphoma, and neural tumors and who are overweight or obese at presentation continue this trend into survivorship, indicating a need for management of overweight and obesity through lifestyle interventions concurrent with therapy.
Introduction
Over the past three decades, childhood obesity has increased in the general population, with estimates indicating 31.6% of children 2–19 years of age were overweight or obese in 2011/2012.1,2 During this same time frame, the 5-year survival rate in pediatric oncology patients has risen from 58% in 1975 to 83% in 2011, yielding a growing population of childhood cancer survivors (CCS). 3 Obesity that develops or extends into the adolescent and young adult years is known to be strongly associated with several common adult health problems, including adult-onset diabetes mellitus, osteoporosis, cardiovascular disease, and certain cancers. 4 This is a global epidemic that extends into the pediatric oncology population. 5 CCS have been reported to have an increased risk, compared to siblings, of developing chronic conditions, including endocrine disorders, metabolic syndrome, obesity, cardiovascular disease, pulmonary disease, and secondary malignancies, all of which can be exacerbated by being overweight or obese.1,6,7 Pediatric leukemia patients who are overweight or obese have been shown to have higher resistance to cancer treatment and worse outcomes during therapy than their healthy-weighted peers, 5 highlighting a prognostic indicator that is potentially amenable to modification.
While the incidence of obesity at diagnosis and during survivorship has been well studied, there is little research regarding BMI in CCS from diagnosis through treatment and into survivorship across pediatric cancer types. In a study by Zee et al., an increase in weight gain by the end of therapy and during early follow-up periods was seen in childhood acute lymphocytic leukemia (ALL) survivors. 8 Winkler et al reported similar findings, showing weight trajectories in childhood patients with ALL of preschool age rapidly increased following diagnosis, and frequently persisted after therapy was complete. 9 Several more studies have replicated the finding that ALL survivors appear to be at risk for becoming overweight or obese by the end of therapy. 4 These data reinforce the importance of weight management in ALL, but fewer studies have examined whether similar trends occur in pediatric oncology patients more broadly.
The objective of this study was to examine BMI from oncologic diagnosis or presentation, during treatment, and into survivorship across all major cancer diagnoses in pediatric oncology patients. We performed a retrospective longitudinal evaluation of BMI percentiles in a cohort of childhood cancer patients and survivors over an 11-year period to evaluate BMI trends. The impetus for this evaluation was to identify when pathologic weight gain occurs to determine most impactful points of weight management intervention strategies for future studies. Furthermore, the population seen was racially and ethnically diverse, allowing assessment of associations between weight status and race. Our results show a surprisingly high rate of neural tumors and leukemia and lymphoma patients who are overweight and obese at presentation, which persists through treatment and into survivorship, highlighting a need for early interventions in the spectrum of pediatric cancer care.
Methods
This retrospective study was reviewed and approved by The University of Texas MD Anderson Cancer Center Institutional Review Board before data collection began (PA15-0925) and a waiver of informed consent was granted since no new data were collected for this analysis. We evaluated medical records of pediatric oncology patients at MD Anderson's Children's Cancer Hospital from 2003 through 2015. Annual measurements of height, weight, and BMI were extracted from records of clinical visits. The patients were categorized into three main oncologic diagnoses: leukemia and lymphoma, neural tumors, and non-neural solid tumors. (Table 1 shows the number of patients evaluated.)
Demographic Features of Population
The patients were categorized into three main oncologic diagnoses: leukemia and lymphoma (n = 69), neural tumors (n = 80), and non-neural solid tumors (n = 80) with percentage of the total number of patients (229) shown in parentheses. Mean, SD (shown in parentheses), and median were calculated for age at presentation for all diagnosis groups. Race is shown as the number and percentage in parentheses for each diagnosis group and the total for all diagnoses. Chart data only indicated race/ethnicity as black, white, Spanish Surname (Hispanic), or Other (none of the previous). The number and percentage in parentheses of males and females is shown for each diagnosis group and all diagnoses as a whole. This approach is repeated for pretreatment status (yes/no). The p-value was calculated and shown in the last column with a p-value <0.05 considered significant.
SD, standard deviation.
Eligibility Criteria
Eligible patients included pediatric cancer patients or survivors 5–12 years of age at presentation with data registered on The University of Texas MD Anderson's Electronic Information Warehouse (EIW). These age ranges were chosen to include a growth range that is monitored in clinical practice by BMI percentile and to ensure a minimum of 5 years of follow-up before transitioning out of pediatric care. Presentation at MD Anderson included new diagnoses and transfer of care or referral of pretreated patients from other institutions. As the goal of this study was to examine BMI percentile trajectory into survivorship, patients with <2 consecutive years of measurements or <5 years of survival were excluded from the analysis.
Statistical Evaluation
Demographics and baseline characteristics were summarized by descriptive statistics, including mean and median for continuous variables and frequency and proportion for categorical variables based on patients' cancer type. To associate multiple cancer diagnoses with continuous variables, we applied the Kruskal-Wallis test. The three main diagnoses were compared with baseline BMI percentile categories using chi-square tests. Since BMI continually increases in physiologic growth and our cohort included patients diagnosed across ages 5–12 years, BMI percentiles based on child age/sex were used for comparison. BMI percentiles were calculated using Epi Info (version 3.5.1, 2008; CDC, Atlanta, GA). In accordance with CDC growth charts, a BMI of <5th percentile was classified as underweight, the 5th through 84th percentiles were classified as a healthy weight, and the 85th through 99th percentiles were classified as overweight and obese. To track changes in BMI percentile over time, height, weight, BMI, and BMI percentile values measured at baseline and at each follow-up visit were summarized by mean and median. As only a small number of our patients were underweight at presentation, patients were categorized into two groups, underweight/normal vs. overweight/obese, based on their BMI percentile (<85th percentile vs. ≥85th percentile). The frequency and proportion of patients with different BMI categories were calculated for each cancer type.
Results
Our initial database search yielded 3279 potentially eligible patient records based on age alone. The majority (n = 2417) did not have consecutive height and weight measures and another 633 had <5-year survival. These records were excluded to allow for an in-depth examination of BMI percentile trajectory into survivorship. After screening for exclusionary criteria, 229 pediatric oncology patients from the period 2003 to 2015 were included in the analysis. Patients were categorized broadly by cancer type to identify trends within specific oncologic diagnoses. Of the 229 patients, 30.1% (n = 69) had leukemia or lymphoma, 34.9% (n = 80) had neural tumors, and 34.9% (n = 80) had non-neural solid tumors. The non-neural solid tumors included bone tumors (Ewing sarcoma and osteosarcoma; 51%, n = 41), rhabdomyosarcoma (19%, n = 15), Wilms tumors (11%, n = 9), and various other sarcomas and carcinomas (2%, n = 14 and 1, respectively).
Patient demographics were evenly distributed within cancer types with a predominance of Caucasian and Hispanic populations. To identify any associations between sex, race/ethnicity, pretreatment status, and cancer type, demographics were evaluated (Table 1). The average age of presentation was 8.56 years, with standard deviation of ±2.31 years; age was relatively consistent for all three cancer diagnoses. The proportion of boys to girls was 48%–52%, respectively, with no significant difference between genders in any of the three cancer diagnosis groups. There was a significant difference in the distribution of race among the diagnosis groups. While the majority of patients identified as white (50.7%), a significant portion (31%) identified as Hispanic with 7.9% black and 10.5% other. However, patients with leukemia and lymphoma were predominantly Hispanic (50.7%). There were no significant differences in proportion of pretreated patients between the three diagnosis groups (Table 1).
Anthropometric properties at presentation showed higher than average BMI percentile. To study initial weight status in regard to BMI trajectories, we compared baseline measurements across all diagnoses. The baseline height at presentation was 133.5 ± 15.4 cm (range, 99–169.7 cm). The mean weight at presentation was 34.02 ± 13.15 kg, and the mean baseline BMI was 18.49 ± 4.14 kg/m2. The baseline BMI percentile was 63.92% ± 31.63%. There was a significant difference in baseline BMI at presentation among the diagnosis groups: 68.1 ± 31.06 in patients with leukemia and lymphoma, 66.9 ± 31.08 in patients with neural tumors, and 57.42 ± 31.99 in patients with non-neural solid tumors (p = 0.036) (Table 2).
Anthropometric Features of Population Studied
Baseline weight and height mean for each diagnosis group and all diagnoses are shown with SD in parentheses. Mean baseline BMI is shown as kg/m2 with SD shown in parentheses calculated for each diagnosis group and all diagnoses. Baseline BMI percentile was calculated for each patient and the mean and SD in parentheses are shown for each diagnosis and all diagnoses. BMI category was divided by CDC guidelines with <5% classified as underweight, 5%–84% classified as normal weight, and ≥85% classified as overweight and obese, and is shown as number and percentage of each diagnosis group and all diagnoses. p-Value was calculated and is shown in the last column with p-value <0.05 considered significant.
Overall, 4.8% patients were underweight (n = 11), 56.8% patients were within normal-weight parameters (n = 129), and the percentage of patients who are overweight or obese at presentation was 38.3% (n = 87). We compared this to the incidence of obesity in children in Texas and the United States and found overweight and obesity to be higher than both local and national statistics (Fig. 1) in overlapping, but not identical age ranges. Almost half (45.6%) of patients with leukemia and lymphoma were overweight or obese at presentation. This is 15% higher than the national average for US children younger than 18 years.1,2 Furthermore, neural tumor patients who were overweight or obese at presentation was 44.3%, but only 26.3% of patients with non-neural solid tumors were overweight or obese at presentation (Table 2). Therefore, we further evaluated other risk factors, including race and phase of treatment at presentation to explain these findings. We evaluated patients for pretreatment before presentation to MD Anderson. Pretreated patients included patients who received medications or radiation with intent of curing their oncologic diagnosis. This included chemotherapies and steroids, immunotherapies, and targeted agents, as well as radiation therapy. In total, 35.81% of our patients had received chemotherapy or radiation before presenting to our institution, including steroids and/or cranial radiation (Table 3).
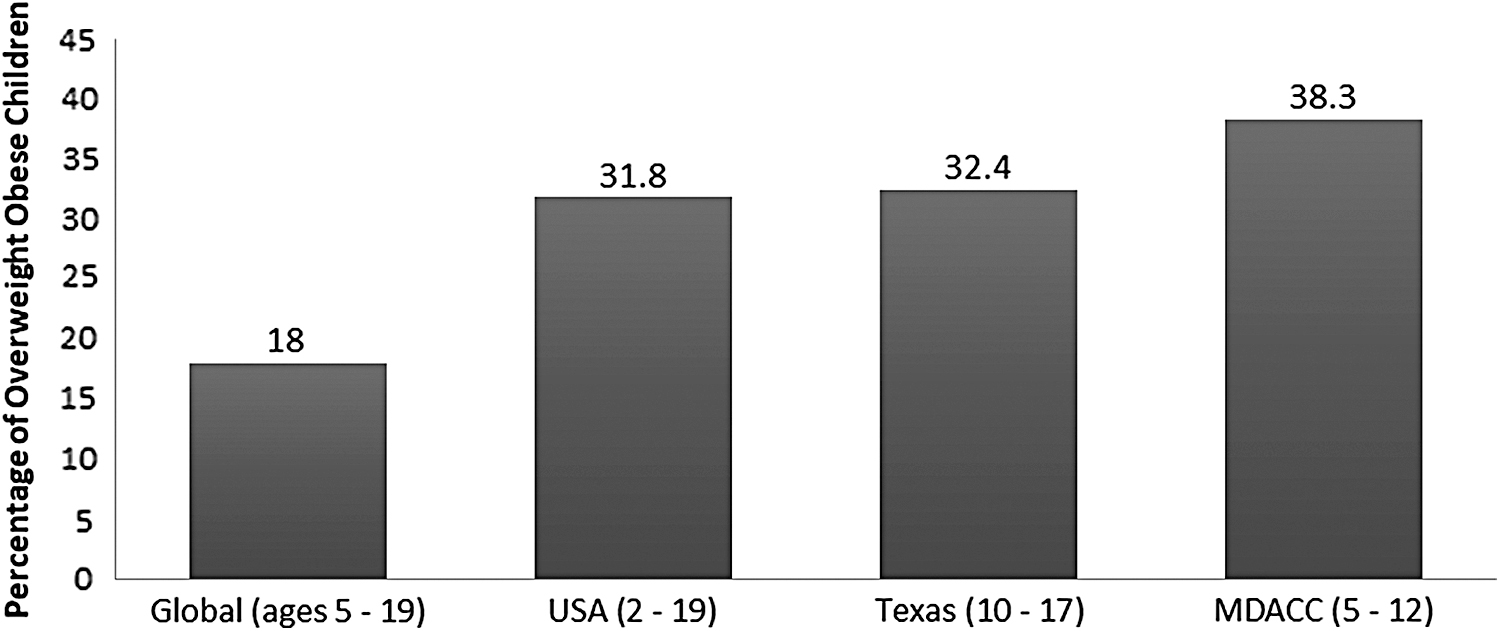
Scheme showing prevalence of patients with overweight/obesity at presentation (far right bar) compared to local Texas, 22 National, 2 and Global 23 statistics. Childhood prevalence includes variable ages as shown in parentheses under bars. Childhood overweight or obese is defined as BMI >85th percentile for United States, Texas, and University of Texas MD Anderson Cancer Center calculations. Overweight/obese is defined as >1 standard deviation above the WHO Growth Reference media for Global data.
Percentages of Patients Treated before Presentation
Percentage of pretreated patients in the overweight/obese population for all diagnoses and each diagnosis category is shown. Pretreated patients included patients who received medications or radiation with intent of curing their oncologic diagnosis. This included chemotherapies and steroids, immunotherapies, and targeted agents, as well as radiation therapy.
To evaluate whether BMI percentile changed during treatment and survivorship, we examined BMI throughout treatment and follow-up. For all patients, there was an initial increase in mean BMI percentile from 63.92% at presentation to 67.7% at year 3 of follow-up. When broken down by cancer diagnosis, leukemia and lymphoma patients appeared to show increasing BMI percentile through year 4 and again around year 7. The non-neural solid tumor group appears to decrease in BMI percentile over time, while the neural tumor group remains neutral and the leukemia group increases (Fig. 2). We tested these trends using linear mixed models and found that, compared to the non-neural solid tumor group, the leukemia group had an increasing trend over the 11-year period (p = 0.0007), while the brain tumor group did not (p = 0.1199). Several covariates were integrated into this model; gender, race and pretreatment status were not associated with BMI change, but baseline % BMI was associated with BMI percentile trends (p < 0.0001), as expected.
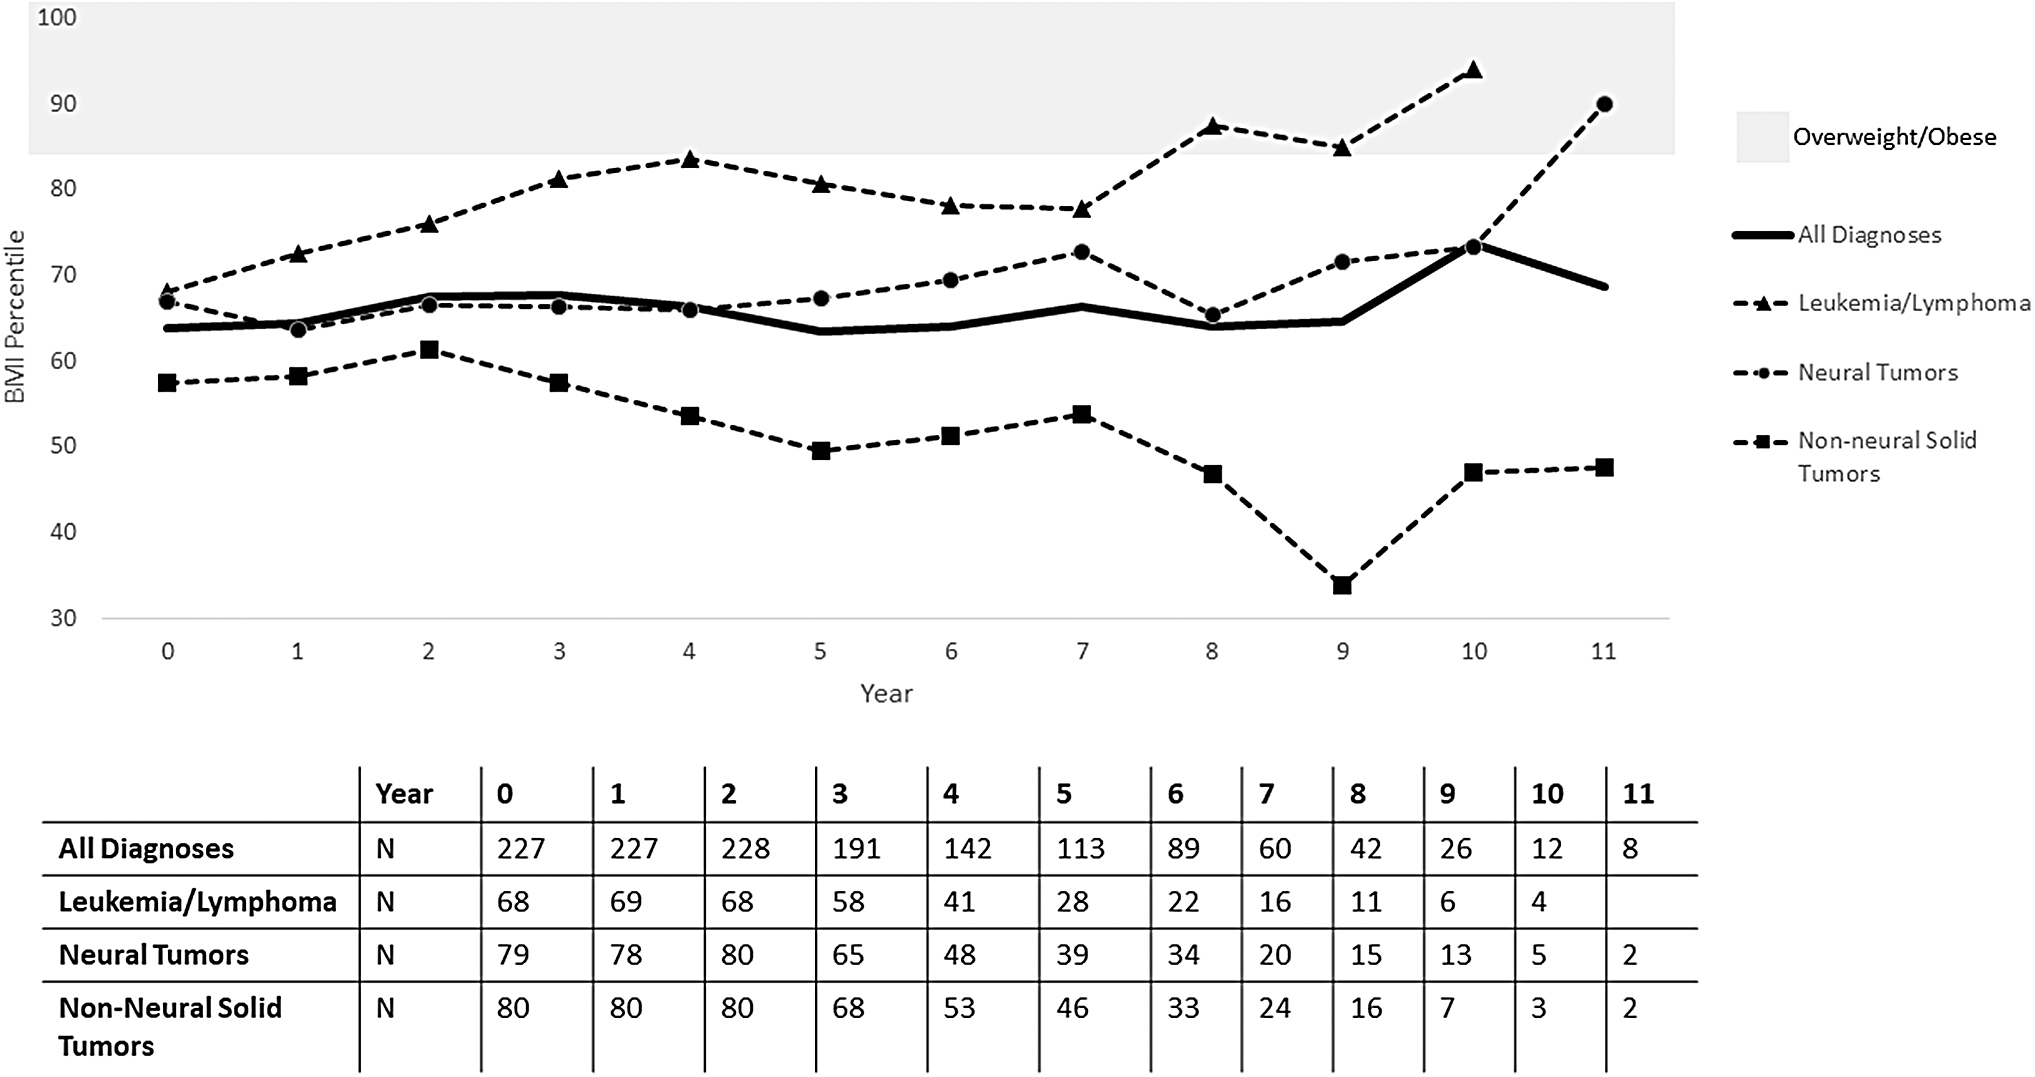
BMI percentiles over time. BMI percentiles taken from yearly follow-up measurements over the course of up to 11 years were calculated and are plotted as averages for each diagnosis group and all diagnoses (solid black line). The shaded area represents overweight and obese BMI percentiles (≥85%). The table shows the number of patients at each yearly visit.
This is further illustrated in Figure 3, which indicates that patients who were overweight or obese at presentation tended to stay overweight or obese into survivorship. Patients with normal BMI at presentation tended to stay within normal ranges. For the three cancer diagnosis groups, patients' mean BMI percentile categories did not vary over time when compared to presenting BMI percentiles (Fig. 3a and c).
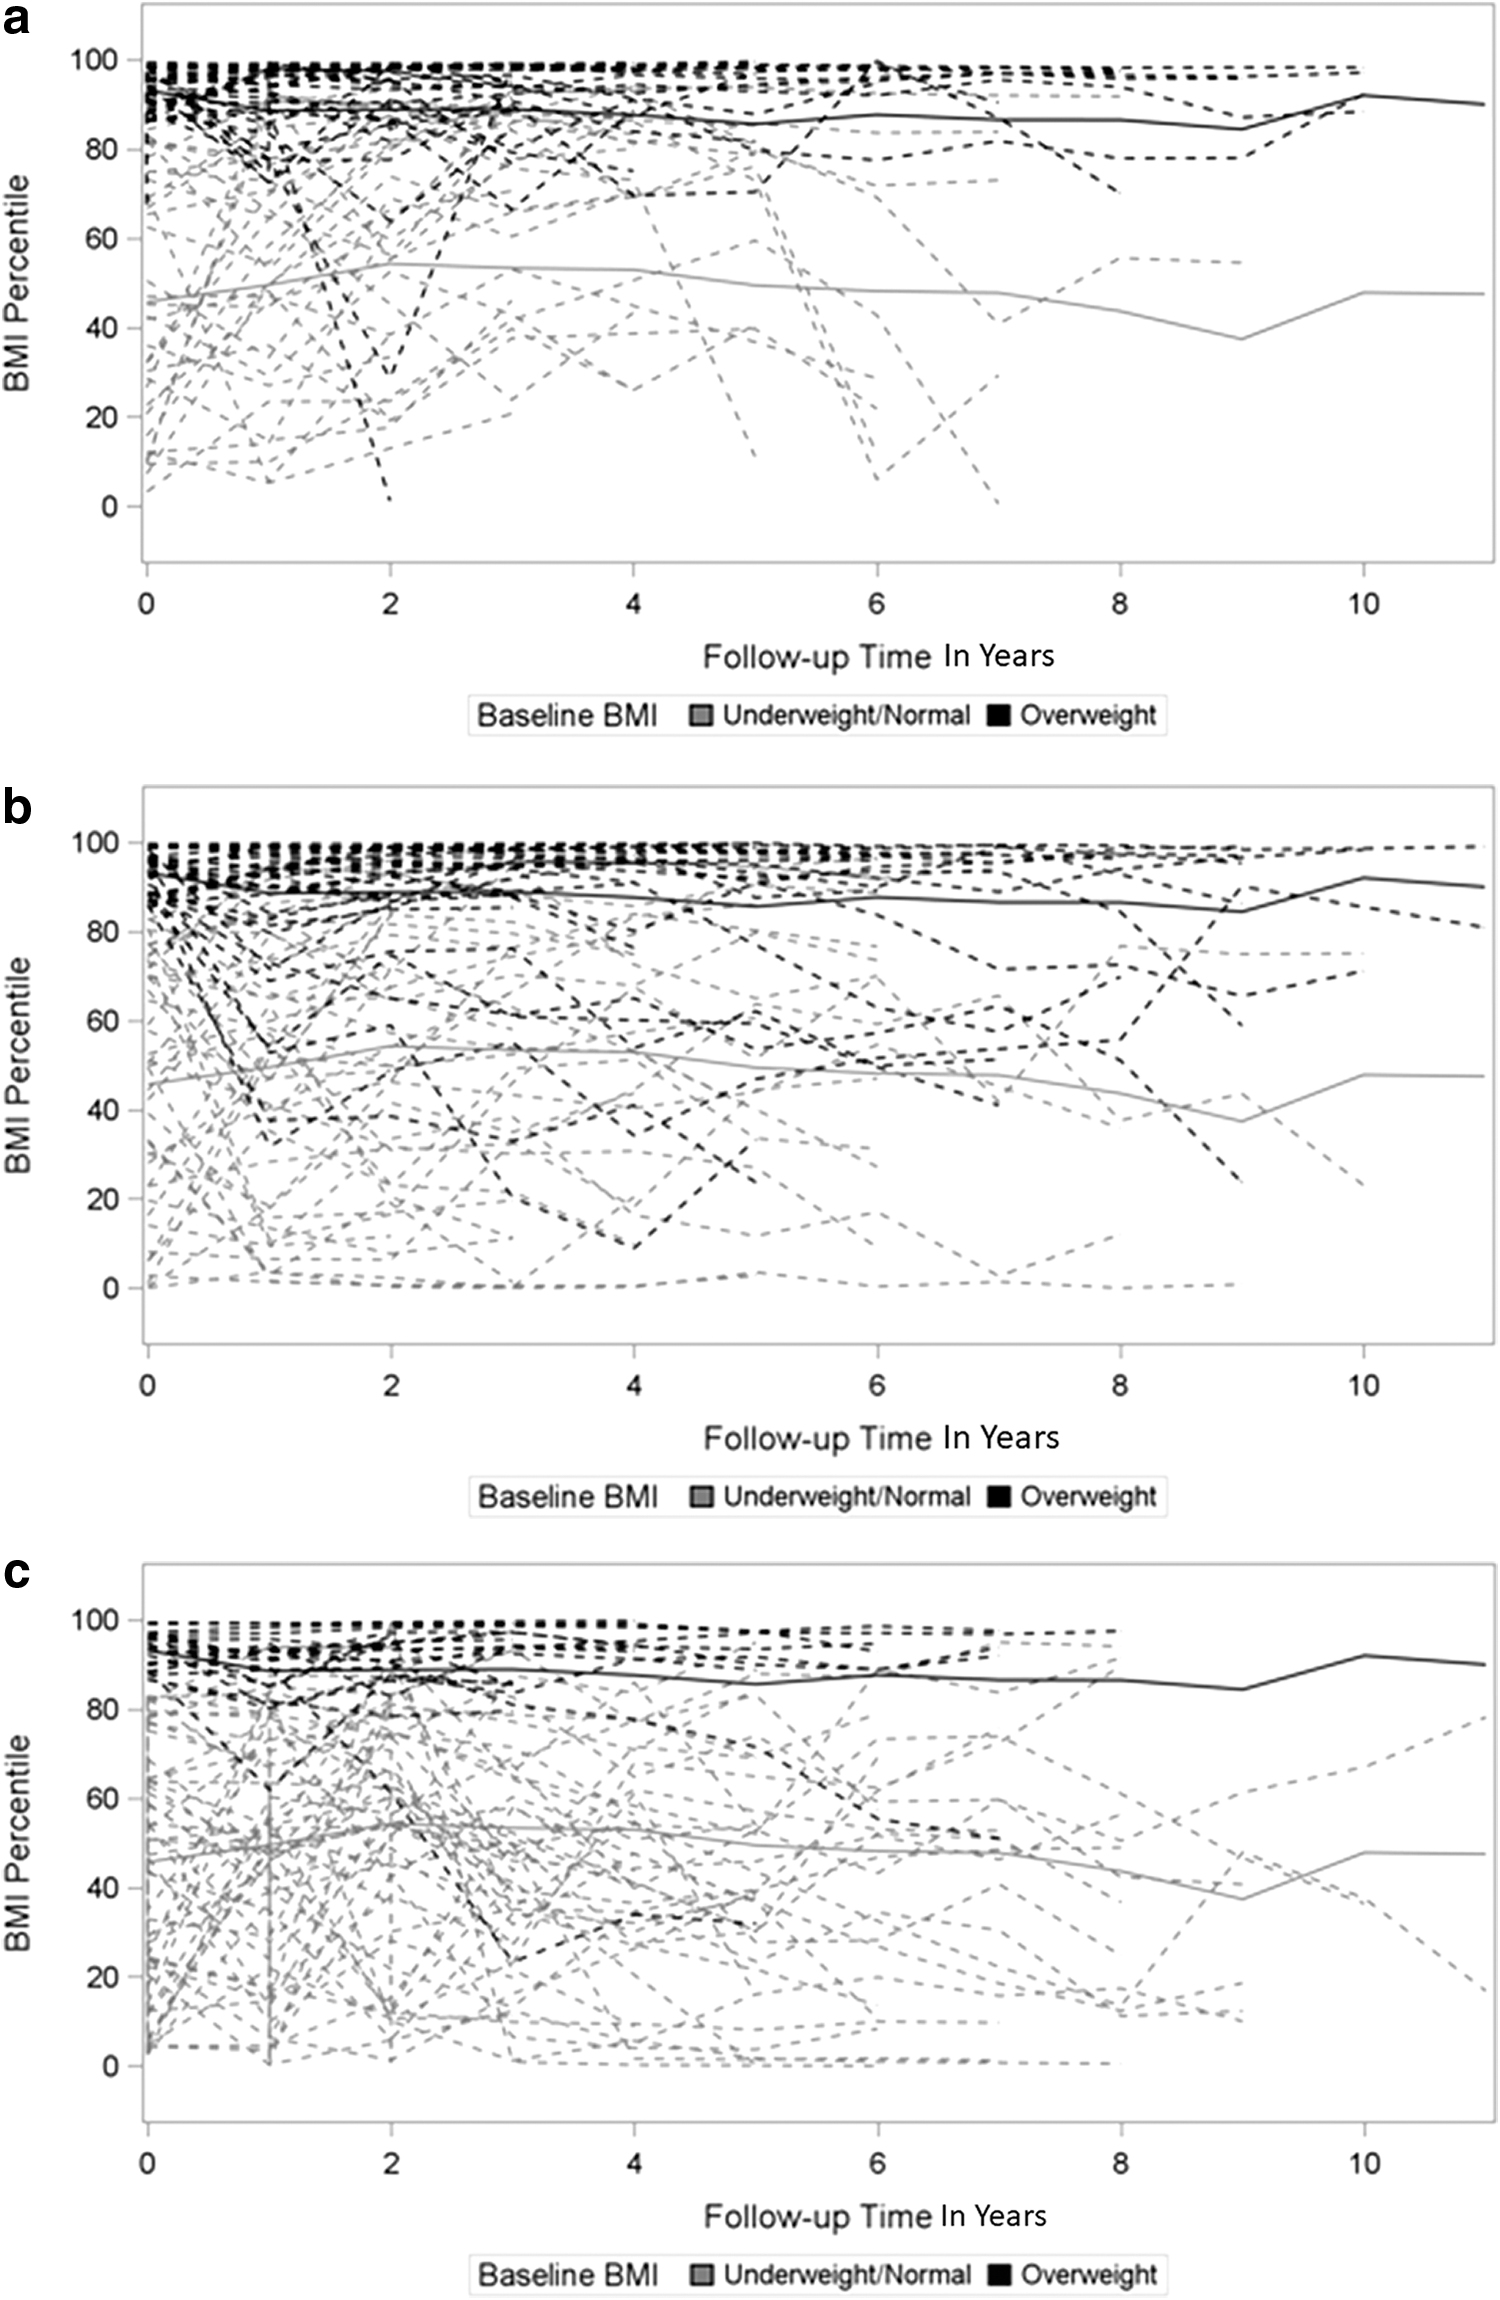
BMI percentiles over time by baseline BMI category. Individual BMI percentiles for patients diagnosed with three different cancer types are plotted as functions of time categorized based on patients' baseline BMI percentile levels. Mean BMI percentile at each visit is also displayed by a thicker line.
Discussion
The results of our study are the first to examine weight trajectories across various pediatric oncology diagnoses from presentation through survivorship. We report an alarmingly higher rate of patients who were overweight or obese at presentation than the population average, especially in leukemia and lymphoma and neural tumor patients. BMI percentile trended upward in leukemia and lymphoma patients through treatment and into survivorship, and patients who were overweight or obese at presentation tended to stay overweight and obese into survivorship. Interestingly, patients with normal BMI at presentation tended to stay within normal ranges into survivorship, suggesting that weight status at presentation is a determinant of weight gain through treatment and survivorship.
Our patients had higher rates of being overweight or obese at presentation than local and national averages, especially patients with leukemia and lymphoma, as well as those with neural tumors. This may be a result of the high proportion of pretreated patients at our institution. BMI percentile trended upward in leukemia and lymphoma patients through treatment and into survivorship. Patients who were overweight or obese at presentation generally continued to remain overweight or obese into survivorship, but patients with normal BMI at presentation tended to stay within normal ranges.
Our results parallel studies showing higher rates of overweight and obesity in pediatric leukemia and neural tumor survivors.1,4,9,10 Obesity rates in pediatric cancer patients have tracked with the general pediatric population and have been increasing over the past two decades. 11 Given the higher rates of Hispanic patients and high rates of secondary referrals to our center, we evaluated each of these factors as a potential explanation for higher rates of obesity.
The higher rates of obesity in our pediatric oncology population may be associated with the demographic predominance of Hispanics in our population and the higher rate of obesity reported in non-white Hispanic and black populations. 2 Unique to our institution, we have a higher prevalence of Hispanic patients than the national average of the general pediatric cancer population due to our local population and a substantial international patient population. There was a significant difference in the distribution of race/ethnicity among the diagnosis groups, with the leukemia and lymphoma group being predominately Hispanic (50.7%) and the neural and non-neural solid tumors groups predominately white (62.5% and 60%, respectively). Across all diagnoses, we evaluated the patients who were overweight and obese by race and did not find any correlation. Several studies have reported that Hispanic pediatric leukemia patients tend to present with high-risk features like higher white blood cell counts and high-risk cytogenetics and have poorer outcomes.12–14 In addition, Hispanic children have a higher prevalence of being overweight and obese, making this cohort at higher risk of poor outcomes and late effects from cancer therapy. 2 When combined, the higher prevalence of overweight and obesity in Hispanic populations and the poorer outcomes in Hispanic children diagnosed with leukemia represent a very high-risk group in need of effective weight-loss interventions.
As a specialized cancer hospital, a significant proportion of patients present as second opinions or referrals for relapsed and refractory cancers, often after multiple rounds of therapy. In total, 35.81% of our patients had received chemotherapy or radiation before presenting to our institution; for leukemia and lymphoma patients, this often included steroids known to be associated with increased rate of obesity during treatment, and for neural tumor patients, this often included steroids, in addition to cranial radiation, another risk factor for obesity during treatment.10,11 When comparing diagnoses groups, there is a higher proportion of pretreated patients in the leukemia and lymphoma cohort (40.58%) and the neural tumor cohort (37.5%) than the non-neural solid tumor cohort (30%). When broken down by overweight or obese vs. normal weight, there is a higher proportion of pretreated patients in the leukemia and lymphoma cohort (38.7% vs. 37.8%) and neural tumor (40% vs. 33.6%) patients who were overweight and obese than the normal-weight patients (Table 3). These findings partially explain the higher proportion of obesity at presentation in these diagnosis groups. It is possible that there may be a higher proportion of other comorbid medical and psychiatric conditions in these patients who have already received previous therapy when presenting to MD Anderson, which can contribute to overweight or obese status; unfortunately, we did not have standardized charting for nononcology diagnoses available for review. As a specialized cancer center, MD Anderson may also see more nonlocal patients and those with more advanced disease. These factors may help explain the large proportion of original patient records with nonconsecutive height and weight measures and <5-year survival. Exclusion of these patients limits the generalizability of our results to other institutions.
Leukemia and lymphoma patients showed an average increase in BMI percentile through year 4 and again around year 7 of follow-up. These findings correlate with maintenance therapy for leukemia patients and the initial off-therapy follow-up for other diagnoses. The initial increase in BMI 2–3 years after presentation is in line with multiple studies showing increased BMI z-score or percentile during treatment and early in survivorship.15–20 A meta-analysis of over 1500 pediatric ALL patients in 16 studies concluded that BMI z-score increased early in treatment and in maintenance phase, and persisted beyond treatment into survivorship. 9 In a study of 133 newly diagnosed patients, BMI and fat mass increased within 3 months of diagnosis and doubled by 12 months after diagnosis. 9
The distribution of our patient cohort was skewed by race/ethnicity, but otherwise evenly distributed by sex and age among the cancer diagnoses. Unfortunately, race/ethnicity data of participants were limited to white, black, Spanish Surname (Hispanic), or Other (all others and mixed race). This limited our ability to examine differences in the sample or draw specific conclusions for racial groups. Height did differ significantly among the diagnosis groups. This was likely due to the fact that common non-neural solid tumors, including Wilms tumor and bone tumors, mainly affect infants and pubescent children, respectively. As infants were excluded from the analysis, the non-neural solid tumor group included a slightly (nonsignificant) older population. Patients with non-neural solid tumors did show a decline in BMI percentile over time. While they remained within normal BMI percentiles on average, a small number of patients dropped below the 5th percentile during follow-up. This result is not unexpected for non-neural solid tumor patients since previous studies have suggested risk factors for underweight were treatment with total-body irradiation in females, abdominal irradiation in males, and treatment with alkylating agents and anthracyclines. 1
It has been shown that diet and exercise interventions are both feasible and safe during cancer treatment. 20 It has also been widely recommended by previous studies on obesity and nutrition that CCS receive individual nutritional counseling as well as follow-up with a nutritionist or endocrinologist for monitoring of nutrition and late effects. 17 Utilizing these resources, in addition to behavioral therapies provided by pediatric psychologists, has been shown to promote weight loss in pediatric patients who are overweight or obese. 21 Studies have shown treating clinicians have strong relationships with their patients and the highest potential impact on lifestyle interventions; however, most parents of CCS who are overweight or obese do not recall their clinician ever bringing up the diagnosis of overweight or obesity.18,20 This is a valuable opportunity for lifestyle and behavioral interventions to both improve a patient's quality of life and chances of long-term survival. Our data highlight a comorbidity present at oncologic diagnosis that is not effectively addressed throughout treatment and into survivorship. Further research is needed on implementing nutritional and lifestyle interventions by multidisciplinary teams, including nutritionist and psychologist, early in diagnosis and continuing through survivorship.
Footnotes
Acknowledgments
We thank Diane D. Liu, MS, Department of Biostatistics, for statistical analysis, and Winston Huh, MD, Pediatric Hematology/Oncology Fellowship Program, for mentorship, and MD Anderson's Department of Scientific Publications, for editorial assistance.
Funding Information
We are grateful for support from the James B. and Lois R. Archer Family Charitable Foundation and from the National Institutes of Health/National Cancer Institute under award number P30CA016672 (used the Clinical Trials Support Resource and Biostatistics Resource Group) and R25CA057730 and the Center for Energy Balance in Cancer Prevention and Survivorship, Duncan Family Institute for Cancer Prevention and Risk Assessment. We also wish to recognize the Transdisciplinary Research on Energetics and Cancer Training Workshop, award number R25CA203650, principal investigator: Melinda Irwin.
Author Disclosure Statement
The authors declare no potential conflicts of interest.