
Abstract
Introduction:
Schools meals offer a critical opportunity for improving youths' diets, particularly for economically disadvantaged students. We examine the impact of a multipronged intervention to increase middle and high school students' lunch participation in an urban school district.
Methods:
In school years 2015–2016 through 2017–2018, a quasi-experimental study was conducted in 24 secondary schools, half (n = 12) of which received the following intervention: cafeteria redesign, additional school lunch points-of-sale (mobile carts and vending machines), and teacher education.
Results:
From baseline to follow-up, lunch participation dropped 4.1% in intervention and 5.1% in comparison schools (difference-in-difference 1.0%, 95% CI 0.5–1.4). The overall decline in lunch participation occurred simultaneously with a drop-in free or reduced-price meal eligibility (from 72% to 58%) across all schools, which is likely related to changing local economic conditions, including a county-wide minimum wage increase that began in summer 2015. Among students eligible for free or reduced-price meals, participation decreased 1.8% in intervention and 4.9% in comparison schools (difference-in-difference 3.1%, 95% CI: 2.5–3.7), with a larger difference-in-difference seen in high schools (5.0%, 95% CI: 4.2–5.9) than middle schools (1.8%, 95% CI: 0.8–2.6).
Conclusions:
While this intervention demonstrated a modest, but significant relative increase in school lunch participation, the effect was not sufficient to halt large district-wide declines in participation during this study period. Given the significant time, money, and political capital required to implement the intervention, districts should carefully consider similar investments. Broader public policies or other changes to economic conditions that affect eligibility for means-tested benefits—in this case, a strengthening local economy coupled with an increased local minimum wage—may influence school lunch participation more than school-level interventions.
Introduction
Food insecurity and poor diet compromise children's health and learning potential.1,2 In 2017, 16% of US households with children were food insecure. 3 Few US youth consume a diet consistent with the Dietary Guidelines, 4 and dietary quality worsens from childhood to late adolescence. 5 Children's food insecurity and poor diets can place them at increased risk for poor educational outcomes and the development of obesity and chronic diseases.6–9
School meals offer promise for improving both youth food security and diet quality. 10 Through the National School Lunch Program, schools provide free or reduced-price meals (FRPM) daily to eligible low-income students. In 2018, 22 million students daily received an FRP school lunch and 7.7 million students not eligible for FRPM bought school lunches. 11 A recent national study found that the nutrition quality of school meals has improved in recent years. 12 The average school lunch in 2014–2015 had a Healthy Eating Index (HEI) score of 82 (diet quality measured on a scale of 1–100), substantially up from 58 in 2009–2010. 12 Students eating school lunch have higher lunch HEI scores than their peers (80 vs. 65, p < 0.05), consuming more vegetables, whole grains, and dairy. 12 Eating school meals may also have a positive impact on overall diet quality.12,13
Despite the potential benefits of school meals, on a typical school day in 2014–2015, only 56% of students participated in school lunch nationally. 12 Participation was higher for students who qualify for FRPM (78%) than those who do not (35%), and declined as students aged. 12
A recent qualitative study in South Los Angeles high schools found that the primary school lunch participation barriers included long cafeteria lines and time constraints. 14 Other research suggests that the cafeteria environment may affect students' perceptions of food quality and satisfaction with school meals; however, whether changing the environment changes students' behaviors is not known.15,16 Interventions aiming to change meal access or distribution points have been successful in increasing school breakfast participation,17,18 but few studies report on interventions designed to increase meal participation in middle and high schools. And while limited research suggests that adults at school may influence school meal selections of elementary school students,19,20 almost nothing is known about whether teachers can influence meal participation among secondary school students. 21
Appreciating the importance of school meals for youth health, recognizing that school meal participation declines as students enter secondary schools, and understanding the barriers that long lines, convenience, and time constraints present to students, a California urban school district conducted an intervention designed to increase meal participation among middle and high school students. The multipronged intervention involved redesigning school cafeterias to be more appealing to students, introducing vending machines and mobile lunch carts as additional lunch points of sale, and educating teachers about the school lunch program to increase their participation in, and promotion of, school lunch. The purpose of this study was to examine the impact of this intervention on student lunch participation.
Methods
Study Design and Participants
This was a 3-year quasi-experimental study in an urban California district. 21 All middle and high schools requiring daily campus attendance (n = 24) participated. Before study onset, five schools piloted intervention components and were thus assigned to the intervention arm. The remaining 19 schools were randomized to intervention (n = 12 total, 5 from pilot testing group and 7 from randomization) or comparison (n = 12), based on the following: school type (middle/high); high vs. low need (based on FRPM eligibility); proportion of white students; and the school's Academic Performance Index score, a California state measure of academic performance. 22 Data span was 4 school years (SY): 2014–2015 (baseline) to 2017–2018 (follow-up). This study was approved by the University of California Berkeley Committee for the Protection of Human Subjects and the school district's Research, Planning, and Accountability Department.
Intervention
The intervention included three components. First, schools engaged in student-informed cafeteria redesigns, including adding colorful artwork and new seating options conducive to socializing. Second, schools incorporated two additional points of lunch sale, intended to expand the number of lunch lines: a vending machine (serving cold meals like yogurt parfaits and sandwiches with fruit and a fresh vegetable side in the cafeteria) and a mobile cart (serving hot meals similar to those served in the lunch lines, located in cafeterias, high-traffic hallways, or courtyards). Third, teacher outreach—including a monthly newsletter about school lunch-related topics, school lunch taste tests (mean = 9 per school), and a promotional video screened primarily during staff meetings—engaged school staff to inform them about, and encourage, both adult and student lunch participation. A research grant covered funding for the additional points of sale, teacher outreach, and 50% time for a district staff member to support the study.
School Demographic Data
School-level demographic data were downloaded from the California Department of Education. 23 The district provided data on schools' participation in the Community Eligibility Provision (CEP) program, 24 a federal program enabling schools serving a large proportion of economically disadvantaged students to serve meals at no cost to all enrolled students. For eligible schools and districts, CEP eliminates the household-level school meal application process (a known barrier to meal participation). However, the school district continued to collect data about individual students' eligibility for school meals due to local school initiative funding formulas.
Meal Participation Data
The district provided daily school lunch participation data and monthly average daily attendance. The primary outcome variable was the daily proportion of students purchasing school lunch, calculated by dividing the number of students purchasing school lunch by the school's average daily attendance for that month. The daily proportion of students purchasing FRP lunch was calculated by dividing the number of FRP lunches purchased by the average daily attendance, multiplied by the proportion of students eligible for FRPM at the school (similar calculations were done for students who were not FRPM eligible). The daily proportion of adults (teachers/staff) purchasing lunch was calculated by dividing the number of adult meals purchased by the number of adults working at the school.
Statistical Analysis
To assess differences in changes in daily lunch participation between intervention and comparison schools from baseline to follow-up (overall, among FRPM-eligible lunches and among non-FRPM-eligible lunches), we used linear mixed-effects models with a group (intervention vs. comparison) by time (2014 vs. 2017) interaction term, which provided a difference-in-difference. For each model, we also tested for three-way interaction by school type (middle vs. high). We similarly examined adult lunch participation.
We also conducted a within-group dose–response analysis to assess the contribution of additional points-of-sale in intervention schools on daily lunch participation (overall, for non-FRPM-eligible lunches and for FRPM-eligible lunches). We used linear mixed-effects models with an interaction term for school type and point-of-sale intervention components (lunch lines only, lunch lines plus vending machine, lunch lines plus mobile cart, and lunch lines plus vending machines and mobile carts).
All models included a random effect for school and controlled for school level: enrollment, proportion of FRPM-eligible students, proportion of students by race/ethnicity (African-American, Asian, Latinx, and White), and CEP program participation.
Results
Few statistically significant differences were found in baseline (SY 2014–2015) school-level characteristics between intervention and comparison schools (Table 1). Overall, schools served predominantly economically disadvantaged students (72% mean FRPM eligibility) and racially/ethnically diverse populations (39% of students identified as Asian and 29% as Latinx). At baseline, the proportion of students in intervention schools who participated in school lunch was higher than the proportion of participating students in comparison schools overall (30.8% vs. 27.9%; p < 0.001), and for both FRPM (39.2% vs. 37.4%; p < 0.001) and non-FRPM eligible (14.2% vs. 13.6%; p = 0.002). The proportion of students purchasing school lunch was higher in middle than in high schools (33.8% vs. 30.8%; p < 0.001). None of the middle schools had open-campus policies (i.e., students had to eat lunch at school); 10 of the high schools (83%) had open-campus policies.
Differences in Baseline School-Level Demographic Characteristics between Intervention and Comparison Schools in an Urban California School District Participating in the School Lunch Study (2014–2015 School Year)
p-Values for differences between intervention and comparison schools calculated using unpaired t-tests.
Calculated by dividing the number of students purchasing school lunch each day by the school's average daily attendance for that month.
Community Eligibility Provision, a federal program that enables schools serving a large proportion of economically disadvantaged students to serve meals at no cost to all enrolled students without collecting meal program applications from families. Data are for 2016–2017 school year, the first school year schools in this district enrolled in the program.
CEP, Community Eligibility Provision.
School-level characteristics did not significantly change over the course of the study, with one exception: across all schools, the proportion of students qualifying for FRPM declined 14% (from 72% in SY 2014–2015 to 58% in SY 2017–2018; p < 0.001), although nondifferentially between intervention and comparison schools (p = 0.144; Fig. 1).
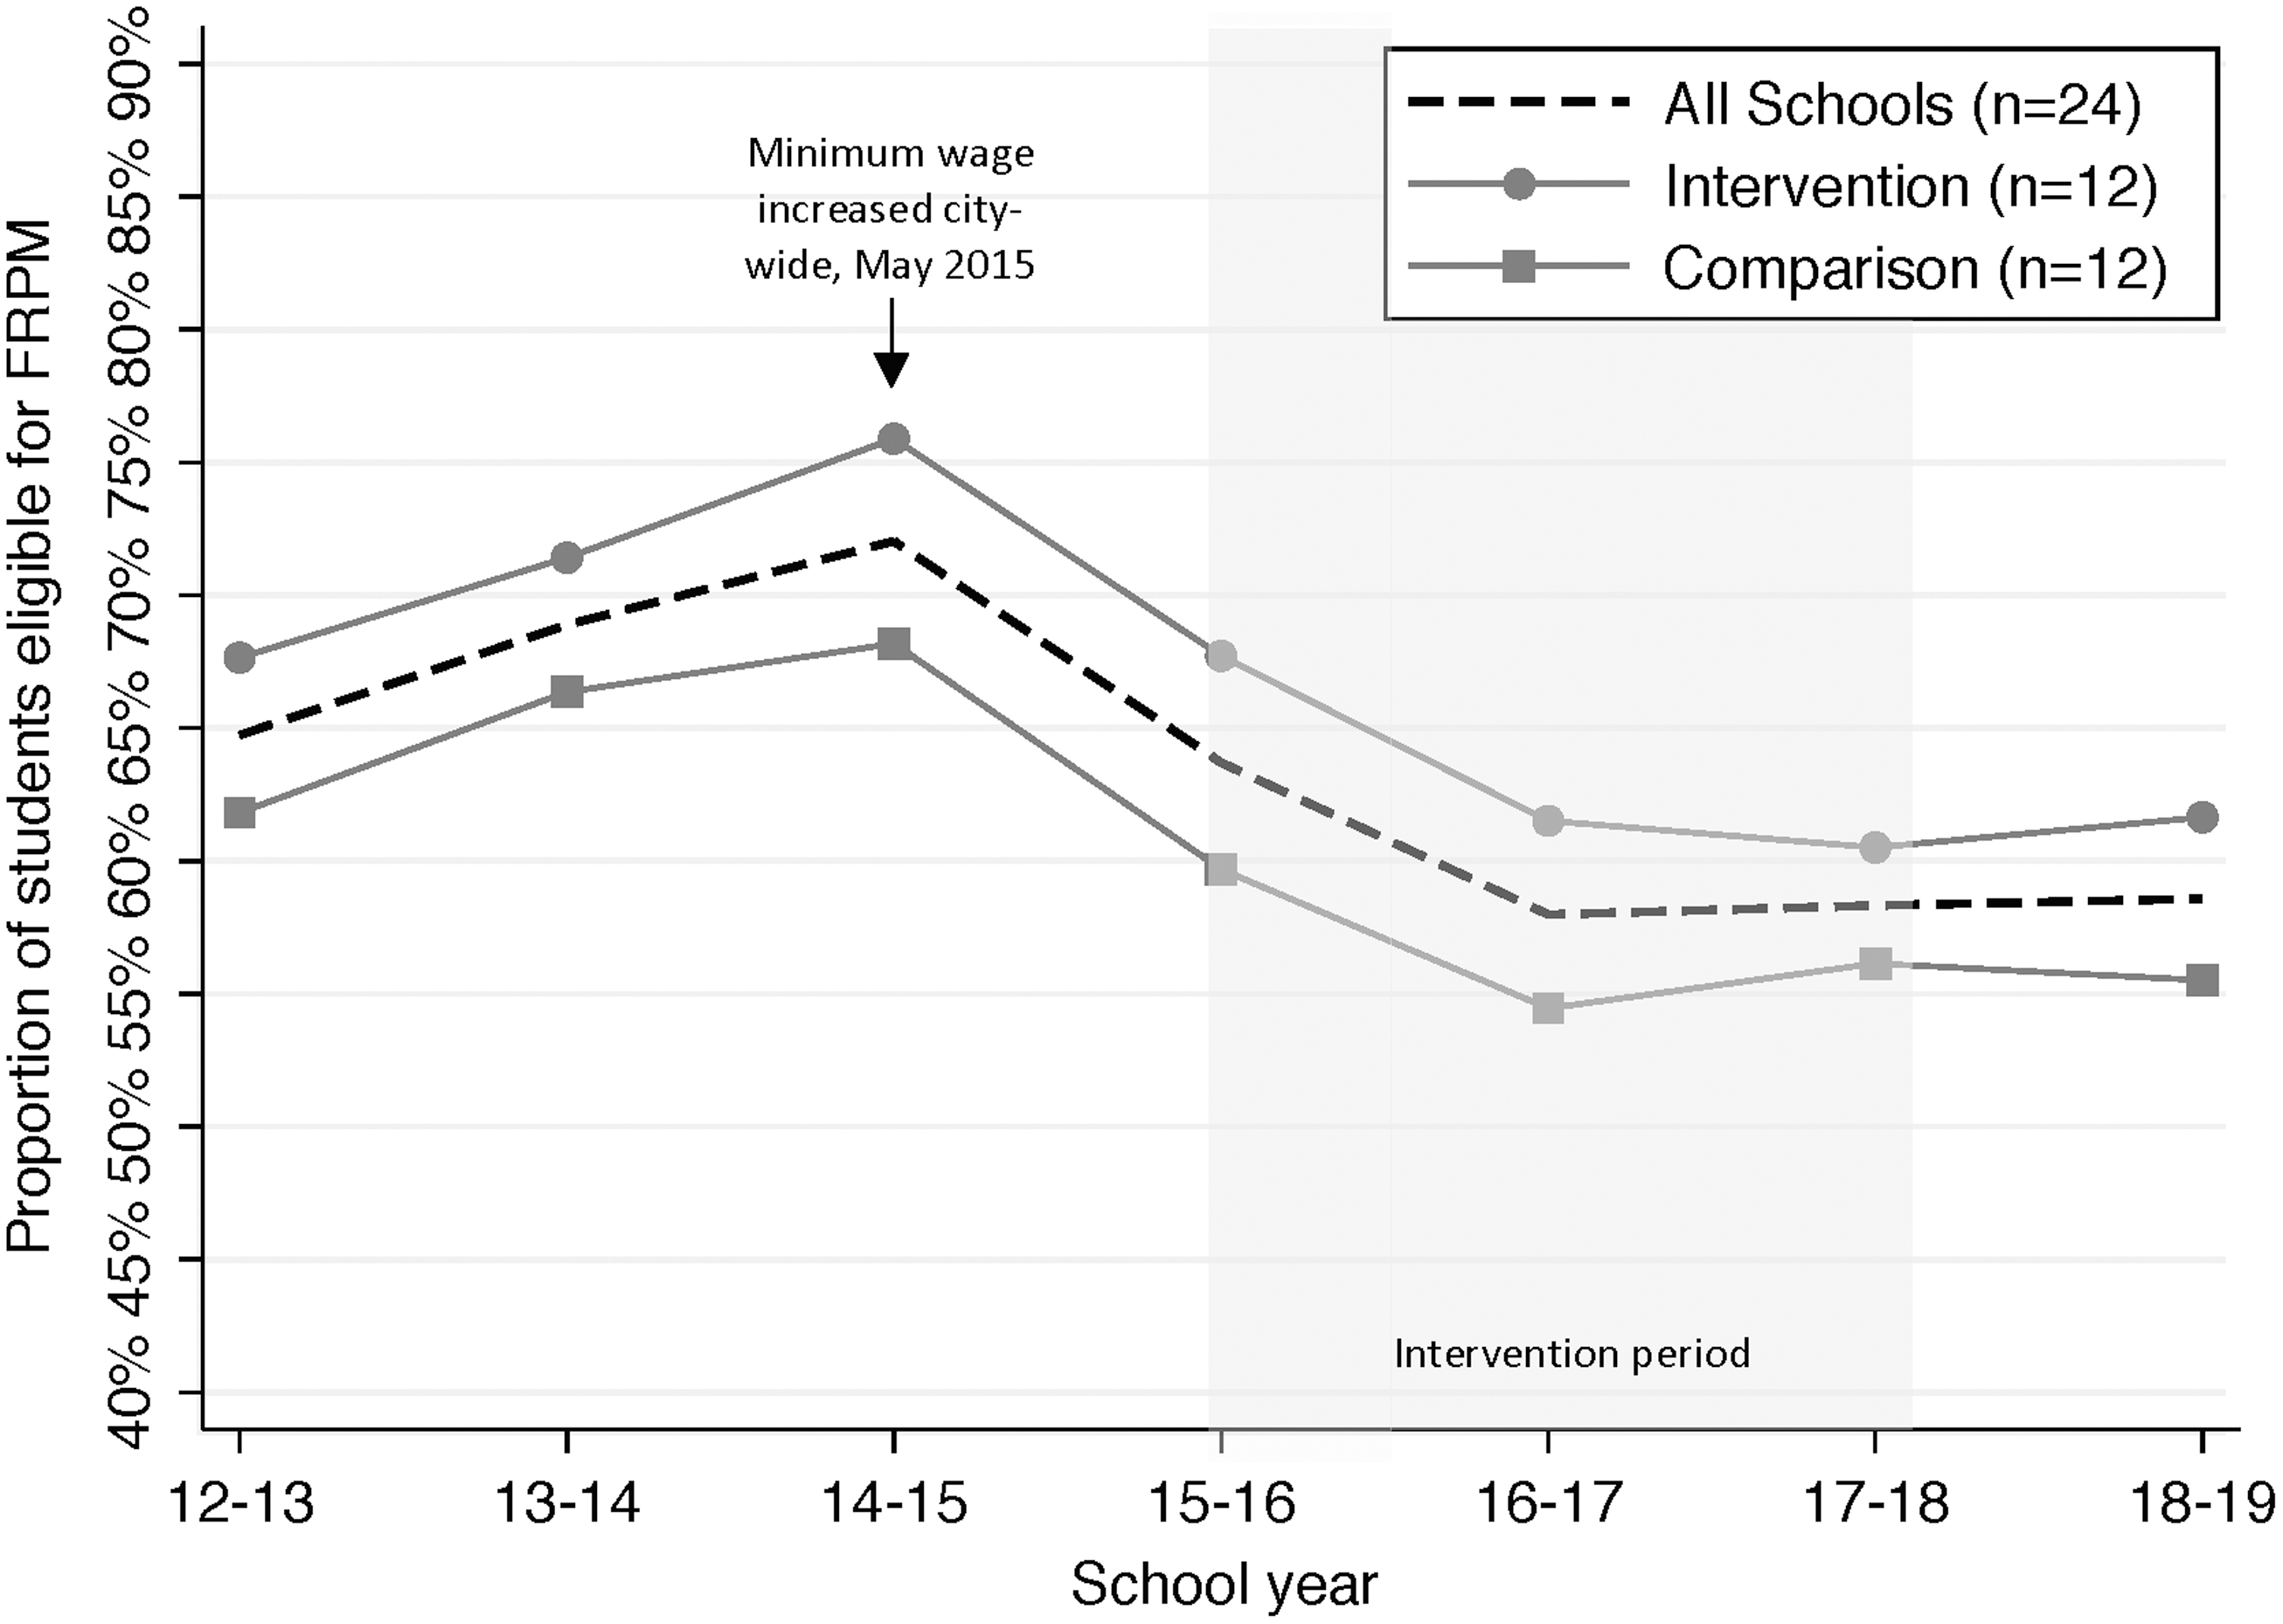
Average proportion of students eligible for free or reduced-price meals, 2012–2013 through 2017–2018.
For our primary analysis examining the difference in change in lunch participation between intervention and comparison schools, we found evidence of interaction by school type (p < 0.001) and therefore present stratified results (Table 2). Overall, school lunch participation declined in both intervention and comparison schools; however, the decline was smaller in intervention than in comparison schools (−4.1% vs. −5.1%, respectively; difference-in-difference 1.0%; 95% CI: 0.5–1.4), which appears to be driven by high schools, where the decline in lunch participation was smaller in intervention than in comparison high schools (−2.4% vs. −4.0%, respectively; difference-in-difference 1.6%; 95% CI: 0.9–2.4). No difference in change in lunch participation was observed between intervention and comparison middle schools.
Adjusted Percent of Students Purchasing School Lunch in School Years 2014–2015 (Baseline) and 2017–2018 (Follow-Up)
Data from linear mixed-effects models, with a random effect for school, adjusted for: total school enrollment; school-level proportion of students eligible for free or reduced-price meals (FRPM); school-level proportion of African American, Asian, Latinx, and white students; and school participation in the Community Eligibility Provision program.
Free or reduced-price meal, the California Department of Education's measure of individual student socioeconomic status.
p ≤ 0.001, **p < 0.05.
FRPM, free or reduced-price meals.
School lunch participation declined among FRPM lunch participants in both intervention and comparison groups; however, the decline was smaller in intervention schools (−1.8% vs. −4.9%, respectively; difference-in-difference 3.1%; 95% CI: 2.5–3.7). In examining participation changes across school types, we found that FRPM participation declined 2.5% in intervention middle schools and 4.2% in comparison middle schools (difference-in-difference 1.7%, 95% CI: 0.8–2.6). In high schools, participation declined 0.5% in intervention vs. 5.5% in comparison schools (difference-in-difference 5.0%; 95% CI: 4.2–5.9).
Among the smaller proportion of non-FRPM-eligible lunch participants (42% of students across all schools in SY 2017–2018), daily lunch participation increased slightly more in intervention (5.0%) than in comparison schools (4.5%; difference-in-difference 0.5%; 95% CI: 0.04–1.1). Daily non-FRPM-eligible lunch participation increased 3.3% in intervention vs. 1.7% in comparison middle schools (difference-in-difference 1.6%; 95% CI: 0.9–2.4). The difference in change in non-FRPM-eligible lunch participation between intervention and comparison high schools was not significant.
At baseline, across all schools, an average of two lunches (range 0–22) was purchased by teachers/staff daily (an average of 81 adults worked at each school). Adult lunch participation declined and remained low at intervention (3.0% at baseline and 1.7% at follow-up) and comparison schools (1.9% at baseline and 1.1% at follow-up); however it decreased more in intervention schools (difference-in-difference −0.5%; 95% CI −0.6 to −0.3).
Over the study period, intervention schools operated only traditional lunch lines (with no added vending machine or mobile cart) on 54% of days; lunch lines plus vending machine 4% of days; lunch lines plus mobile cart 15% of days; and lunch lines, vending machines, and mobile carts 27% of days. Vending machines and mobile carts were nonoperational typically due to electrical, hardware, or software issues. Mobile carts were nonoperational typically due to technical or staffing issues. When nonoperational, students could not purchase lunch from these points of sale; vending machines stayed in place and were turned off and mobile carts were unstaffed and either stayed in place (n = 4 schools) or were moved to storage (n = 8 schools).
In intervention schools, lunch purchases mainly occurred in cafeteria lines: on average, 268 daily lunches (range 3–927) were sold in lunch lines. Figure 2 presents mean daily lunch sales (overall for intervention and comparison schools) and by point of sale for intervention schools, illustrating the staggered implementation of the intervention. In intervention schools, limiting to days when they were operational, an average of 10 (range 0–46) daily lunches per school were sold from vending machines and 41 (range 1–130) were sold from mobile carts.
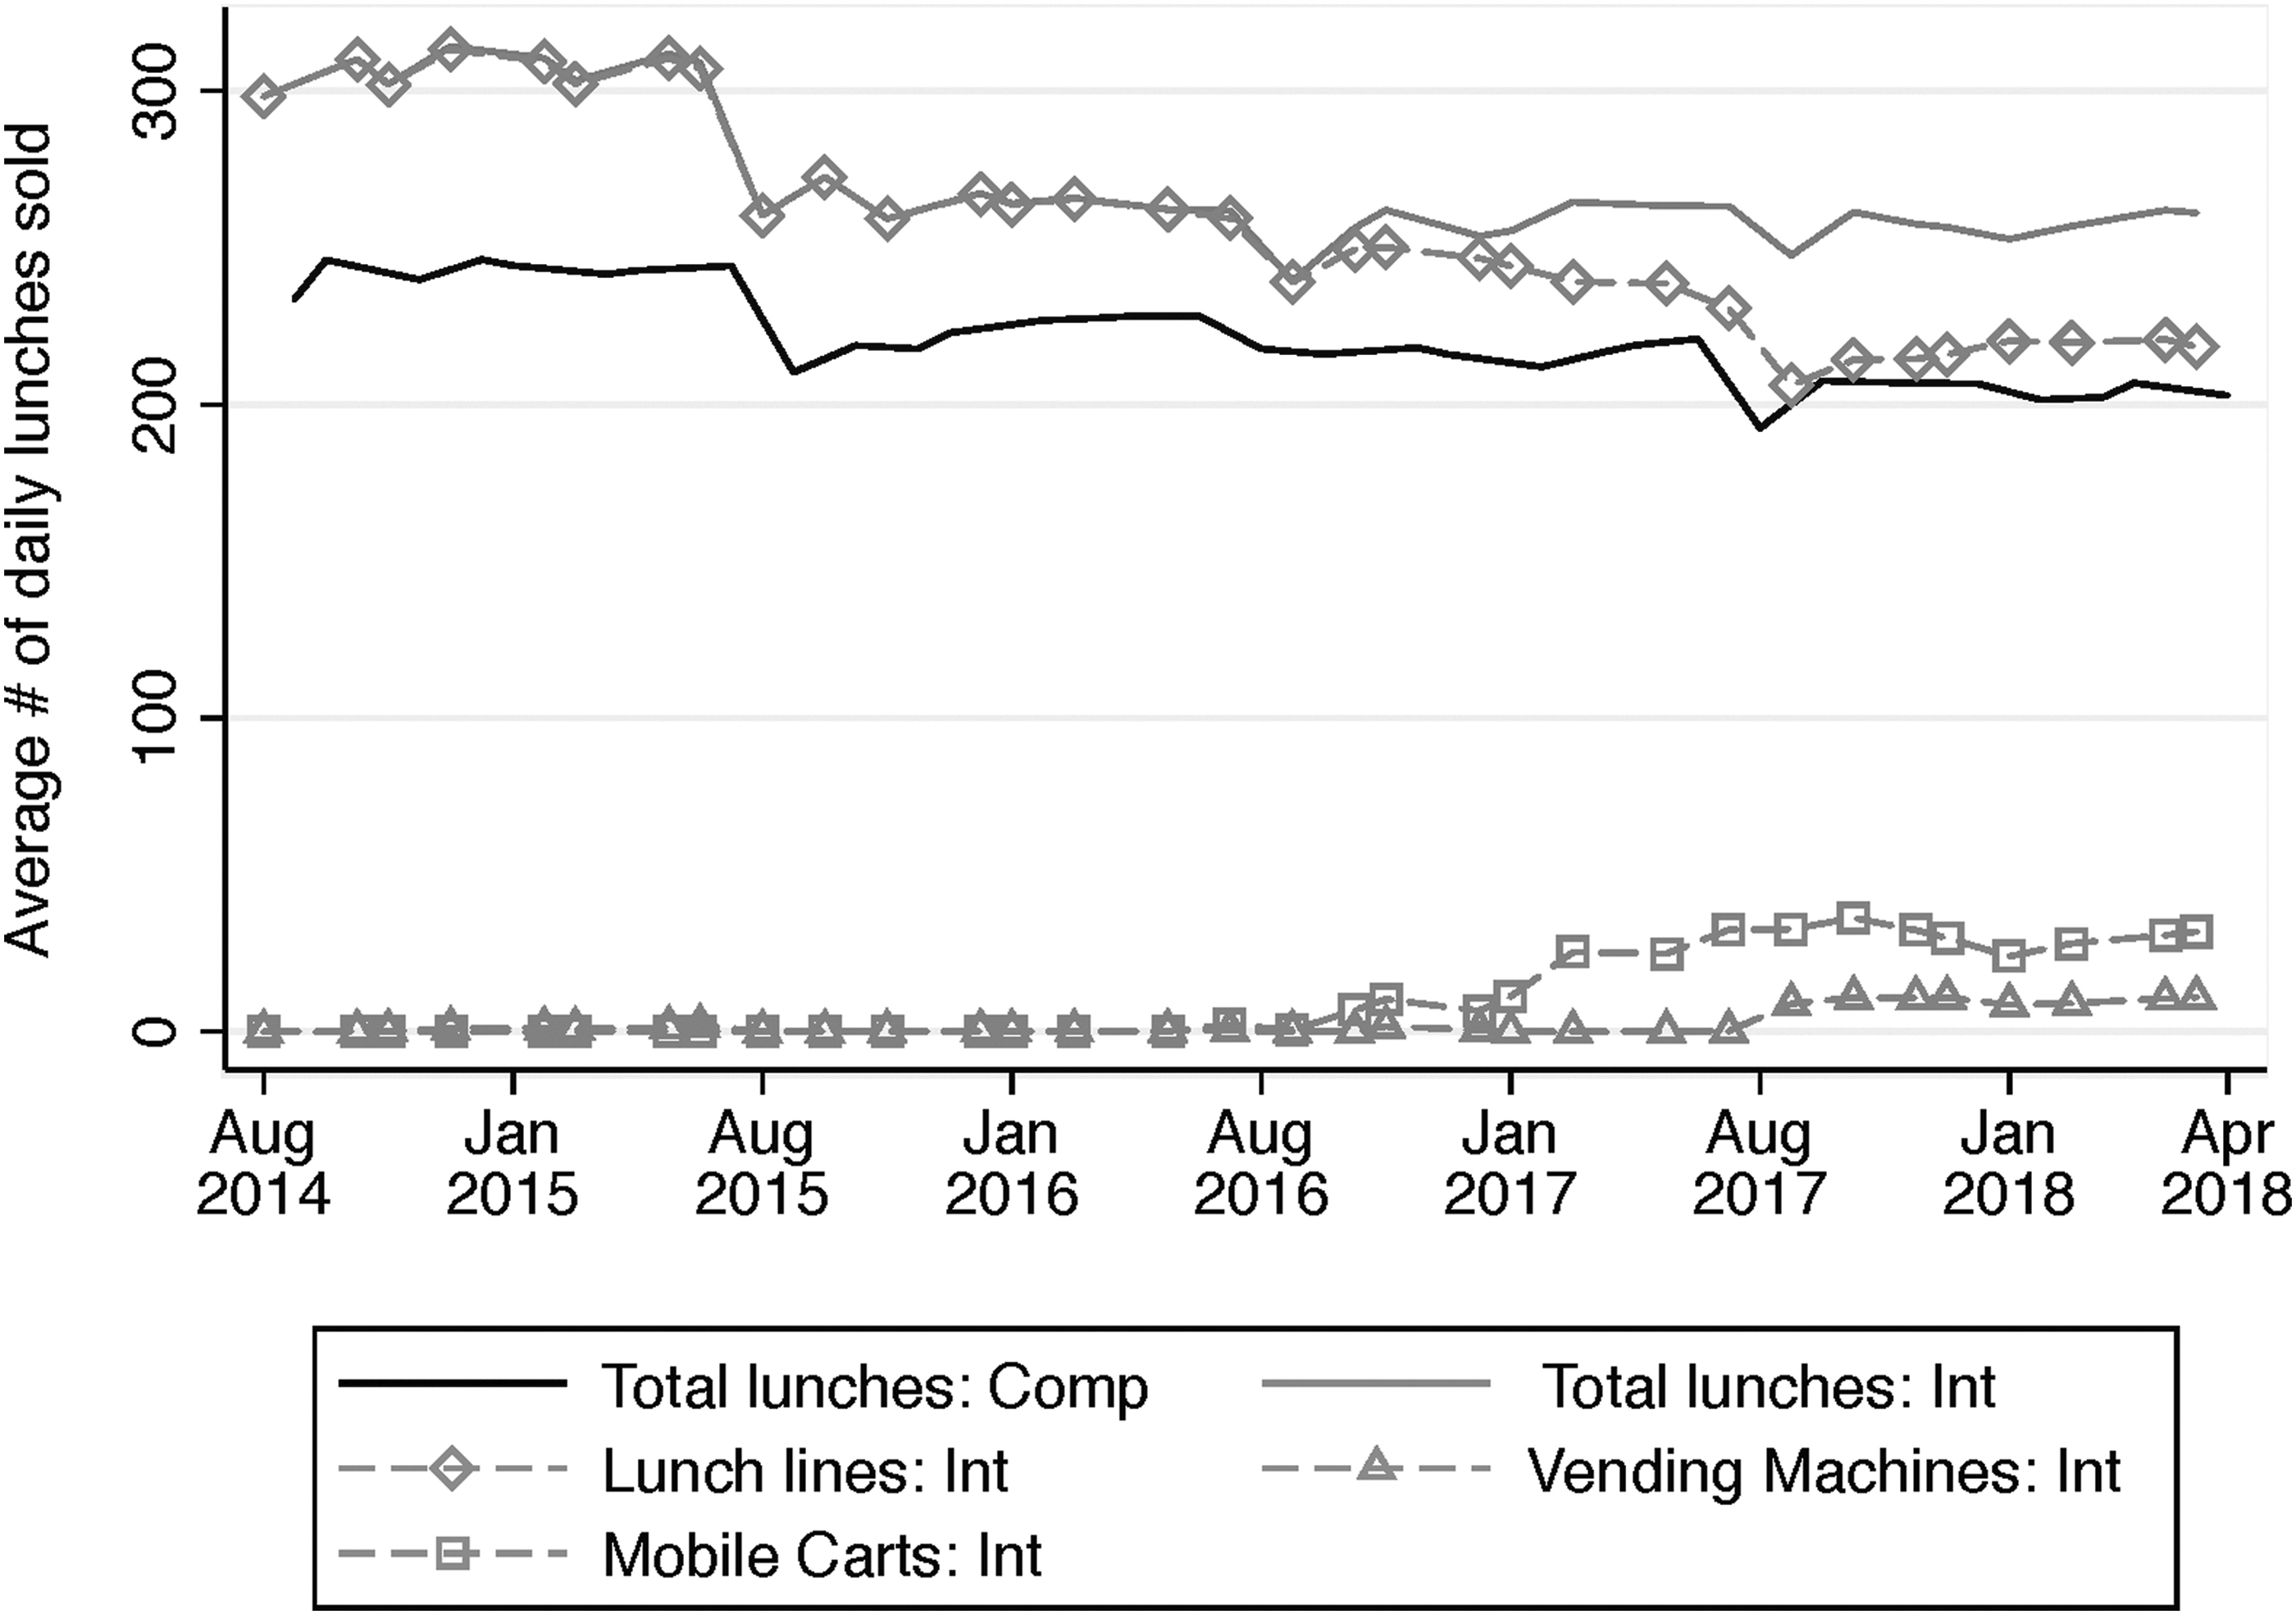
Average daily number of lunches sold, overall in intervention and comparison schools, and by point-of-sale in intervention schools, 2014–2015 through 2017–2018 school years (n = 8554 school days). Comp, Comparison; Int, Intervention.
In intervention schools, when traditional lunch lines only were operating, 31% of students purchased school lunch (Table 3). When both vending machines and mobile carts were operating in addition to the lunch lines, no difference in overall lunch participation was observed. However, significant increases in the daily proportion of students participating were observed among non-FRPM-eligible students with the addition of mobile carts only [2.5% (95% CI: 1.9–3.0)], and with the addition of both vending machines and mobile carts [2.8% (95% CI: 2.3–3.3)].
Adjusted Daily Percent of Students Eating School Lunch in Intervention Schools (n = 12) on Days when Additional Point-of-Sale Intervention Components Were Operational vs. Nonoperational (n = 8554 school days)
Data derived from linear mixed-effects models with a random effect for school, adjusted for: total school enrollment; proportion of students eligible for FRPM; proportion of African American, Asian, Latinx, and white students; and school participation in the Community Eligibility Provision program. Intervention schools operated lunch lines only on 54% of days; lunch lines and vending machines 4% of days; lunch lines and mobile carts 15% of days; and lunch lines, vending machines, and mobile carts 27% of days.
Total student enrollment across all 12 intervention schools was 12,764 in 2014–2015; 12,845 in 2015–2016; 12,966 in 2016–2017; and 12,897 in 2018–2019.
Columns represent change in lunch participation from days when only lunch line(s) were operating to the following: (1) lunch line(s) plus vending machine; (2) lunch line(s) plus mobile cart; and (3) lunch line(s) plus vending machine and mobile cart.
Free or reduced-price meal, the California Department of Education's measure of individual student socioeconomic status.
p < 0.001; **p < 0.05.
In the analysis of school lunch participation on days when additional points of sale were operating, we also found evidence of interaction by school type (p = 0.001). When vending machines and mobile carts were operating in addition to traditional lunch lines, the daily proportion of FRPM-eligible middle school students purchasing lunch significantly increased 2.0% (95% CI: 1.2–2.7), but the daily proportion of FRPM-eligible high school students purchasing lunch significantly declined (−1.7%; 95% CI −2.5 to −0.9). When lunch lines plus mobile carts were operating, the daily proportion of non-FRPM-eligible middle school students participating in lunch did not change. However, when vending machines, mobile carts, and vending machines plus mobile carts were operating, the proportion of non-FRPM-eligible high school students participating in lunch increased 1.3% (95% CI: 0.5–2.2), 5.0% (95% CI: 4.3–5.6), and 5.1% (95% CI: 4.5–5.8), respectively.
Discussion
In this quasi-experimental study involving middle and high schools in an urban California school district, we found that the multipronged intervention had a modest, but significant positive effect on school lunch participation, particularly among the highest need students, those who qualify for FRPM. The observed decline in FRPM lunch participation was significantly smaller in intervention than comparison schools (difference-in-difference of 3.1%) and larger in high schools (difference-in-difference 5.0%) than in middle schools (difference-in-difference 1.7%). These modest effects were found in an environment in which there was an overall significant decline in school lunch participation over the course of the 3-year intervention.
Multiple factors may explain the overall decline in lunch participation. First, at the end of the baseline data collection school year, the district city began implementing a yearly minimum wage increase, from $10.74/h in 2014 up to $14/h in 2017. In the first 2 years of the wage increase, eligibility for FRPM (Fig. 1) and meal participation both declined substantially in all schools. Because students eligible for FRPM participate in school lunch at much higher rates than students who are not eligible, 12 and since FRPM eligibility is based on income, it is likely that as students' family incomes rose, fewer students were FRPM eligible, and thus, fewer students participated in school lunch. There is debate in the literature about potential unintended consequences of minimum wage increases for vulnerable families, with some suggesting that the phase-out rate of benefit programs (such as cash welfare and housing assistance) outpaces the benefits of increased earnings, 25 while others argue that families working more and for higher wages are better off. 26 Better understanding how school meal eligibility and participation may be impacted by changes in minimum wage laws is needed.
Other factors also may have contributed to the observed reduction in the proportion of students eligible for FRPM. For example, the city in which the intervention was implemented has been experiencing an economic boom; displacement of lower income families may have contributed to the decline in FRPM eligibility. In addition, changes in the national climate related to immigration may have caused some families to decline school meal participation due to immigration-related fears. 27 In recent years, evidence has begun to emerge suggesting that states across the nation have seen a reduction in federal food program participation, although the degree to which this reduction is related to economic conditions or sociopolitical factors is not well understood. 28
This was a comprehensive multicomponent intervention, and by design, we are not able to tease out which intervention components are responsible for the impacts observed. However, due to variation in implementation, we were able to examine the effects of a major component of the intervention: adding convenient points of lunch service through vending machines and mobile carts. To our knowledge, this is the first study to explore whether placing school lunch in vending machines is effective. We found that when vending machines and mobile carts were operating at intervention schools, lunch participation did not increase overall, but did increase among non-FRPM students, compared to when only lunch lines were operating.
Interestingly, in both our primary and within-group analyses, we found evidence of interaction by school type. There are a few potential explanations for the observed differences in lunch participation between middle and high schools. For one, the district noted that the keypads used on the vending machines required students to enter their birthdays and student ID numbers, which posed a challenge to some students. It is possible that high school students were more easily able to operate the machines than were middle school students. Furthermore, it is possible that the priorities of different students at different school levels vary. For example, convenience of school meals may be a bigger barrier to participation among non-FRPM-eligible students than it is for those eligible for FRPM, which could explain why the mobile carts and vending machines appeared to have a greater influence on non-FRPM-eligible students. In addition, the added convenience of vending machines and mobile carts may be more important to high school students who could otherwise leave the school grounds during the lunch period due to open campus policies. More work is needed to understand the reasons for these observed differential effects on different groups of students by school type.
It is notable that, due to logistical challenges at both the district- and school-site level with implementing the mobile carts and vending machines, both components were not consistently operating until the final year of the study (2017–2018). It is possible that larger increases in lunch participation may have been observed if these additional points of service were more consistently in place.
While these results highlight the potential of vending machines and/or mobile carts to increase lunch sales in secondary schools, their high material and labor costs may not make this approach cost-effective. For example, grant funds supported the district in purchasing and installing these components at substantial capital costs. Furthermore, schools struggled to utilize the mobile carts, facing challenges, including the additional staffing required to operate the carts; moving the large, heavy, carts around campus (mobility turned out to be limited); and getting food safety approvals from the Department of Public Health. Further cost-benefit analysis is needed to understand whether the costs of the intervention result in a return on investment in terms of increased lunch participation over time. Finally, examination of other, more potentially cost-effective interventions for increasing secondary students' lunch participation (e.g., extending lunch periods to provide more time to eat, implementing novel methods for decreasing lunch line wait time, closing campuses so students cannot go elsewhere to purchase lunch, and improving the appeal of the meals), would be valuable.
We drew upon Social Learning Theory in hypothesizing that educating teachers about the school lunch and encouraging them to promote it would impact students' lunch participation and consumption. 21 However, we did not observe an increase in teacher lunch participation. Few studies report on teacher participation in school meals, 29 and little is known about the role of teachers in encouraging secondary students to eat school meals. 21 More research is needed to determine whether increasing teacher school lunch participation is worth further investments. It is possible that motivating teachers to eat school lunches will require more substantial efforts; qualitative exploration on why teachers do/do not choose to eat school lunch and what might encourage them to do so is necessary.
This study was limited by several factors. We suspect that the changes to the local economy combined with immigration-related concerns led to the sharp drop in the number of students eligible for FRPM, which in turn drove large declines in lunch participation. While our design included comparison schools, these external changes challenge our ability to detect whether, under more usual circumstances, the intervention would be more effective. Our initial design was to collect follow-up data after 3 years of full implementation, but implementing the intervention was more difficult than anticipated and, thus, follow-up data were collected after only 1 year of full implementation. It is possible that more time was needed for students to adjust to the new cafeteria environment and meal service options. In addition, the district pilot tested some intervention components in intervention schools before baseline data collection, which may have reduced our ability to detect change. Finally, this analysis did not address dietary behaviors (i.e., meal consumption) during school lunch.
This multipronged intervention that redesigned school cafeterias, increased school lunch points of sale, and educated teachers was found to be modestly effective in limiting a decline in school lunch participation, particularly among FRPM-eligible students. More work is needed to understand what additional factors should be addressed, such as whether school foods served are aligned with students' preferences, how open campuses and nearby food environments impact students' lunch choices, and what schools can do to further increase student uptake of school lunch. Additional research is also warranted to explore the impacts of broader public policies and changes to economic conditions on school meal participation.
Footnotes
Funding Information
This study was funded by the United States Department of Agriculture, National Institute of Food and Agriculture, Technology and Design Innovation to Support 21st Century School Nutrition (Grant ID: 2015-68001-23236).
Author Disclosure Statement
No competing financial interests exist.