
Abstract
Background:
Differences in gut microbiota composition have been associated with obesity and metabolic alterations in children. The aim of this study was to analyze the abundance of the main bacterial families of the gut among children according to their body composition and metabolic markers.
Methods:
A cross-sectional study was conducted with 93 school-aged children (8.4 ± 1.6 years old). Anthropometric and body composition variables were measured and a blood sample was collected to determine glucose, insulin, lipid profile, C-reactive protein, leptin, and cytokines [interleukin 6, interleukin 10 (IL-10), tumor necrosis factor α (TNFα)]. DNA was extracted from stool samples and the abundance of bacterial families (Bacteroidaceae–Porphyromonadaceae–Prevotellaceae, Lactobacillaceae, Enterococcaceae, and Lachnospiraceae–Ruminococcaceae) was determined by qPCR assays.
Results:
Children with obesity and high waist/height ratio had lower Bacteroidaceae–Porphyromonadaceae–Prevotellaceae and higher abundance of Lactobacillaceae when compared with normal-weight children. TNFα was negatively associated and IL-10 was positively associated with Bacteroidaceae–Porphyromonadaceae–Prevotellaceae. Triglycerides showed a positive relationship with Lachnospiraceae–Ruminococcaceae whereas high-density lipoprotein-cholesterol was negatively associated with Lactobacillaceae.
Conclusion:
In rural Mexican school-aged children, a low abundance of Bacteroidaceae–Porphyromonadaceae–Prevotellaceae and a high abundance of Lactobacillaceae are associated with obesity and metabolic disturbances.
Introduction
Mexico has one of the highest rates of childhood obesity. According to the National Health and Nutrition Survey, there is a combined prevalence of overweight and obesity of 33.2% among school-aged children. 1 Obesity is a multifactorial disease and many studies have observed that gut microbiota can be a crucial factor in the development of obesity.2–4
Over the past 10 years, studies have focused on identifying the microbiota at different taxonomic levels, characterizing the species or communities that could be playing a role in the onset of obesity. A higher abundance of Firmicutes and a lower abundance of Bacteroidetes have been associated with obesity in adults, adolescents, and children.5–7 The Firmicutes/Bacteroidetes ratio has been used in a variety of studies as a novel biomarker of metabolic alterations; however, results are not consistent.8–14
The analysis at family level has increased in the last 5 years.2,15–17 For instance in Mexican pediatric population obese children have shown a lower abundance of Christensenellaceae, 2 Lactobacillaceae, 15 Bacteroidaceae, 16 and higher abundance of Peptoestreptococcaceae, Coriobacteriaceae, 15 Prevotellaceae, 16 and Lachnospiraceae. 17
The sequencing of the 16s rRNA gene obtained from fecal samples has revealed that there are at least seven bacterial families that are representative of the human gut. Within the Bacteroidetes phylum, there is a higher abundance of Bacteroidaceae, Prevotellaceae, and Porphyromonadaceae, and among the Firmicutes phylum, Lachnospiraceae, Ruminococcaceae, Lactobacillaceae, and Enterococcaceae are the most predominant communities.18,19 Up to 95% of all bacteria found in the human gut can be classified within these seven families. 20
Based on these observations, the purpose of this study was to analyze the abundance of the main bacterial families in the gut of school-aged children according to their body composition and metabolic markers using qPCR validated primers as a cost-effective and sensitive method to analyze differences in the microbiota structure.
Methods
Subjects and Experimental Design
A cross-sectional study was conducted with 93 school-aged children (8.4 ± 1.6 years old), 50 girls and 43 boys, recruited from two rural communities (Santa María Begoña and Santa Cruz) of Querétaro State, México. The study was conducted according to the guidelines of the Declaration of Helsinki (2013) 21 and all procedures involving human patients, were approved by the Bioethics Committee of the School of Natural Sciences at the Universidad Autónoma de Querétaro (UAQ) (Protocol # 7335). Written and verbal informed consent was obtained from parents and caretakers.
Children that had received any antibiotic treatment, micronutrient supplementation, prebiotic or probiotic supplementation in the last 4 months, or who had any physical or mental disability, were excluded from the study. Children's parents or caretakers were asked to attend their local health clinic to provide their medical history and complete a socioeconomic status questionnaire.22,23 Participants received a labeled sterile polypropylene flask with written instructions on how to collect the stool sample. The next morning, children were transported from their local communities to the Nutrition Clinic at UAQ for anthropometrical and body composition measurements, and for the collection of stool samples.
Anthropometry and Body Composition
Weight and height were measured in duplicate and in nonconsecutively occasions by trained personnel following the World Health Organization (WHO) procedures. 24 Weight was determined using a calibrated digital scale (SECA Mod. 813, Hamburg, Germany) and height was measured with a portable stadiometer (SECA Mod 206, Hamburg, Germany). Nutritional status was calculated based on the WHO criteria of BMI-for-age for children 5–19 years of age. Underweight was defined as two z-scores below the WHO reference median, overweight as one standard deviation, and obesity as two standard deviations above the reference median of the BMI-for-age z-score. 25
Whole-body composition was measured by a certified technician to determine abdominal fat mass, abdominal fat percent, body fat mass, and body fat percent, using dual-energy X-ray absorptiometry (DEXA) (Hologic Mod Explorer, Bedford, MA). Abdominal fat mass and abdominal fat percent were estimated following a previously described procedure; briefly the region of interest was defined as quadrilateral boxes extending 10 cm above the iliac crest and laterally to the edges of the abdominal soft tissue, and all trunk tissue within this standardized region was analyzed to determine fat mass and fat percent. 26 Excess body fat for girls was considered above 30%, and for boys above 25%.27,28
Blood Samples
A fasting blood sample was collected from each individual on their first visit to the community health clinic. Children had to fast for at least 12 hours before the blood sample was collected early in the morning. 29 All analysis were performed at the Human Nutrition Laboratory at UAQ.
High-density lipoprotein cholesterol (HDL) and low-density lipoprotein cholesterol (LDL) were assessed by spectrophotometry (Genesys 20; Thermo Scientific, MA) using commercial kits (#HDLL0230 Cholesterol HDL; Elitech, Sées, France; #MX41023 Cholesterol LDL, Spinreact, Sant Esteve de Bas, Spain). Triglycerides (TG) and total cholesterol were determined in plasma with commercial kits (#CHSL0250 Cholesterol, Elitech; #TGML0250 Triglycerides, Elitech) using a clinical chemical analyzer (Bayer RA-50, Bayer Diagnostics, Dublin, Ireland). High-value thresholds were, for total cholesterol ≥200 mg/dL; for LDL cholesterol ≥130 mg/dL; and for TG, ≥100 mg/dL for children <9 years of age and ≥130 mg/dL for children >10 years of age. HDL concentrations were considered low with values <40 mg/dL. 30
Fasting glucose was assessed by a colorimetric-enzymatic method, using a commercial kit (#GHSL0250 Glucose; Elitech) and a clinical chemical analyzer (Bayer RA-50, Bayer Diagnostics, Leverkusen, Germany). Insulin concentration in serum, was determined by a commercial ELISA kit (#EZHI Millipore, MA) using a microplate photometer (Multiskan Ascent; Thermo Electron Corporation, Waltham, MA). Insulin resistance was determined using the Homeostatic Model Assessment (HOMA) with the following formula: HOMA = (insulin × glucose)/22.5. 31 Children with fasting glucose ≥100 mg/dL was considered prediabetic, indicating a high risk for diabetes. 32 Insulin resistance was defined with a HOMA value >3.16. 31
Interleukin 6 (IL-6), interleukin 10 (IL-10), and tumor necrosis factor α (TNFα) were quantified using commercial kits (#EZHIL6, #EZHIL10, #EZHTNFA Millipore, MA), C-reactive protein (hsCRP) was quantified in serum using a commercial high-sensitivity ELISA Kit (#BQ130C Bioquant, CA) and leptin was measured using a commercial ELISA Kit (#EZHL). All ELISAs were read in a Multiskan Ascent microplate photometer (Thermo Electron Corporation). Low-grade systemic inflammation was considered when hsCRP >3 mg/L. 33
Stool Samples
Parents or caretakers were asked to collect a stool sample from their child in a sterile flask (provided) and to store the flask in their fridge at 4°C. Samples were collected by the staff the next morning and once in the laboratory, stool samples were kept at −20°C until further analysis.
Before DNA extraction, samples were washed with 500 μL of ethanol (#E7023 Sigma-Aldrich, MO), to eliminate fat from stool. DNA was extracted from 2.5 grams of washed stool using a commercial extraction kit (#12855-50 PoweLyzer Power Soil DNA Isolation Kit, MoBio, CA) following the manufacturer's protocol. DNA quantity and quality was verified using NanoDrop and electrophoresed on a 1% agarose gel stained with Sybr Safe (#S33102 Thermo Fisher Scientific) to confirm DNA integrity.
The bacterial family abundance was determined by quantitative PCR (qPCR) using a CFX96 Real-Time PCR System (Bio-Rad, Hercules, CA) and SYBR Green PCR technology (#RR420Q Clontech Laboratories, CA). Total bacterial abundance was estimated using primers designed to amplify a 359 bp fragment of the rpoB gene. This gene was used because it does not present heterogeneity between copies and provides a more reliable data about the amount of bacteria in a given sample. 34 Each 15 μL qPCR mixture consisted of 7.5 μL of 2X SYBR Green Master Mix, 2.25 μL of BSA (100 μg/mL) (#B900S New England Biolabs, United Kingdom), 0.6 μL of each primer (10 μM), rpoB1698f (5′-AACATCGGTTTGATCAAC-3′) and rpoB2041r (5′-CGTTGCATGTTGGTACCCAT-3′), 34 3 μL of extracted genomic DNA (4 ng/μL), and 1.05 μL PCR-grade water. PCR was performed by initial denaturation at 94°C (3 minutes), 35 cycles of denaturation at 94°C (45 seconds), primer annealing at 55°C (30 seconds), and extension at 72°C (30 seconds), followed by one cycle of 72°C (5 minutes).
Density (ng of DNA per gram of feces) of selected bacterial families was determined by qPCR assays using previously validated bacterial group-specific 16S rRNA gene primers. Bacteroidaceae–Porphyromonadaceae–Prevotellaceae (forward = 5′-GGTGTCGGCTTAAGTGCCAT-3′ and reverse = 5′-CGGA(C/T)GTAAGGGCCGTGC-3′), Lachnospiraceae–Ruminococcaceae (forward = 5′-CGGTACCTGACTAAGAAGC-3′ and reverse = AGTTT(C/T)ATTCTTGCGAACG), Enterococcaceae (forward = 5′-CCCTTATTGTTAGTTGCCATCATT-3′ and reverse = 5′-ACTCGTTGTACTTCCCATTGT-3′), 35 and Lactobacillaceae (forward = 5′-AGCAGTAGGGAATCTTCCA-3′ and reverse = 5′- CACCGCTACACATGGAG-3′). 36
Primer targets were checked using the Probe Match tool from the RDP database. For all primer sets, an annealing temperature of 55°C was used, determined empirically by a temperature gradient PCR. Each 15 μL qPCR mixture consisted of 7.5 μL of 2X SYBR Green Master Mix, 1.5 μL of BSA (100 μg/mL), 0.75 μL of each primer (10 μM), 3 μL of extracted genomic DNA (4 ng/μL), and 1.5 μL PCR-grade water. The cycling protocol for the four primer sets was as follows: initial denaturation at 94°C (3 minutes), 35 cycles of 94°C (45 seconds), 55°C (30 seconds), 72°C (30 seconds), followed by one cycle of 72°C (5 minutes). Denaturation curves were determined from 60°C to 95°C for all products for quality assurance.
For each qPCR assay, a calibration curve was determined using a stool pool from five random participants, concentrations of DNA used in the standard curves ranged from 10.9 to 0.003 ng/μL. Standard curves were amplified at the same time as stool samples. All qPCR amplifications were performed in triplicate. For each family, signals were normalized using the amount of DNA determined divided by the amount of DNA from rpoB gene. The abundance of bacterial families was reported as the natural logarithm (ln) of ng of DNA per gram of feces. 20
Statistical Analyses
Descriptive analyses were performed for all variables. The distribution of dependent variables was explored to confirm their normality with the Kolmogorov–Smirnov test. Data that did not have a normal distribution was transformed using the natural logarithm (TNFα and leptin). General characteristics of children were examined and compared among BMI categories with analysis of variance (ANOVA). Between-group comparisons were evaluated with the Tukey post hoc test.
Linear regression models were also used to examine the association between the abundance of four bacterial groups, as independent variables, with the anthropometrical and biochemical variables as dependent variables. We checked the models for evidence of non-normally distributed residuals, heterogeneity of variance, and disproportionate influence of outliers. An ANOVA was performed to examine whether bacterial abundance varied between groups formed by altered anthropometrical, body composition, and metabolic markers.
Variables that did not have cutoff points to determine altered measures (abdominal fat %, cytokines and leptin) were divided according to the median. Biochemical variables were adjusted by BMI for age Z score as a confounding factor and all statistical analyses were performed with SPSS 18.0 (SPSS, Chicago) and p-values below 0.05 were considered significant.
Results
Anthropometric and Biochemical Characteristics of the Children
Of the children included in the study, 53% were girls and 46% boys. The prevalence of overweight and obesity, determined by BMI for age Z score, was 23% and 17%, respectively. Children with a waist to height ratio ≥0.5 represented 38% of the population, and a total of 59% of the children had excess body fat, according to the total body fat mass percentage determined by DEXA. Almost a third (30%) had high TG, 27% had low HDL, and 21% had insulin resistance. Additionally, 21% had low-grade systemic inflammation measured by hsCRP. The main characteristics of the studied children are shown in Table 1.
Main Characteristics of the Studied Children According to BMI for Age (n = 93)
Different letters within the same row are significantly different p < 0.05 in post hoc comparison (Tukey test).
Variables were retransformed after using the natural logarithm.
BPP, Bacteroidaceae–Porphyromonadaceae–Prevotellaceae; ECC, Enterococcaceae; HDL, high-density lipoprotein; HOMA, Homeostatic Model Assessment; hsCRP, high-sensitive C reactive protein; LAC, Lactobacillaceae; LDL, low-density lipoprotein; ln, Natural logarithm; LRC, Lachnospiraceae–Ruminococcaceae; SD, standard deviation; TG, triglycerides; TNFα, tumor necrosis factor α.
Association between Bacterial Family Abundance and Body Composition
The families Bacteroidaceae–Porphyromonadaceae–Prevotellaceae were negatively related BMI for age Z score, waist circumference, waist to height index, abdominal fat, abdominal fat percent, total body fat, and total body fat percent. In contrast, Lactobacillaceae showed a positive relationship BMI for age Z score, waist circumference, waist to height index, abdominal fat, abdominal fat percent, total body fat, and total body fat percent (Table 2). Waist circumference presented the highest adjusted R2; 16% of its variation was explained by a positive association with Lactobacillaceae and a negative association with Bacteroidaceae–Porphyromonadaceae–Prevotellaceae.
Linear Regression Models Between Anthropometric and Biochemical Variables in Association with the Abundance of the Main Bacterial Families (n = 93)
Values are unstandardized coefficients B (95% CI).
Statistically associated p < 0.05.
Model adjusted by BMI for age.
Variables were retransformed after using the natural logarithm (ln).
Association between Bacterial Family Abundance and Metabolic Risk Factors
The families Bacteroidaceae–Porphyromonadaceae–Prevotellaceae were negatively associated with levels of TNFα (p = 0.034) and positively associated with levels of IL 10 (p = 0.043). Lactobacillaceae was negatively associated with HDL levels (p = 0.012), and Lachnospiraceae–Ruminococcaceae families related positively with TG levels (p = 0.03) (Table 2). The rest of the biochemical markers were not associated with any bacterial family.
Differences in Bacterial Family Abundance According to Body Composition and Metabolic Risk Factors
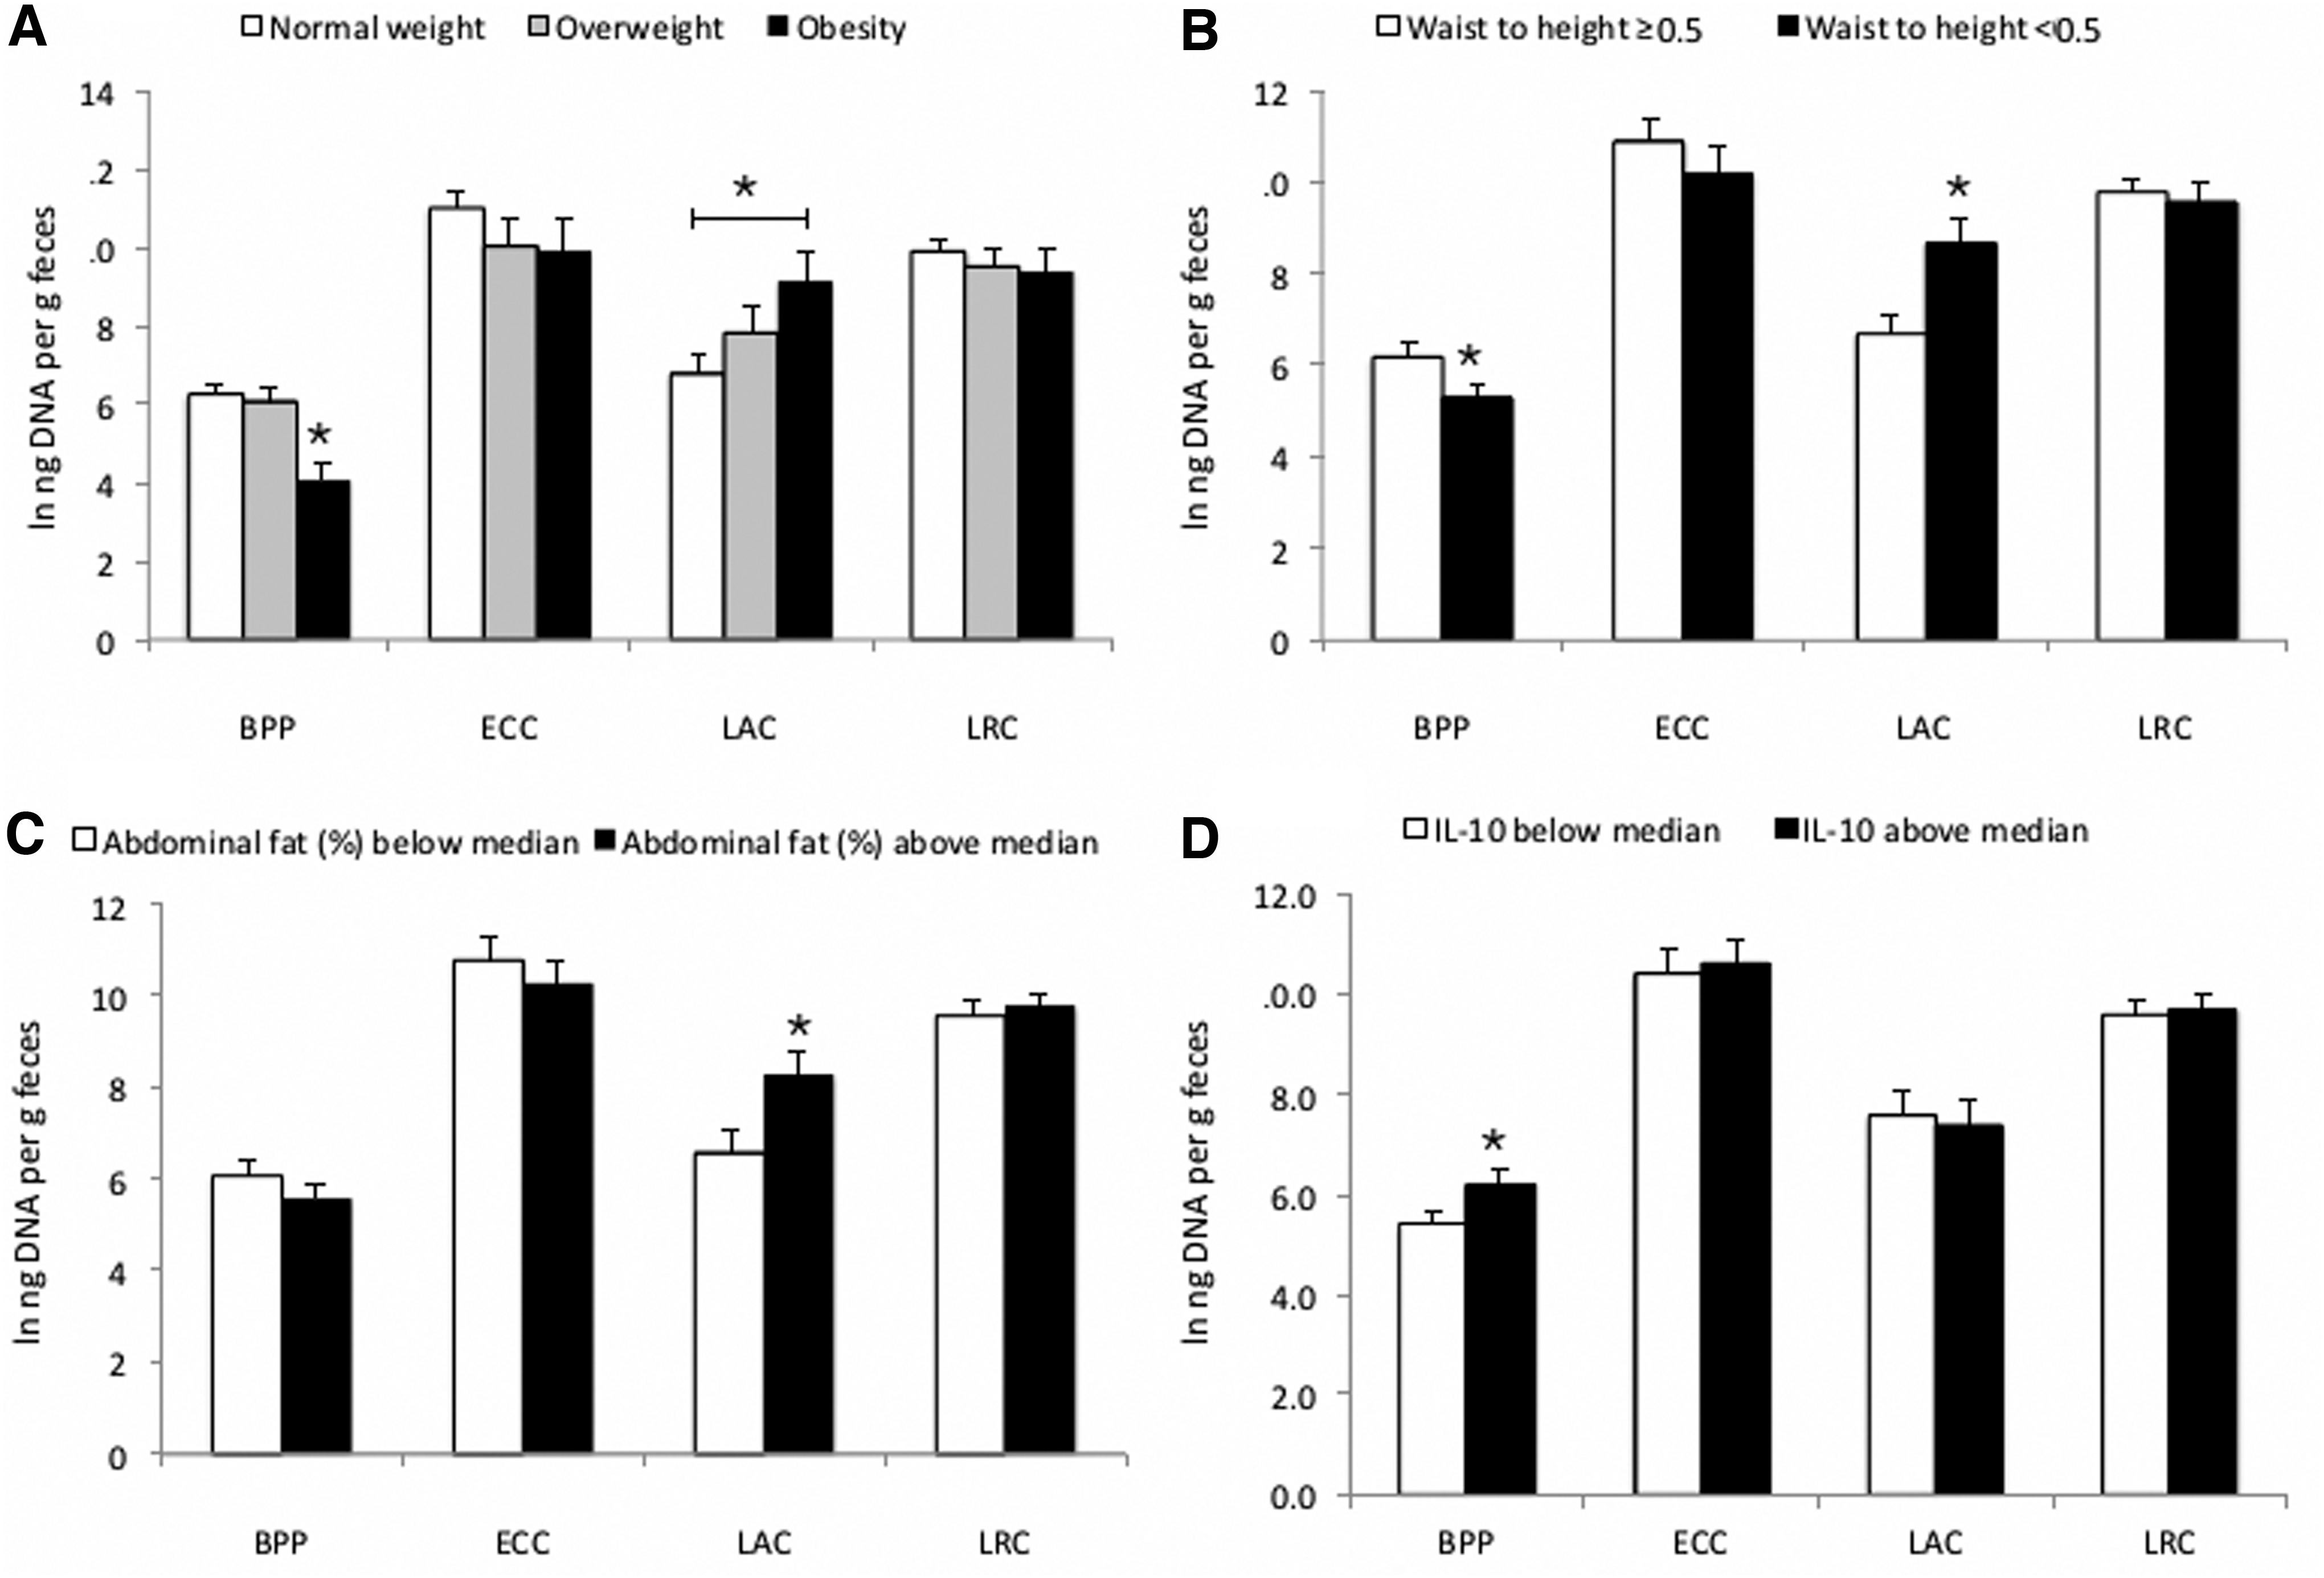
The ANOVA test showed significant mean differences among normal weight, overweight, and obesity according to BMI for age Z score. Obese children had lower abundance of Bacteroidaceae–Porphyromonadaceae–Prevotellaceae when compared with normal and overweight children. In addition, obese children showed higher abundance of Lactobacillaceae when compared with normal-weight subjects (Fig. 1A). Children with high waist to height ratio (<0.5) had significantly lower abundance of Bacteroidaceae–Porphyromonadaceae–Prevotellaceae and higher abundance of Lactobacillaceae (Fig. 1B).
Comparison of mean (ANOVA) between anthropometrical and biochemical variables and their association with the main bacterial families studied.
Children with abdominal fat percent above median (>24%) showed higher abundance of Lactobacillaceae (Fig. 1C). Regarding metabolic risk markers, children with IL-10 levels above the median (>3.45 pg/mL) had higher abundance of Bacteroidaceae–Porphyromonadaceae–Prevotellaceae (Fig. 1D). Bacterial abundance among all other anthropometric and biochemical variable groups did not show statistical significance (data not shown).
Discussion
The present study showed obesity, inflammation, and lipids were associated with a lower abundance of Bacteroidaceae–Porphyromonadaceae–Prevotellaceae and higher abundance of Lactobacillaceae when compared with normal-weight children. Also, TG showed a positive relationship with Lachnospiraceae–Ruminococcaceae.
The lower abundance of Bacteroidaceae–Porphyromonadaceae–Prevotellaceae found in children with obesity and excess body fat, is similar to other cross-sectional studies in children. For instance, a recent study found that obese children had lower Bacteroides–Prevotella–Prohyromonas spp. abundance when compared with normal-weight children. 5 Similarly, a decrease in Bacteroidaceae was found in children with obesity according to the BMI z-score. 3 In Mexican children, a study found that Bacteroides plebeius had a higher abundance in normal-weight children when compared with children with obesity. 2 In obesity, a decrease in the abundance of Bacteroidaceae–Porphyromonadaceae–Prevotellaceae seems to be associated with increased intestinal permeability and, hence, with an increase in the absorption of lipopolysaccharide (LPS).37–39
Obesity is associated with chronic subclinical inflammation. 40 It has been reported that LPS derived from intestinal Gram-negative bacteria is involved in the production of inflammatory cytokines through activation of Toll-like receptor, thus contributing to the inflammatory state observed in obesity and insulin resistance. 41 Our findings suggest that an increased abundance of Bacteroidaceae–Porphyromonadaceae–Prevotellaceae associates with lower TNF-α levels, which is consistent with the findings of d'Hennezel. 42 Families such as Bacteroidaceae–Porphyromonadaceae–Prevotellaceae present an underacylated lipid A form that produces a LPS isoform that inhibits Toll-like receptor 4 (TLR4) signaling, reducing the production of TNF-α. These could be responsible for the immunoinhibitory and immunosilent properties of these bacterial families that contribute to immune tolerance. 43
Additionally, we found that IL-10, an anti-inflammatory cytokine, showed a positive relationship with the abundance of Bacteroidaceae–Porphyromonadaceae–Prevotellaceae. Thus, the association of a higher abundance of Bacteroidaceae–Porphyromonadaceae–Prevotellaceae with lower levels of TNF-α and higher levels of IL-10 may ameliorate the permeability of the gut and improve the inflammatory profile through the inhibition of TLR4 signaling. Nevertheless, studies performed in Mexican children had revealed that there is a higher abundance of the genus Prevotella in obese children.16,17
The lower abundance of Bacteroidaceae–Porphyromonadaceae–Prevotellaceae in our obese children population could be due to an interaction between these families. Future analysis should consider the analysis of these three families separately.
A direct relationship between the abundance of Lactobacillaceae was observed in children with visceral obesity, whereas an inverse association was observed between this family and HDL levels. A study that compared obese, normal weight, and anorectic patients, showed that the obese group had a microbiota enriched in Lactobacillus. 12 Similarly, a high abundance of Lactobacillus species were found in obese children in another study. 5 In Mexican children, a study found that Lactobacillus were more abundant in obese children. 15
A meta-analysis showed that some Lactobacillus species such as L. acidophilus, L. ingluviei, and L. fermentum are associated with weight gain, whereas L. gasseri and L. plantarum are associated with weight loss. 44 These differences lie in the genes that codify for different enzymes among species. Lactobacillus that are linked to weight gain, lack enzymes involved in fructose metabolism and harbor enzymes involved in lipid metabolism. In contrast, weight loss-associated species have enzymes implicated in fructose, mannose, starch, and sucrose metabolism. 45 Additionally, a meta-analysis comprising the effect of Lactobacillus on lipid profile in both children and adults have shown mixed results.46,47 For instance, the supplementation of L. acidophilus showed a significant increase of HDL cholesterol levels, probably as a consequence of the inhibition of synthesis of fatty acids in the liver by the short-chain fatty acids (SCFA) produced by this bacteria. 48
Altogether, the empirical evidence available indicates that not all members of the Lactobacillaceae family are beneficial to human health. In our study, a broad spectrum of the Lactobacillaceae family was assessed, showing that an increase in this family is associated with obesity and metabolic disturbances. More studies are needed to define which particular Lactobacillaceae members contribute to the development of obesity and metabolic disturbances.
Finally, Lachnospiraceae–Ruminococcaceae associated with higher levels of TG. Similar results were observed in healthy adults where Coprocccus comes (Lachnospiraceae) correlated with TG levels. 49 Our results are similar to a study made in Mexican children that showed that TG levels are increased in overweight and obese populations. These children also had altered propionic and butyric concentrations in feces, and a higher abundance of Lachnospiraceae. The hypothesis is that an increase in SCFA absorption may be responsible for the higher levels of TG observed in these populations. 17
Our data show that the composition of fecal microbiota at the family level could be used as a cost-effective method to identify differences among anthropometrical and metabolic markers at the clinical field. Also, we consider that the analysis at family level gives more specific information about the changes in microbiota than when analyzing at the phylum level. For instance, we found that not all members of the Firmicutes remain high in obesity.
Our results suggest that Lactobacillaceae, a representative transient family of the human gut, seems to influence the overall abundance of Firmicutes observed in some studies. 3 However, these results should be interpreted with caution. Even though we found association with bacteria at the family level, groups as Lactobacillaceae should be analyzed at a deeper level and functional analysis must be considered to establish a metabolic profile. Also, we must consider in future studies the quantification of Bacteroidaceae–Porphyromonadaceae–Prevotellaceae independently, to assure a more detailed analysis of the community, and the addition of some other bacterial families, such as Christensenellaceae and Bifidobacteriaceae, could give us broader information about the association of the microbiota with nutritional and metabolic variables.
The strengths and limitations of our study need to be addressed. Due to the cross-sectional design of this study, causality could not be established. For the microbiota analysis, only one fecal sample was collected per individual, which limits the accuracy of the family profiles. The lack of 16S rRNA sequencing limits the results to the targeted families. However, we could observe differences in family abundances and were able to detect significant associations between these abundances and clinical and biochemical variables. To our knowledge, this is one of few studies that assesses anthropometric and metabolic markers and associates them with the microbiota at the family level using validated qPCR primers for the seven representative families of the human gut.
In conclusion, the abundance of Bacteroidaceae–Porphyromonadaceae–Prevotellaceae and Lactobacillaceae associates with obesity, HDL-cholesterol, TNFα, and IL-10 in school-aged children. The analysis of microbiota at the family level can be used to determine their association with obesity and metabolic risk markers.
Footnotes
Funding Information
This study was partially funded by Universidad Autónoma de Querétaro (FOFI #FNN-2014-02) and by Consejo Nacional de Ciencia y Tecnología (CONACYT), which provided the PhD grant (#332055).
Author Disclosure Statement
No competing financial interests exist.