
Abstract
Objective:
To evaluate the efficacy of childhood obesity interventions and conduct a taxonomy of intervention components that are most effective in changing obesity-related health outcomes in children 2–5 years of age.
Methods:
Comprehensive searches located 51 studies from 18,335 unique records. Eligible studies: (1) assessed children aged 2–5, living in the United States; (2) evaluated an intervention to improve weight status; (3) identified a same-aged comparison group; (4) measured BMI; and (5) were available between January 2005 and August 2019. Coders extracted study, sample, and intervention characteristics. Effect sizes [ESs; and 95% confidence intervals (CIs)] were calculated by using random-effects models. Meta-regression was used to determine which intervention components explain variability in ESs.
Results:
Included were 51 studies evaluating 58 interventions (N = 29,085; mean age = 4 years; 50% girls). Relative to controls, children receiving an intervention had a lower BMI at the end of the intervention (g = 0.10, 95% CI = 0.02–0.18; k = 55) and at the last follow-up (g = 0.17, 95% CI = 0.04–0.30; k = 14; range = 18–143 weeks). Three intervention components moderated efficacy: engage caregivers in praise/encouragement for positive health-related behavior; provide education about the importance of screen time reduction to caregivers; and engage pediatricians/health care providers.
Conclusions:
Early childhood obesity interventions are effective in reducing BMI in preschool children. Our findings suggest that facilitating caregiver education about the importance of screen time reduction may be an important strategy in reducing early childhood obesity.
Introduction
Childhood obesity is a major public health challenge, with one in three US children between the ages of 2 and 5 meeting criteria for overweight or obesity. 1 The urgency to reverse the course of childhood obesity has led to significant growth in the scientific literature evaluating childhood obesity interventions. Extant reviews of this research have provided limited guidance regarding strategies to reduce the rates of childhood obesity among preschool-age children living in the United States, because most reviews include children from a wide age range (e.g., 2–18 years of age) and multiple countries; report varying outcomes measures (e.g., BMI, nutrition, and/or physical activity); or are limited to a specific intervention setting (e.g., schools).2–12 Traditional meta-analytic reviews often narrowly focus on the efficacy of childhood obesity interventions as a whole and do not address the conditions under which the intervention is most impactful.
The objective of this systematic review and meta-analysis is twofold: (1) to evaluate the scientific evidence regarding the efficacy of obesity interventions measuring BMI for children 2–5 years of age living in the United States and (2) to develop and apply a taxonomy of intervention components to identify specific components that increase the efficacy of these interventions in their context. Efficacy was measured as change in BMI, because it is the most commonly used indicator to assess overweight and obesity in children. 13 We hypothesized that children receiving interventions to prevent obesity or improve weight status would experience less gain in BMI, or perhaps reductions in BMI, relative to children comparable in age, who did not receive the intervention.
Understanding childhood obesity programs requires developing methods not only to address the question of whether a given intervention works but also to better understand what works, for whom, and under what conditions intervention efficacy is improved. 14 Childhood obesity prevention interventions are often evaluated as a whole, as opposed to the specific elements that comprise the interventions, which hinders effective implementation and dissemination of evidence-based approaches to reduce obesity (cf Ma et al. 15 ). Therefore, a taxonomy of intervention components was developed by using the grounded theory16,17 to identify the specific content of the interventions and considered within the socioecological model (SEM).18,19 (A detailed description of the taxonomy development is described in the Methods paper for this project. 19 )
We also examined the extent to which the efficacy of the interventions depended on characteristics of the samples and methods. Hypothesized moderators included: (1) child demographic characteristics (e.g., proportion obese or overweight at baseline, race/ethnicity, and socioeconomic status); (2) elements of study or intervention design (e.g., recruitment site, implementation setting, intervention recipient, content focus, and duration); and (3) intervention components (e.g., provide education about nutrition and healthy eating patterns to caregivers, engage caregivers in supporting physical activities). We expected that childhood obesity interventions would be more effective when: (1) fewer children of low socioeconomic status or race/ethnic minorities (as healthy lifestyle changes are challenging for caregivers and children experiencing financial hardship 20 or living in disadvantaged neighborhoods 21 ) or more children meeting criteria for overweight or obesity (given emerging evidence that individual differences in behavioral phenotypes for childhood obesity may impact the efficacy of obesity prevention and treatment interventions 22 ) were included in the study samples; (2) the sample was recruited from and the intervention was implemented in a school-based setting (as school-based interventions have been shown to be more effective in reducing BMI than interventions implemented in other settings, such as home); 11 and (3) targeted both healthy nutrition and physical activity 4 and involved a caregiver 23 (caregiver refers to a parent, grandparent, other adult family members, or foster-parent who is directly responsible for the care of a child). Because the goal of a taxonomy is to identify intervention components as they emerge in the childhood obesity intervention programs, no hypotheses were generated about the efficacy of the specific individual or combination of components.
Methods
This systematic review and meta-analysis was performed by using established meta-analytic methods24,25 and reported in accordance with the Preferred Reporting Items for Systematic Reviews and Meta-Analyses (PRISMA) Statement. 26 The PRISMA checklist (Supplementary Table S1) is available at https://www.nccor.org/childhood-obesity-evidence-base-test-of-a-novel-taxonomic-meta-analytic-method.
Eligibility Criteria
The study inclusion criteria were developed based on the Population, Interventions, Comparisons, Outcomes, and Study Design (PICOS) framework. 27 Eligible studies: (1) assessed children aged 2–5 years at the beginning of the invention, living in the United States; (2) evaluated an intervention to prevent obesity in children; (3) identified a same-aged control or comparison group; (4) assessed BMI [weight (kg)/height (m2)], BMI percentile, or BMI z-score; and (5) were available (published or unpublished) between January 1, 2005 and August 31, 2019.
Information Sources
A comprehensive strategy was used to identify, locate, and retrieve available scientific research reports. (This search was independent of the search conducted in the development of the intervention component taxonomy. 19 ) Our primary strategy involved searches of electronic bibliographic databases (e.g., PubMed, Embase). To supplement this primary strategy, we also reviewed relevant published reviews and meta-analyses, reference lists of manuscripts retrieved from our database searches, electronic databases of funded research (NIH RePORTER), and registered clinical trials (www.ClinicalTrials.gov); we consulted with members of the National Collaborative on Childhood Obesity Research (NCCOR) Childhood Obesity Evidence Base (COEB) Project Workgroup (WG) and External Expert Panel (EEP).
Search Strategy
The search string was developed based on the intended recipients and outcome of interest, and it included Boolean operators, wildcard symbols, and quotations that used a combination of the following broad terms: childhood, obesity, and intervention. Because some electronic databases have a controlled vocabulary thesaurus to index records [e.g., Medical Subject Heading (MeSH) terms used in PubMed], specific search parameters were developed for each database. The full search string used for each electronic database search can be found in Supplementary Data S1. A broad search of the childhood obesity literature was conducted rather than restricting the search to children 2–5 years of age to ensure retrieval of all studies that included the targeted age range (i.e., mean age 2 to ≤5 years). No language, geographical region, or publication date restrictions were applied. All electronic bibliographic searches were conducted in June 2019. Records retrieved from each database were imported into a reference management software library (EndNote X8 28 ), and duplicate records were automatically removed.
Study Selection
All records retrieved from the electronic database searches were screened for inclusion based on the title and abstract by two reviewers. This initial screening was conducted to identify any additional duplicate records, irrelevant records, review papers, editorials, and commentaries. Full-text documents of potentially relevant records and references from manuscripts were reviewed based on the inclusion criteria. Registries of funded research and clinical trials were cross-checked with the relevant full-text manuscripts to ensure the retrieval of all available reports. If the study methods or data were reported in multiple documents, they were linked in the database and represented as a single study to avoid multiple/duplicate publication bias. The manuscript reporting the most complete data was selected as the primary study; additional documents were considered supplemental (e.g., clinical trial record, protocol) but were consulted in the data collection process.
Data Collection Process
Two trained coders independently extracted relevant study information (e.g., publication year) from the primary study and supplemental manuscripts, as well as intended recipient characteristics (e.g., age, gender, race/ethnicity), design and measurement (e.g., random assignment), and intervention details (e.g., dose, number of sessions, length, and duration). In addition to the intended recipient and intervention context characteristic taxonomies developed for the COEB project, a taxonomy of intervention components with 93 distinct components, grouped into 9 categories, were used to identify the specific activity components of the intervention. 19 For each intervention, the distinct components were coded as present (1) or absent (0). Intervention components were coded as absent if no clear evidence of the component could be identified from the intervention details provided in the primary study manuscript or the supplemental documents.
Disagreements between coders were reviewed, discussed, and reconciled by the coders; any unresolved disagreements were reviewed and finalized by the lead methodologist (L.A.J.S.S.). Inter-rater reliability was assessed across the study, sample, design, and intervention characteristics coded. For the categorical variables, coders agreed on 90% of the judgments (mean Cohen's κ = 0.68; range = 0.20–1.00). For the continuous variables, the average intra-class correlation coefficient (ρ) was 0.88 (median = 1.00).
Risk of Bias in Individual Studies
The Cochrane Risk of Bias Assessment Tool (Version 5.1.0) was used to assess the risk of bias in each study. 29 The tool assesses seven sources of bias: random sequence generation, allocation concealment, blinding of participants and personnel, blinding of outcome assessment, incomplete outcome data, selective reporting, and other. The sources of bias are assigned a judgment of high, low, or unclear risk of bias when study details are insufficient to make a judgment of the level of risk.
Study Outcomes
The primary study outcome considered for this meta-analysis was change in BMI expressed as weight (kg)/height (m2), percentile, or z-score because it is the most commonly used indicator to assess overweight and obesity in children. 13 Other discrete measures of BMI (e.g., overweight, obesity) were also included. Secondary outcomes such as measures of physical activity, diet, and sleep were identified during the taxonomy development and included in the outcomes taxonomy, but they were not included in the current meta-analysis due to inconsistent reporting methods and the limited number of studies including these measures.
Summary Measures
Effect sizes (ESs) were calculated as the pretest–post-test change in BMI divided by the pretest standard deviation (SD) in BMI within each condition and then subtracting the control group from the intervention group.30,31 Thus, all ESs controlled for baseline. If a study reported proportions, an odds ratio was calculated and transformed to a standardized mean difference ES by using the Cox transformation. 32 The sampling variance for each ES was calculated by using standard procedures, correcting for sample size bias (Hedges' g).31,33 Multiple ESs were calculated from individual studies when the study reported more than one outcome, timepoint, or intervention condition, or when outcomes were separated by sample characteristics (e.g., girls and boys). To avoid violating the assumption of independence,25,34 we: (1) assessed each outcome separately; (2) clustered the ESs by timepoint (end of intervention and last follow-up assessment); and (3) conducted sensitivity analyses to determine whether multiple comparisons from a single study affected the overall outcomes. 34 An overall measure of BMI change was created by: (1) using the BMI metric reported among the studies reporting only one metric; and (2) averaging ESs from studies reporting more than one BMI metric (e.g., percentile, z-score). Positive ESs indicated smaller BMI increases over time among children who received the intervention relative to the comparison group.
Synthesis of Results
The distribution of the ESs for each dependent variable was inspected for possible outliers; extreme ESs (i.e., ESs more than 1.5 times the interquartile range beyond the 25th and 75th percentiles) were removed, and the magnitude and direction of the pooled ESs with or without the outliers were compared. Hedges' g (and corresponding 95% CIs) were calculated by using random-effects procedures. The between-study variance was estimated by using full information maximum likelihood. 35 The 95% CIs surrounding the weighted mean ES indicates whether the ES is statistically significant as well as the degree of precision. Heterogeneity in ESs was identified and quantified by computing Q and the I2 index. The Q statistic has a chi-square distribution with degrees of freedom equal to k − 1; a significant Q indicates a lack of homogeneity and an inference of heterogeneity. To assess the extent to which outcomes were consistent across studies, the I2 index and its corresponding 95% CIs were calculated.36,37 I2 values of 25%, 50%, and 75% can be considered low, medium, and high heterogeneity, respectively. 38 Data analyses were conducted in Stata 39 by using published macros.25,40
Risk of Bias across Studies
Asymmetries in the distributions of ESs, indicating a possible publication bias, 41 were examined by (1) inspecting funnel plots 42 and (2) using regression 43 and rank 44 tests assessing the degree of funnel plot asymmetry in the distribution of ESs. The trim-and-fill method 45 was used to estimate and correct for the possibility of missing studies (using a nonparametric approach based on funnel plot asymmetry) if publication bias was detected.43,44
Moderator Analyses
Meta-regression was conducted to assess the association between study-level moderators and ESs. For these random-effect regression models, the inverse variance for each ES included error associated with within-study level sampling error and additional between-study population variance. 46 Sample (proportion racial/ethnic minorities, socioeconomic status, proportion obese or overweight), study (recruitment site, implementation setting, intervention recipient, content focus, duration), and intervention (components as identified by our newly developed taxonomy 19 ) features were examined. Significant moderators were simultaneously entered in a multiple regression model, and they were adjusted for multiple testing by using random permutations. 46
Results
Study Selection
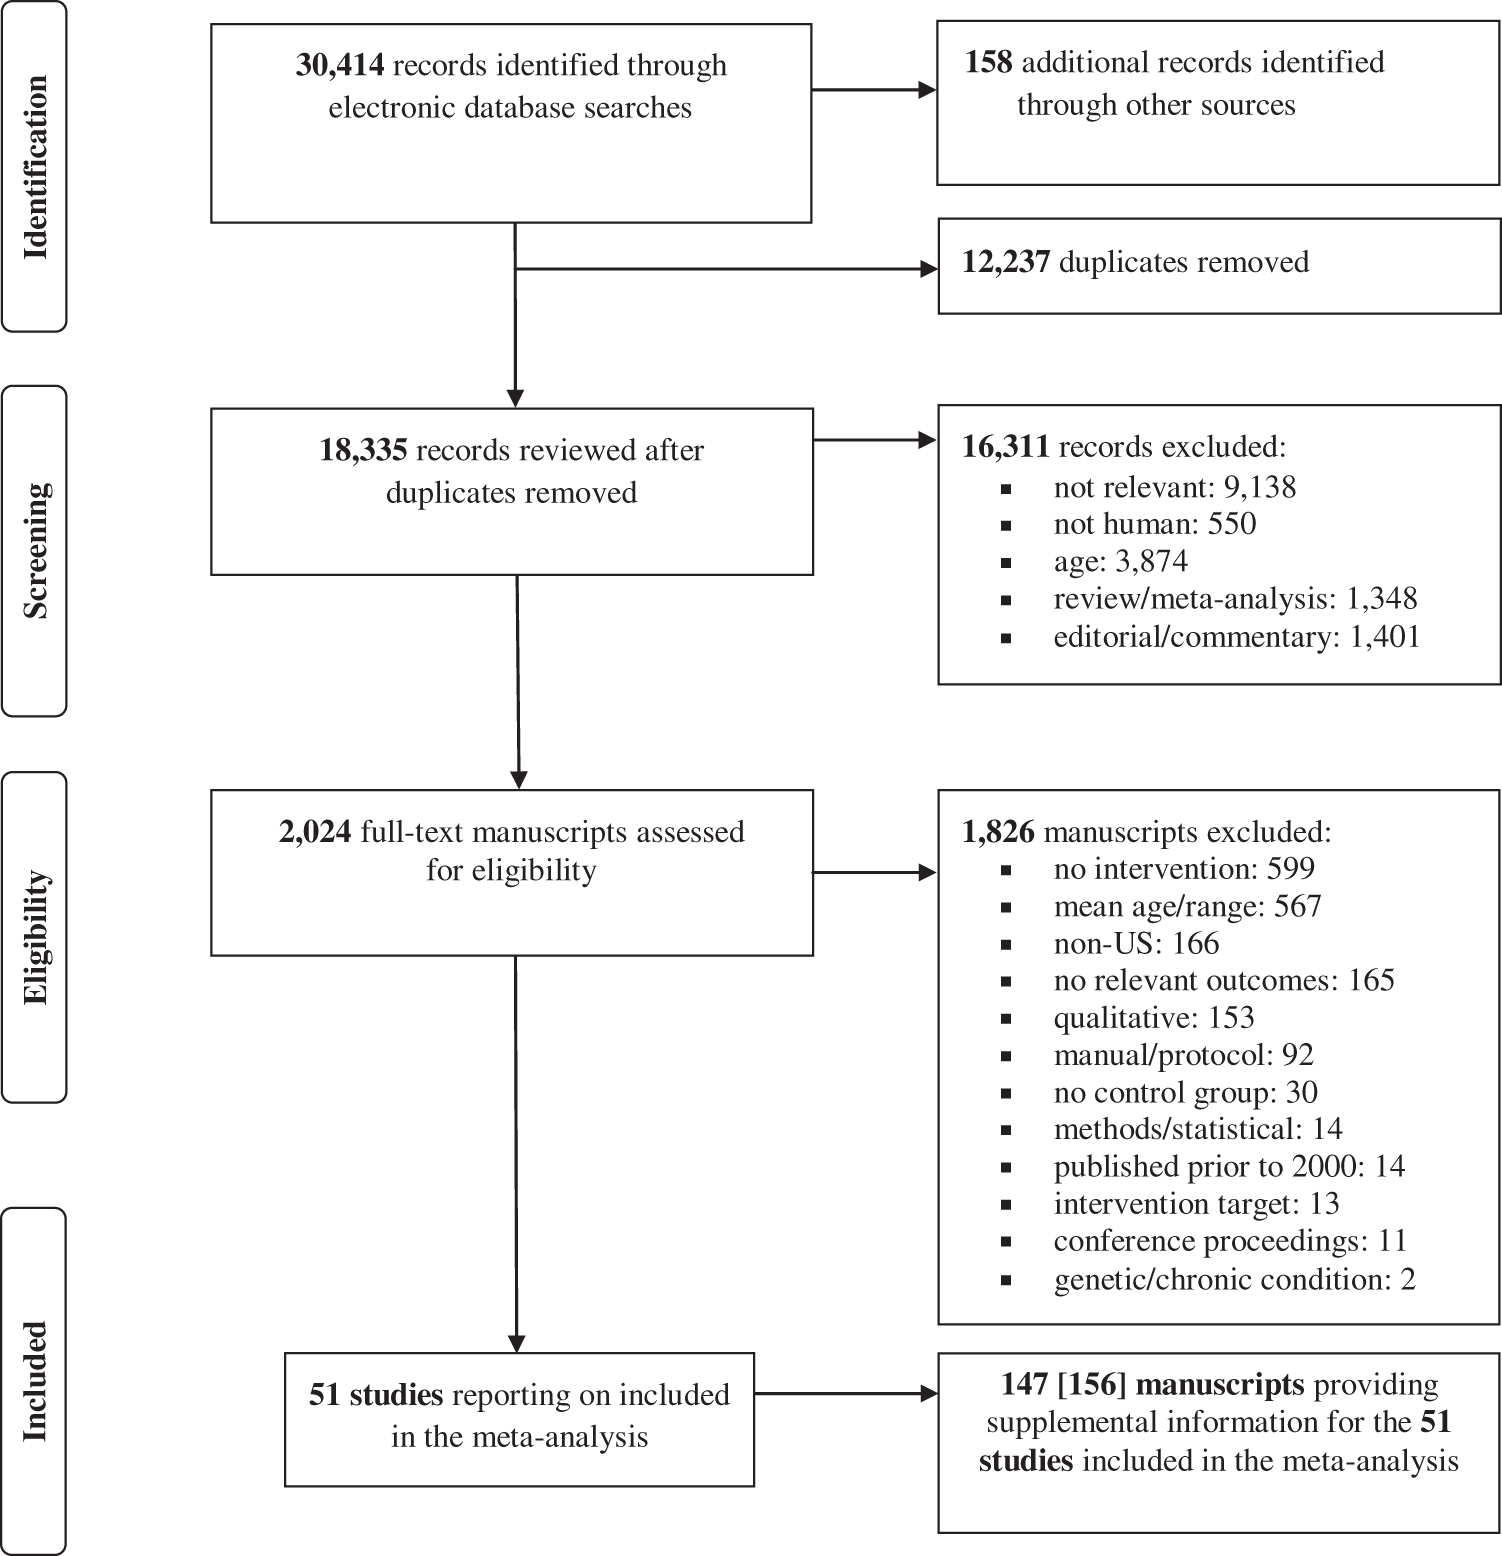
Comprehensive searches of electronic bibliographic databases located 51 unique studies from 18,177 records with relevant key terms (after removing duplicates). An additional 158 records were identified through other sources (i.e., reviews, reference lists, funded research, clinical trial records, consultation with experts). Of the 18,335 unique records reviewed, 16,311 records were excluded based on title and abstract review because those records did not meet inclusion criteria or were reviews, editorials, or commentaries. An additional 1826 records were excluded after full-text review, because the studies did not meet inclusion criteria (Fig. 1). Importantly, a primary reason for study exclusion was failure to measure (or report) the primary outcome for this meta-analysis, BMI. The final sample included 51 unique studies and 147 supplemental documents that provided additional study details or data for the included studies. Nine supplemental documents provided additional information for more than one primary study (e.g., Hip Hop to Health manual 47 ). Table 1 provides a description of the 51 included studies reporting on 58 interventions (7 studies evaluated 2 interventions48–54 ). Additional intervention details can be found in Supplementary Table S2.
Childhood Obesity Evidence Base Project Study, Sample, and Design Characteristics of the 51 Studies Included in the Systematic Review and Meta-Analysis
Race/ethnicity of the parent was available and used in six studies where race/ethnicity was not reported for the child.
CCHP, Child Care Health Program; F, female; HS, Head Start; Latinx, Latino or Latina; LAUNCH, Learning about Activity and Understanding Nutrition for Child Health; Low SES, low socioeconomic status [low SES of the sample was determined by using any information provided in the studies including income level at or below the poverty line and eligibility for any of the following programs: Supplemental Nutritional Assistance Program (SNAP), Woman, Infants, and Children (WIC), free/reduced lunch, and HS]; N (%), number of children who participated in the study (retention); RCT, randomized controlled trial.
Study and Sample Characteristics
Studies were published (or available) between 2005 and 2019 (mean publication date = 2015, SD = 4), and they were typically conducted in the U.S. Midwest (29%), Southeast (24%), or Northeast (18%). Most of the included studies (88%) used a randomized controlled trial design with random assignment of groups (49%) or individuals (39%); six studies used a quasi-experimental design.52,54–58 Study samples were recruited from child care centers or preschools (55%), clinical practices (22%), community sites/programs (14%), or multiple school, clinic, or community sites (10%). Participants included 29,085 children (mean age = 48 months, SD = 7), with an average retention rate of 80% (SD = 0.18) across the studies. The study samples included, on average, 50% (SD = 0.27; range = 20%–100%) of children meeting criteria for overweight or obesity. Details of the study and sample characteristics are provided in Table 2.
Childhood Obesity Evidence Base Project Study, Sample, and Intervention Characteristics of the 51 Studies (58 Interventions) Included in the Childhood Obesity Prevention Meta-Analysis
Facilitator refers to the individual(s) who delivers the intervention content (e.g., research assistant, teacher, physician) to the children, caregiver, or facilitator.
BA/MA, bachelor or master's degree; k, number of interventions; M, mean; matched, for time or contact; n, number of studies reporting on the specified characteristic; Para, paraprofessional; Prof, professional; SCT/SLT, Social Cognitive Theory/Social Learning Theory; SD, standard deviation; SEM, socioecological model.
Characteristics of Childhood Obesity Interventions
Interventions were typically theory driven (79%) and targeted both nutrition and physical activity (48%), nutrition only (14%), physical activity only (5%), or multiple/other obesogenic behaviors (33%; e.g., screen time, sleep, behavioral self-management). The content of the intervention was most often delivered to the child and caregiver (72%), caregiver alone (17%), or the child (10%). Dose varied by intervention target; that is, interventions were delivered to the child across a median of 21 sessions of <1 hour each (median = 53 minutes), to the parent across a median of nine 1-hour sessions (median = 60 minutes), and to the facilitator (e.g., teacher, physician) during a single 6-hour session (median = 360 minutes). The average duration of the intensive intervention phase was 9 months (SD = 7; range = 2–36 months). Active control or comparison conditions (43%) were used most often followed by no intervention (31%), waitlist (16%), or education only (10%).
Childhood Obesity Intervention Components Identified Using the Taxonomy
A total of 90 (out of 93) intervention components were identified across the interventions included in the current meta-analysis. Three intervention components included in the taxonomy were not identified: (1) provided materials to support self-control in children; (2) implemented Earned Income Tax Credit (i.e., adoption or expansion of Earned Income Tax Credits); and (3) implemented policies regarding food/beverage costs. (These intervention components, generated in the taxonomy development phase, were not identified in our meta-analysis because we limited the inclusion criteria to studies measuring BMI where a standardized mean difference between the intervention and control group could be calculated.) The mean number of components identified across the interventions was 20 (SD = 6, range = 7–34). The 5 most commonly reported components across the 58 interventions included were: (1) used research-based approaches or curriculum (84%); (2) provided written resources to caregivers (60%); (3) provided initial or one-time training opportunities for facilitators (59%); (4) provided education about nutrition and healthy eating patterns to caregivers (53%); and (5) provided curricular materials to facilitators (50%). (A list of the intervention components can be found in Table 3.)
Childhood Obesity Evidence Base Project Taxonomy of Components Identified, Frequency, and Impact on the Overall BMI across the 58 Interventions Included in the Analyses
The overall frequency is the proportion of interventions that included the specific component expressed as a percentage. Bold values indicates significant moderator of BMI at the immediate or final post-intervention assessment. Dashes indicate that meta-regression could not be performed due to insufficient cases or when the variable was dropped due to multicollinearity.
SE, standard error.
Synthesis of Results
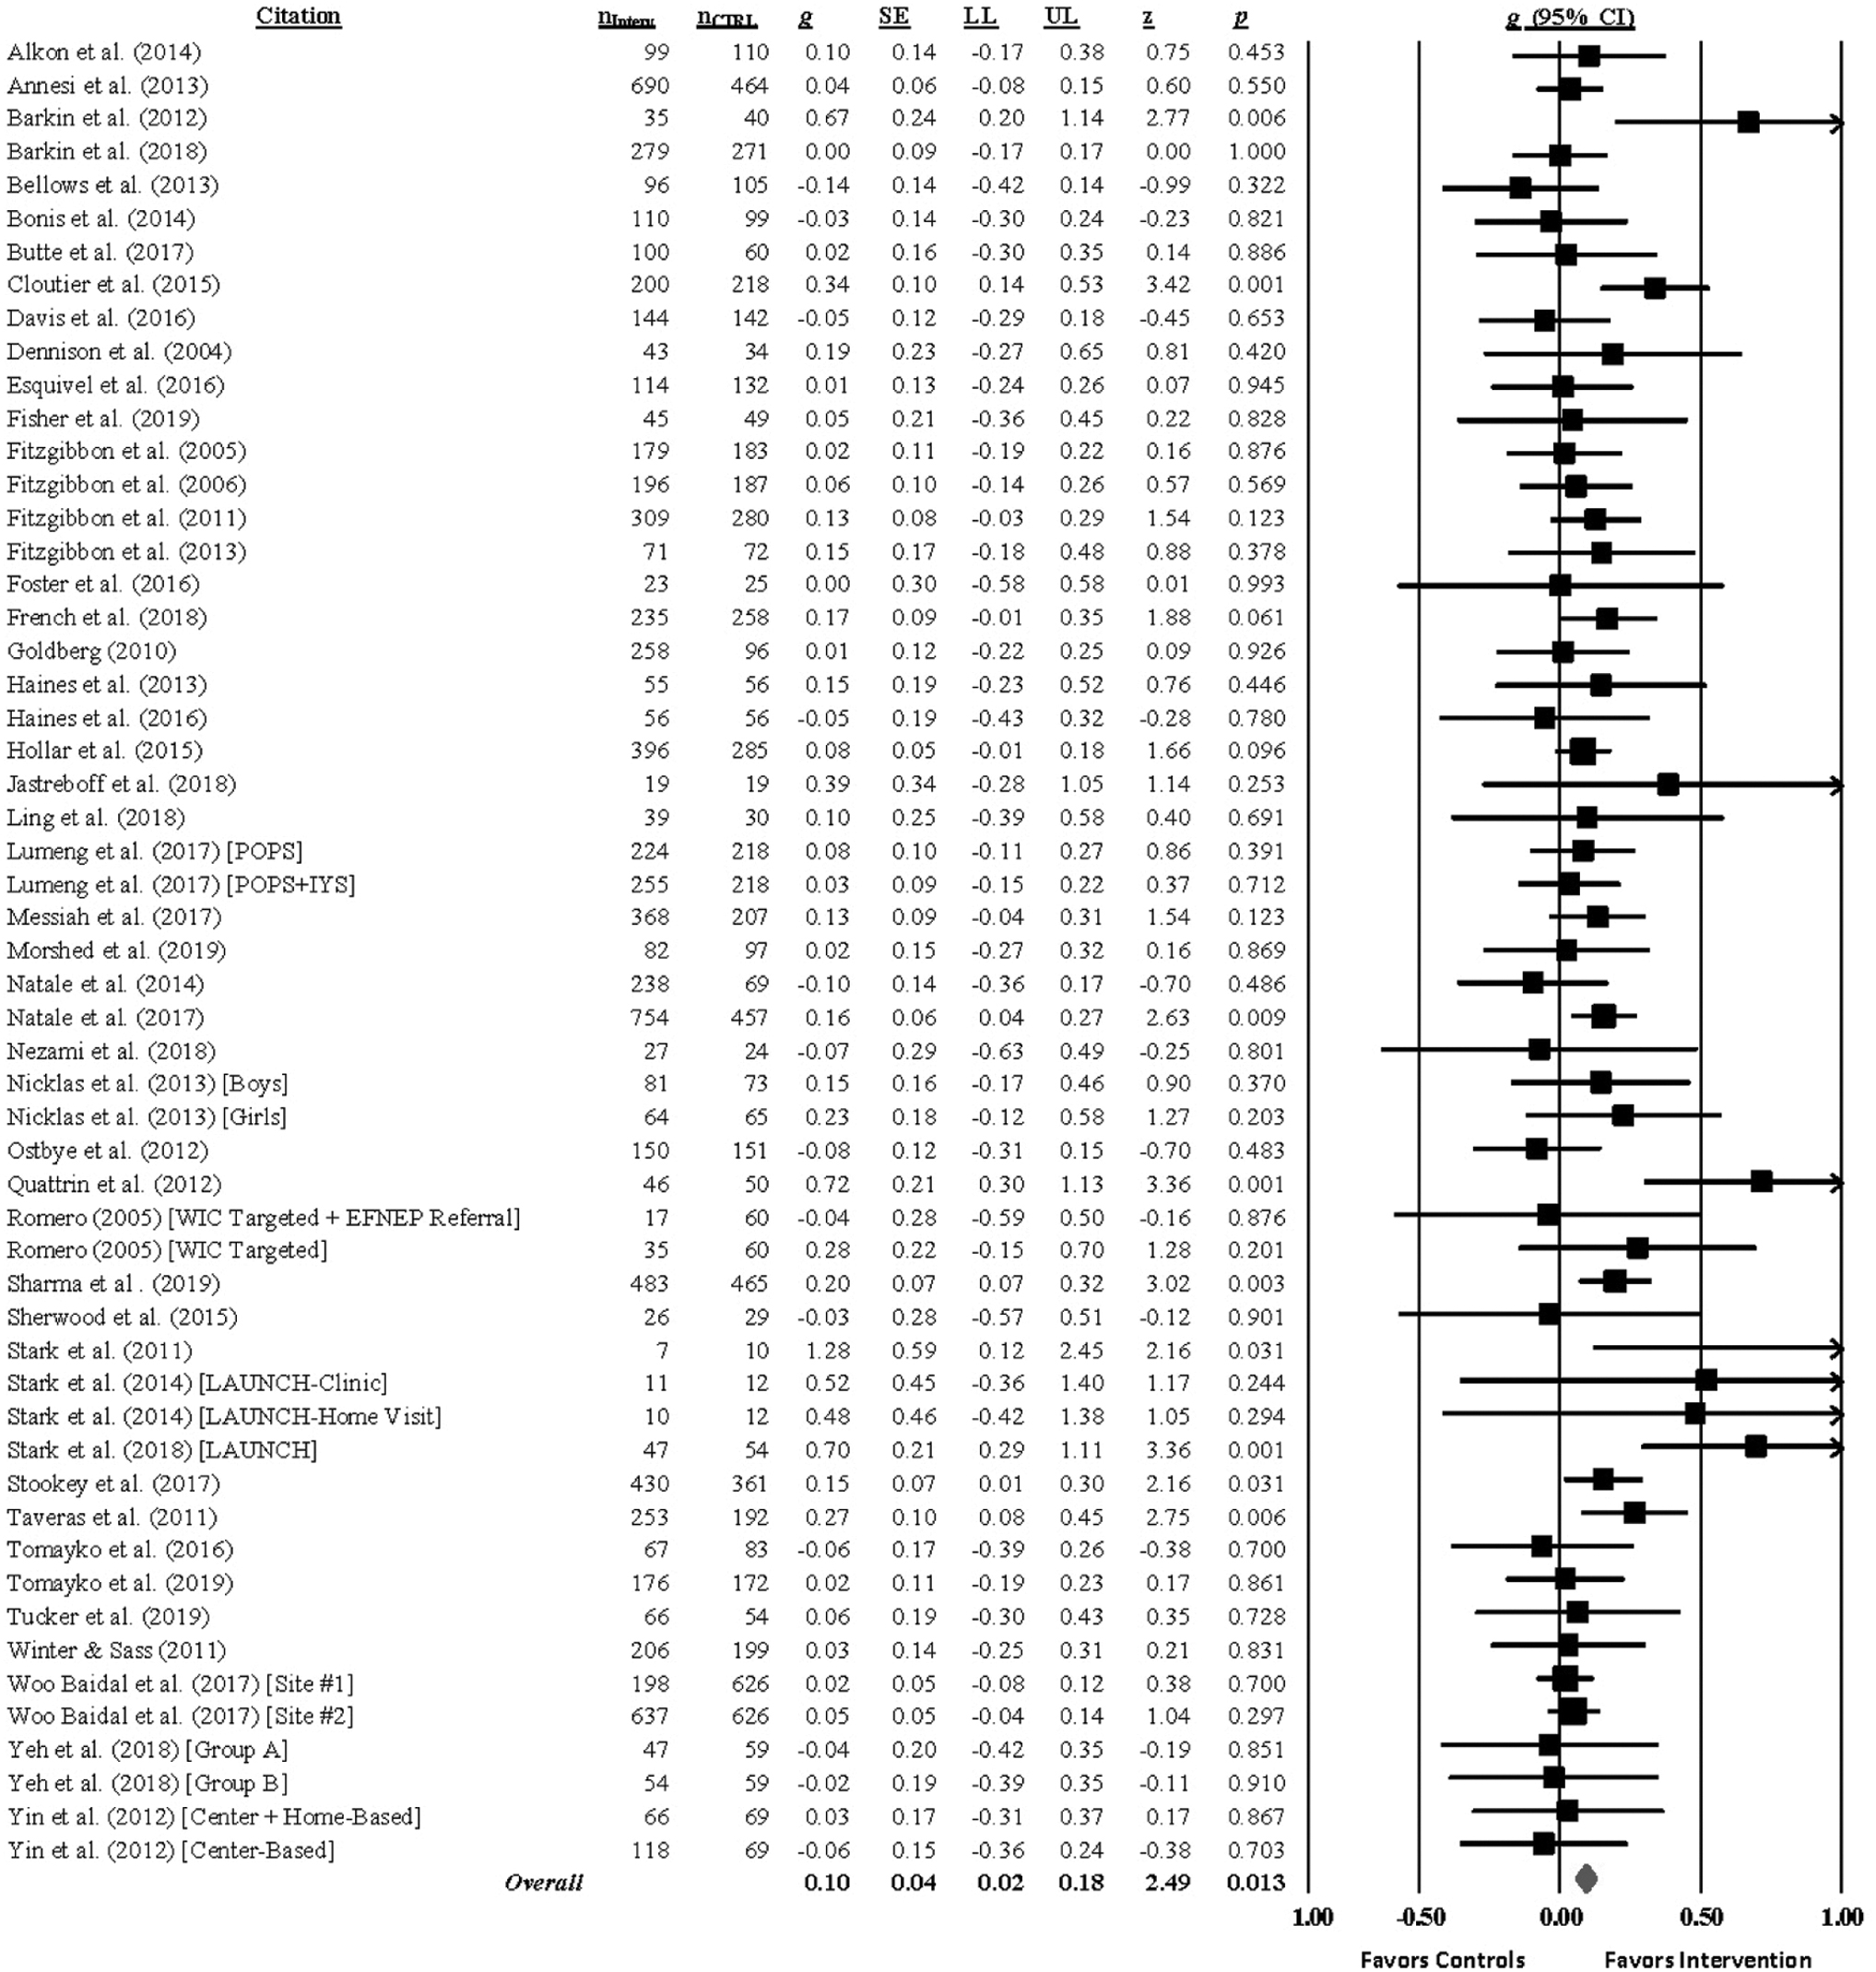
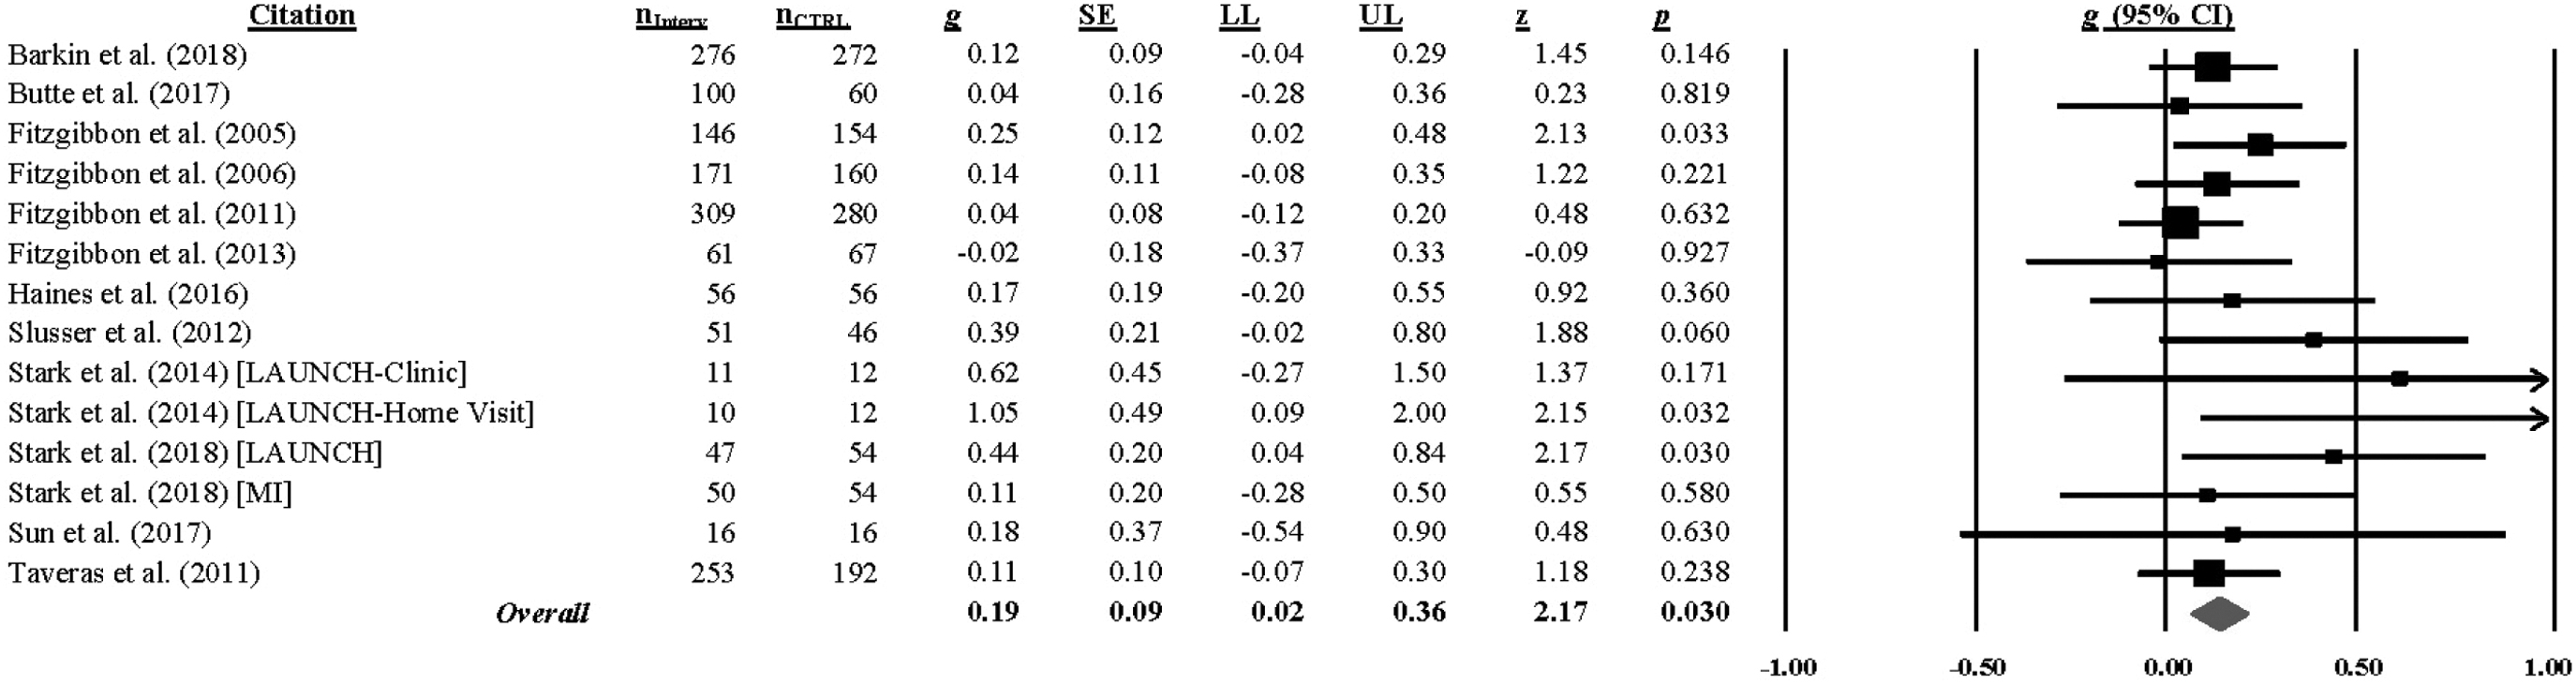
All studies assessed BMI at the end of treatment except for one study, 59 which did not include an immediate post-test; sixteen studies assessed BMI at a longer-follow-up (median = 52 weeks, range = 18–143 weeks). Hedge's g (and homogeneity statistics) for each BMI outcome by assessment interval is presented in Supplementary Table S3. Analyses indicated that children in the intervention group had a smaller BMI increase at the immediate post-test (g = 0.10, 95% CI = 0.02–0.18; k = 55; 0 weeks) and at the last follow-up (g = 0.17, 95% CI = 0.04–0.30; k = 14; range = 18–143 weeks) relative to the comparison group. * [Extreme outliers were detected at both the immediate post-test (2 out of 57 ES) and last follow-up (2 out of 16 ES) assessment and were removed from the analyses; see Supplementary Table S3.] The hypothesis of homogeneity was supported for BMI [immediate post-test: Q(54) = 67.08, p = 0.109; I2 = 20, 95% CI = 0–43; last follow-up: Q(13) = 11.91, p = 0.535; I2 = 0, 95% CI = 0–74], but uncertainty limits were wide at the last follow-up and exceeded the 50% threshold. (Forest plots of the overall BMI at the immediate post-test and last follow-up are found in Figs. 2 and 3.)
When pooling the separate BMI metrics, analyses showed that children in the intervention group had a lower BMI percentile at the immediate post-test (g = 0.15, 95% CI = 0.04–0.26; k = 19) and last follow-up (g = 0.59, 95% CI = 0.14–1.13; k = 6) and a lower BMI z-score at last follow-up (g = 0.20, 95% CI = 0.06–0.34; k = 12) relative to the comparison group. Intervention children also had a lower weight at the immediate post-test (g = 0.35, 95% CI = 0.16–0.55; k = 16) and last follow-up (g = 0.26, 95% CI = 0.05–0.48; k = 11) assessment compared with the comparison group. The hypothesis of homogeneity was not supported for weight [immediate post-test: Q(15) = 109.93, p < 0.001; I2 = 86, 95% CI = 79–90; last follow-up: Q(11) = 45.06, p < 0.001; I2 = 78, 95% CI = 61–88], and uncertainty limits exceeded the 75% threshold.
Synthesis of Moderator Analyses
Meta-regression (using restricted maximum likelihood to estimate the between-study variance) was conducted to examine proposed moderators of BMI (see Moderator Analyses). Interventions that sampled fewer children of low socioeconomic status (β = −0.20, p = 0.002), sampled more children meeting criteria for overweight or obesity (β = 0.23, p = 0.009), recruited samples from clinical practices (β = 0.20, p < 0.001; e.g., pediatrician offices, primary care), and implemented the intervention in a clinical practice (β = 0.24, p < 0.001) were more likely to reduce children's BMI at the immediate post-test.
We also examined whether components of the intervention impacted BMI. Overall, children had a lower BMI at the immediate follow-up when the intervention delivered more, rather than fewer, activities supporting behavior change, β = 0.03, p = 0.024 (total components, see Table 3). Interventions that: (1) engaged caregivers in praise/encouragement for positive health-related behavior (β = 0.09, p = 0.049); (2) provided education about the importance of screen time reduction to caregivers (β = 0.13, p = 0.002); and (3) engaged pediatricians/health care providers in delivering intervention content (β = 0.11, p = 0.012) were more successful than interventions that did not include these components in reducing BMI in children at the immediate post-test.
When the intervention components were simultaneously entered in a multiple meta-regression model, only providing education about the importance of screen time reduction to caregivers emerged as a significant moderator of BMI at the end of the intervention. The model was significant [F (3, 51) = 4.33, p = 0.009, I2 residual = 5%] and accounted for 89% of the variance in the change in BMI. Adjusting for multiple testing using the permutation test (5000 permutations) confirmed that interventions providing education about the importance of screen time reduction to caregivers differ on average from interventions that did not include this component (adjusted p-value = 0.048). † None of the hypothesized sample or intervention features (see Moderator Analyses) were associated with BMI at the final assessment (Supplementary Table S4).
Risk of Bias within Studies
The overall risk of bias judgments revealed that most studies were at low risk of bias (40%) or provided insufficient details to determine the quality of the study (35%). Most studies were judged to be at low risk for selection (53%), attrition (49%), or other sources (61%) of bias. The studies were typically judged to be at high risk for bias due to inadequate allocation concealment (51%), performance bias (59%), or detection bias (39%) because concealing the allocation and blinding of participants or personnel was not possible for many of the studies. Reporting biases (i.e., selective reporting) were typically judged as low (43%) or unclear (43%) risk of bias. The risk of bias score was not associated with the overall BMI at the immediate (p = 0.943) or final (ps = 0.343) assessment (data not shown). The overall judgment and ratings for the seven sources of bias can be found in Supplementary Figure S1.
Risk of Bias across Studies
Funnel plots and results of the statistical tests to assess for the possibility of publication bias appear in the online appendix supporting this article, available in the Supplementary Data S2. The graphical and statistical tests revealed asymmetries that might be interpreted as small-study effects for BMI at the last follow-up assessment. Trim-and-fill procedures were used to estimate the number of potentially “missing” studies and the pooled ES (using random-effects procedures) if the presumed to be “missing” studies were included. These tests indicated that three studies may have been omitted. The pooled ES estimate was consistent with the original pooled ES for overall BMI, suggesting that including the “missing” studies would not change the overall conclusion (g = 0.17, 95% CI = 0.04–0.30 and estimated g = 0.13, 95% CI = 0.04–0.23).
Discussion
The current systematic review and meta-analysis shows that interventions to improve weight status in preschool-aged children are effective in reducing BMI. The overall magnitudes of the ESs are small (g = 0.10 at the end of treatment and g = 0.17 at the last follow-up) but suggest that 54% and 58% of the children exposed to an intervention had a lower BMI relative to the average for children in the control or comparison group at the immediate and final assessments, respectively. The magnitudes of ESs were likely impacted by our ES adjustments for baseline BMI values in consideration of regression to the mean (i.e., a statistical phenomenon that arises if extreme values observed in a group at baseline are closer to the mean at follow-up). Our findings, however, may be limited to certain settings or populations (e.g., clinical settings, children of low socioeconomic status) and future meta-analyses should continue to examine which settings or populations benefit most from these interventions as the scientific literature grows. Nevertheless, our findings indicate that children aged 2–5 years who participate in an obesity intervention gain less BMI over time than children in the control or comparison groups. It is important to note that this outcome is not a prevalence reduction, but it indicates a slowing of obesity in the intervention relative to the comparison condition as measured by lower weight status. The limited heterogeneity observed for overall BMI provides strong clinical evidence supporting the use of obesity prevention interventions for children 2–5 years of age living in the United States.
This meta-analysis represents the first use of a taxonomy approach to identify components used in early childhood obesity interventions. Taxonomic meta-analysis allows for the discovery of components or patterns of components that are critical for behavioral change approaches, 60 which were included as moderators in this analysis. Four prior systematic reviews in the area of childhood obesity prevention have used a taxonomical approach to identify intervention components but these reviews focused on infant feeding interventions, 61 parent-involved childhood weight control interventions for children 0–12 years of age, 62 or prevention and management of childhood obesity in children and adolescents aged 1–18 years 63 or 2–18 years. 64 These systematic reviews were limited in scope, reviewing fewer than 24 studies each, and used a pre-existing taxonomy of behavioral change techniques that was not developed specifically to identify intervention components in the area of childhood obesity.65,66
The current systematic review and meta-analysis extended prior research by focusing on any childhood obesity intervention targeted toward children aged 2–5 years, used the grounded theory16,17 within the SEM framework to identify the specific components of the intervention, 19 and used meta-regression to identify whether intervention components impacted the efficacy of the findings. The development, refinement, and application of the taxonomy was a collaboration of a multidisciplinary team of experts, and they represent a significant step toward identifying the “active ingredients” of childhood obesity interventions, but ongoing applications will be necessary to optimize reliability, comprehensiveness, and implementation of the taxonomy especially as new studies emerge. Nevertheless, it is noteworthy that the findings from the taxonomic analysis performed in COEB support other taxonomic analyses based on behavior change components expected to affect weight outcomes.65,66
Taxonomic meta-regression analyses identified three components that improved the success of the intervention in lowering children's BMI at the end of treatment: Engage caregivers in praise or encouragement for positive health-related behavior (e.g., positive affirmation or encouragement to child from caregivers), provide education about the importance of screen time reduction to caregivers, and engage pediatrician or health care providers in delivering all or part of the intervention content. However, when the intervention components were simultaneously entered in a regression model, providing education about the importance of screen time reduction to caregivers was the only significant moderator of BMI change. This model accounted for 89% of the variance in the change of BMI, suggesting the validity of the taxonomy of intervention components.
Exploratory subgroup analyses revealed a small but significant effect in reducing BMI in interventions in which a screen time component was present (g = 0.23, 95% CI = 0.10–0.36) versus absent (g = 0.05, 95% CI = −0.02 to 0.12) relative to the control or comparison group [QB (1) = 11.24, p = <0.001]. This is an important finding given that screen time habits in children younger than the age of three are associated with increased screen use at 8 years of age, 67 and the robustness of research showing that screen time exposure is associated with an increased risk of obesity. 68 This also highlights the critical role of parents in reducing childhood obesity, 69 and the need to identify specific strategies and provide skills-training to support parents of preschoolers who often find it challenging to limit screen time exposure 70 These findings are consistent with the Community Preventive Services Task Force, which found strong evidence supporting the efficacy of interventions addressing screen time reduction to promote healthy weight in children aged 13 and younger. 71 Promoting screen time reduction could have the additional benefit of improving children's physical activity, diet, and sleep behaviors. 72 Further, as young children five must receive required vaccinations to attend public school, 73 engaging health care teams (e.g., physician, nurse, medical assistant) in delivery of obesity prevention initiatives seems both feasible and pragmatic given that half (53%) of the studies that promoted screen time reduction recruited children from clinical settings. The moderators highlighting the importance of the clinical setting (recruitment and implementation) may have explained additional between-study variance but were not included in the final multiple meta-regression model due to multicollinearity and overfitting of the model.
The success of childhood obesity prevention interventions to improve weight status was also associated with the characteristics of the samples. First, consistent with our hypothesis, childhood obesity interventions sampling a greater proportion of children meeting criteria for overweight or obesity were more successful in improving weight status. Other reviews corroborate our findings showing that multicomponent obesity interventions can reduce weight status in overweight or obese preschoolers, but this moderator was no longer significant when screen time reduction was included in our exploratory models, suggesting that interventions providing education regarding screen time reduction to caregivers are beneficial for normal weight, overweight, and obese children. This finding is also consistent with the Community Preventive Services Task Force, which showed that interventions to reduce recreational sedentary screen time were effective regardless of weight status.71,72
Second, as hypothesized, childhood obesity interventions sampling children of lower socioeconomic status were less successful in reducing BMI. This is an important and concerning finding given that low socioeconomic status is a critical risk factor for childhood obesity, and early prevention efforts are critical to prevent obesity in children of lower socioeconomic status. Exploratory multiple meta-regression analyses, however, showed weakened evidence that low socioeconomic status is associated with intervention efficacy when adjusting for multiple moderators. These finding suggest that traditional prevention strategies such as reducing screen time may also require content to address upstream (e.g., reducing poverty, increasing access to education) and midstream (e.g., reducing poverty-related stress) risk factors to reduce socioeconomic disparities in obesity, 20 and we encourage researchers to conduct future studies evaluating novel intervention strategies to address socioeconomic adversity.
Finally, other hypothesized characteristics of the interventions (implementation in a school-based setting, targeting nutrition and physical activity, and involving caregivers) did not emerge as significant moderators of the intervention efficacy. Some reviews have found moderately strong evidence supporting the efficacy of interventions implemented in a school-based setting, diet combined with physical activity interventions, or those involving caregivers, but these have largely been found in meta-analyses sampling of children from a wider age range (e.g., 2–18 years of age), multiple geographic locations, or limited to specific intervention settings (e.g., schools).2–12,74 Such distinctions highlight the utility of a taxonomic meta-analytic approach to more precisely identify the intended recipients, context, and channels of delivery to improve the effectiveness of early childhood obesity interventions.
Limitations
Several limitations should be considered when interpreting the findings from this meta-analysis. First, as with any meta-analysis, identifying relevant studies is limited to the reports included in the electronic bibliographic database, our primary source for retrieving relevant reports. To reduce the possibility of omitting potentially relevant research, we conducted a comprehensive search of multiple bibliographic databases, cross-checked our findings with registries of federal grant funding and clinical trials, and consulted with experts in the field. It remains unclear, however, whether only the most rigorous interventions contributed most of the data, or whether all available data from community-based obesity prevention efforts in this age range were captured by using our search methods.
Second, we intended to include all studies evaluating an intervention to prevent or reduce childhood obesity in this age group but limitations in study design (e.g., no control or comparison condition), sample (e.g., children with a mean age <2 or >5 years of age), or outcomes (i.e., no objective measure of BMI reported) impacted the number of reports available for inclusion. Also, by insisting that BMI be an inclusion criterion, it may be that the sample of studies was not representative of the many community-based intervention programs that focus on policy, system, and environmental changes to influence healthy behavior change. Third, we included studies that provided transformations of BMI (i.e., BMI z-score, BMI percentile) that are known to be weakly associated with other measures of body fat in children with severe obesity and may have obscured changes in BMI in samples with a greater proportion of children in the 95th percentile or greater. 75
Finally, our moderator tests were limited to the intervention descriptions provided in the studies and supplemental reports. Intervention content is often not described in full detail due to space limitations in journals, and intervention fidelity was only addressed in one-third of the included studies. Further, the length of exposure to specific intervention components is typically not provided. Therefore, we may have been limited to find effects for some of the intervention components or strategies because those components were not well represented in the interventions or reported fully in the database of included studies (i.e., insufficient statistical power and restriction of range). Methods described in implementation science evaluation schemas can provide guidance for accomplishing this goal. 76 Replication of this meta-analytic approach by using another age range or targeted outcomes (e.g., improving healthy eating; increasing physical activity; reducing screen time across age groups) will be necessary to demonstrate the robustness of using this taxonomic approach.
Conclusion
This is the first meta-analysis to use a taxonomic approach to identify components used in early childhood obesity interventions. Findings show that early childhood obesity interventions efforts may be successful in reducing the rate of increase in BMI over time, and that these changes may persist for up to 3 years after the intervention. Specific intervention components emerged as promising strategies: Training caregivers in healthy behavior change strategies (i.e., reducing screen time), engaging health care providers directly in the delivery of obesity prevention efforts, and using health care settings were effective. Importantly, educating caregivers about the importance of screen time reduction appears to be the most promising intervention component identified in the current meta-analysis, but future research is needed to determine the benefits of delivering this component for all populations (e.g., children of lower socioeconomic status). In sum, we found that using a taxonomic meta-analytic approach does elucidate promising intervention components and strategies that may accelerate efforts to reduce rates of childhood obesity. The taxonomic approach to meta-analysis of study effects allows evaluation of these questions and adds to the information provided by traditional meta-analysis.
Footnotes
Acknowledgments
This work is a collaborative effort between Mission Measurement and the National Collaborative on Childhood Obesity Research (NCCOR). It was funded by Office of Behavioral and Social Science Research, National Institutes of Health, and guided by members of NCCOR. The four organizations represented in NCCOR are: The Centers for Disease Control and Prevention (CDC); National Institutes of Health (NIH); Robert Wood Johnson Foundation (RWJF); and the United States Department of Agriculture (USDA). Members of the NCCOR Childhood Obesity Evidence Base (COEB) project Working Group include Sonia Arteaga, Christine Hunter, Young Jo, Laura Kettel Khan, and Deborah Young-Hyman. Members of the COEB External Expert Panel (EEP) include Leann Birch, John Cawley, Jamie Chriqui, Angie Cradock, Christina Economos, Debra Haire-Joshu, Shiriki Kumanyika, Bruce Lee, Lorrene Ritchie, Thomas Robinson, and Marlene Schwartz. We are grateful to the Systematic Review and Meta-Analysis Research Methods Team, especially Melissa M. Feulner, Brittany L. Balletto, and Julie DeCosta for their efforts on this project. This Childhood Obesity Supplement is dedicated to Dr. Leann L. Birch, who passed May 26, 2019, for a life's work devoted to childhood nutrition and health.
Funding Information
The research reported in this article was supported by the Office of Behavioral and Social Sciences Research of the NIH under contract number GS-00F-0007M. The findings and conclusions in this article are those of the authors and do not necessarily represent the official position of the NIH or the Centers for Disease Control and Prevention.
Author Disclosure Statement
No competing financial interests exist.
References
Supplementary Material
Please find the following supplemental material available below.
For Open Access articles published under a Creative Commons License, all supplemental material carries the same license as the article it is associated with.
For non-Open Access articles published, all supplemental material carries a non-exclusive license, and permission requests for re-use of supplemental material or any part of supplemental material shall be sent directly to the copyright owner as specified in the copyright notice associated with the article.