
Abstract
Background:
To examine the association between body size perception (BSP) and body size dissatisfaction (BSD) in elementary school children and to document the potential contribution of individual factors [age, sex, and actual body size (BMI Z-scores: BMIZ)] that may influence their relationship.
Methods:
This study included 269 children (124 boys and 145 girls) between 6 and 13 years of age (9.2 ± 1.6 years). The BSP score was calculated as the difference between the perceived actual body size and BMIZ (actual body size). A negative BSP score indicated an underestimation of their body size. To assess the BSD score, the difference between perceived actual body size and desired body size was calculated. A positive BSD score indicated a desire to be thinner.
Results:
Perceived actual body size was smaller than BMIZ, independent of age group and weight status. Overall, 64% of children underestimated their body size. The young children living with obesity demonstrated the highest misperception. Results also showed that the proportion of children who desired to be thinner was higher in overweight and obese subgroups. No significant relationship was found between BSP and BSD scores in the entire sample, while a positive association was observed among younger children in the normal-weight and obese subgroups (r = 0.40; p < 0.001 and r = 0.78; p < 0.05, respectively).
Conclusions:
Underestimation and dissatisfaction of body size are more prevalent in children living with overweight/obesity. Moreover, there is an association between BSP and dissatisfaction, yet this association is dependent on age and weight status.
Introduction
Childhood obesity is an important issue in most countries. There is an urgent need to better understand the early determinants of this multifactorial problem. Evidence indicates that body image represents a critical determinant of obesity in children as it can influence lifestyle behaviors.1,2 Two perspectives related to body image have been highlighted: body size perception (BSP) and body size dissatisfaction (BSD).
BSP refers to how individuals perceive their actual body size. It has been shown that actual body size, evaluated using BMI Z-scores (BMIZ), and perceived actual body size often do not coincide, and this nonconcordance between actual and perceived actual body size is more common among heavier 3 and younger children. 4 Previous research has shown that 43% to 90% of children living with overweight/obesity underestimate their body size compared to 27% to 45% of children with normal weight.5–8 Furthermore, a sex-by-weight interaction has been reported showing that for children with a normal weight, girls underestimate or overestimate their weight less than boys, whereas for children living with obesity, girls underestimate more than boys. 6
Body size dissastisfaction is defined as the negative subjective evaluation of one's body weight and size in relationship to a desired body size.9–11 According to a study conducted among 9- to 14-year-old Canadian children, 51% of girls and 36% of boys showed a desire to have a thinner body size. 12 The results also indicated that most of the children living with overweight or obesity reported being dissatisfied with their body size. 12 It has been reported in the literature that children who have higher BSD will be more likely to adopt unhealthy weight control practices and behaviors such as restrictive eating or overexercising.13–16 Moreover, BSD is often more prevalent among older children. 17
These results suggest that BSP and BSD influence lifestyle behaviors in children and that body weight status, sex, and age appear to modulate this effect. However, it is unknown if BSP and BSD are associated. To our knowledge, very few studies have investigated these two components together in children. Leppers et al., who partially addressed this question in children differing in their bodyweight status, reported that the majority (83%) of children (9–10 years of age) living with overweight or obesity underestimated their body size. 7 Among those who underestimate their body size, 79% had the desire to be thinner, while all children living with overweight/obesity, who accurately recognized their body weight status, had the desire to be thinner. 7 Thus, these results suggest that an accurate perception of body size does not appear to protect against BSD. In addition, the effect of age and sex was not addressed in this study.
Considering that BSP and BSD are prevalent in children and that they can also be related to lifestyle behaviors, it is important to better understand the possible interactions between those two parameters. In this context, the main objective of this study was to examine the association between BSP and BSD in elementary school children and second, to document the potential contribution of individual factors [age, sex, and actual body size (BMIZ)] that may influence their relationship. We hypothesized that there is a relationship between BSP and BSD and that this association may be modulated by individual factors such as age, sex, and body weight status.
Methods
Participants
Ethics approval was obtained from the local Institutional Review Board. An agreement with school boards and summer day camp coordinators was also obtained. The study sample included 124 boys and 145 girls between 6 and 13 years of age (mean age ± SD = 9.2 ± 1.6 years), who were recruited from schools, summer day camps, and one specialized medical clinic from the Québec City's metropolitan area between 2005 and 2012. Parents and children provided their written informed consent and assent, respectively.
Anthropometric Evaluation
Children's height and weight were measured by trained professionals according to standardized methods. 18 Measurements were performed privately for each student during a dedicated physical education class, a special activity during summer day camps, or a clinical appointment at the clinic. BMIZ scores were calculated using statistical procedures by the 2007 World Health Organization and express the number of standard deviations for BMI distributed according to the average BMI of children of the same sex and age. Scores were used to classify the weight status of children as underweight (BMIZ < −2), normal weight (1 > BMIZ ≥ −2), overweight (2 > BMIZ ≥ 1), or obese (BMIZ ≥ 2). 19 The sex of the child was obtained through a registration list completed by parents or legal guardians.
Measurements of Perceived Actual Body Size and Desired Body Size
Body silhouette charts, validated scales designed by Collins, 20 were used to collect data on perceived and desired body size. The scale consists of seven male or female child figures ranging from very thin to obese. The figures are not directly matched with BMI, but are highly correlated with BMI percentiles. 21 According to a method described by Maximova et al., the seven figures are assigned to corresponding Z-scores (−3, −2, −1, 0, 1, 2, and 3). 22 The figure representing an average-weight child was numbered as 0 and associated with a BMIZ of 0. The three figures numbered as −1, 0, and 1 were considered to represent “normal” body weight, following the WHO reference charts. 19 By considering the same-sex figures as themselves, children were asked which figure best represented how they currently looked (perceived actual body size) and how they wanted to look (desired body size).
BSP and BSD Scores
BSP and BSD scores were calculated to differentiate children according to the direction and the magnitude of their body size misperception or dissatisfaction. BSP score was calculated as the difference between the perceived actual body size and the BMIZ 22 where BSD score was the difference between perceived actual body size and desired body size.23,24
Statistical Analyses
The relationship between BSP and BSD was examined from a convenience sample of 269 children. Based on a thorough literature search, no preliminary data were available to allow a sample size calculation to be performed. Children were classified according to their weight status using the WHO reference charts for BMIZ [underweight (BMIZ < −2), normal weight (1 > BMIZ ≥ −2), overweight (2 > BMIZ ≥ 1), or obese (BMIZ ≥ 2)]. Characteristic variables by weight status were analyzed using a one-way analysis of variance (ANOVA). A linear regression analysis was used to examine the effects of age, sex, and BMIZ on perceived actual body size, desired body size, and BSP and BSD scores.
An intraclass correlation (ICC) coefficient was used to calculate a coefficient of concordance between BMIZ and perceived body size. 25 An ICC >0.75 signifies excellent agreement, 0.60 to 0.75 is good agreement, 0.40 to 0.59 is fair agreement, and <0.40 is poor agreement. 26 Chi-squared (χ 2 ) tests were used to examine differences in the prevalence of children in each categorical variable for BSP (accuracy, underestimation, and overestimation) and BSD (satisfaction, desire to be thinner, and desire to be heavier). To determine accuracy (BSP = 0), BSP was rounded to the nearest unit. Thus, BSP values of 0.5 and over were classified as overestimator and values of −0.5 and less were classified as underestimator. The same approach was used to determine satisfaction (BSD = 0). Values of 0.5 and over were classified as desire to be thinner and values of −0.5 and less were classified as desire to be heavier.
To demonstrate the effect of age (obtained with regression analysis) on the dependant variables (BSP and BSD scores), children were identified as younger and older using the reference age for the beginning of puberty in girls and boys (<8.5 and <9.5 years, respectively).27,28 Post hoc contrast analyses were performed to identify differences between corresponding subgroups using Tukey's multiple comparisons. Pearson's correlations were performed to explore the associations between BSP and BSD scores. Statistical significance was considered at p < 0.05. All analyses were conducted using online SAS OnDemand for Academics (Cary, NC).
Results
Participant's Characteristics
The children's BMI varied between 13.4 and 39.2 kg/m2. This represented a variation from −2.2 to 3.3 when BMI was expressed as a Z-score. For the total sample, 18% (n = 49) of children were classified as overweight (55% of boys and 45% of girls) and 9% (n = 24) as living with obesity (46% of boys and 54% of girls) according to the WHO reference charts. 19 One child was classified as underweight (BMIZ = −2.2) and was included in the normal-weight group without any impact on the results. Results show that mean perceived actual body size values were smaller than the BMIZ in all subgroups (Table 1). This is in line with the coefficient of concordance of 0.32 obtained between actual body size (BMIZ) and perceived actual body size, which represents poor concordance.
Characteristics of Participants According to Subgroups of Weight Status
Data are presented as mean ± SD (min, max). ANOVA analyses were performed between subgroups.
Indicates significantly different from normal-weight subgroup, p < 0.001.
Indicates significantly different from overweight subgroup, p < 0.001.
Indicates significantly different from overweight subgroup, p < 0.05.
ANOVA, analysis of variance; BMIZ, BMI Z-scores.
Table 2 presents the results of linear regression analyses conducted to predict perceived actual body size, desired body size, and BSP and BSD scores by considering age, sex, and BMIZ. Regarding perceived actual body size and BSP score, results revealed an effect of age and BMIZ (p < 0.001 and p < 0.001, respectively), whereas only age had an effect on desired body size (p < 0.05). With respect to BSD scores, the linear regression analyses showed a significant contribution of BMIZ and sex.
Contribution of Age, Sex, and BMIZ on Perceived Actual Body Size, Desired Body Size, Body Size Perception Score, and Body Size Dissatisfaction Score
<0.05.
<0.001.
BMIZ, BMIZ-scores; CI, confidence intervals; —, variable not retained in the model with the lowest AIC.
Body Size Perception
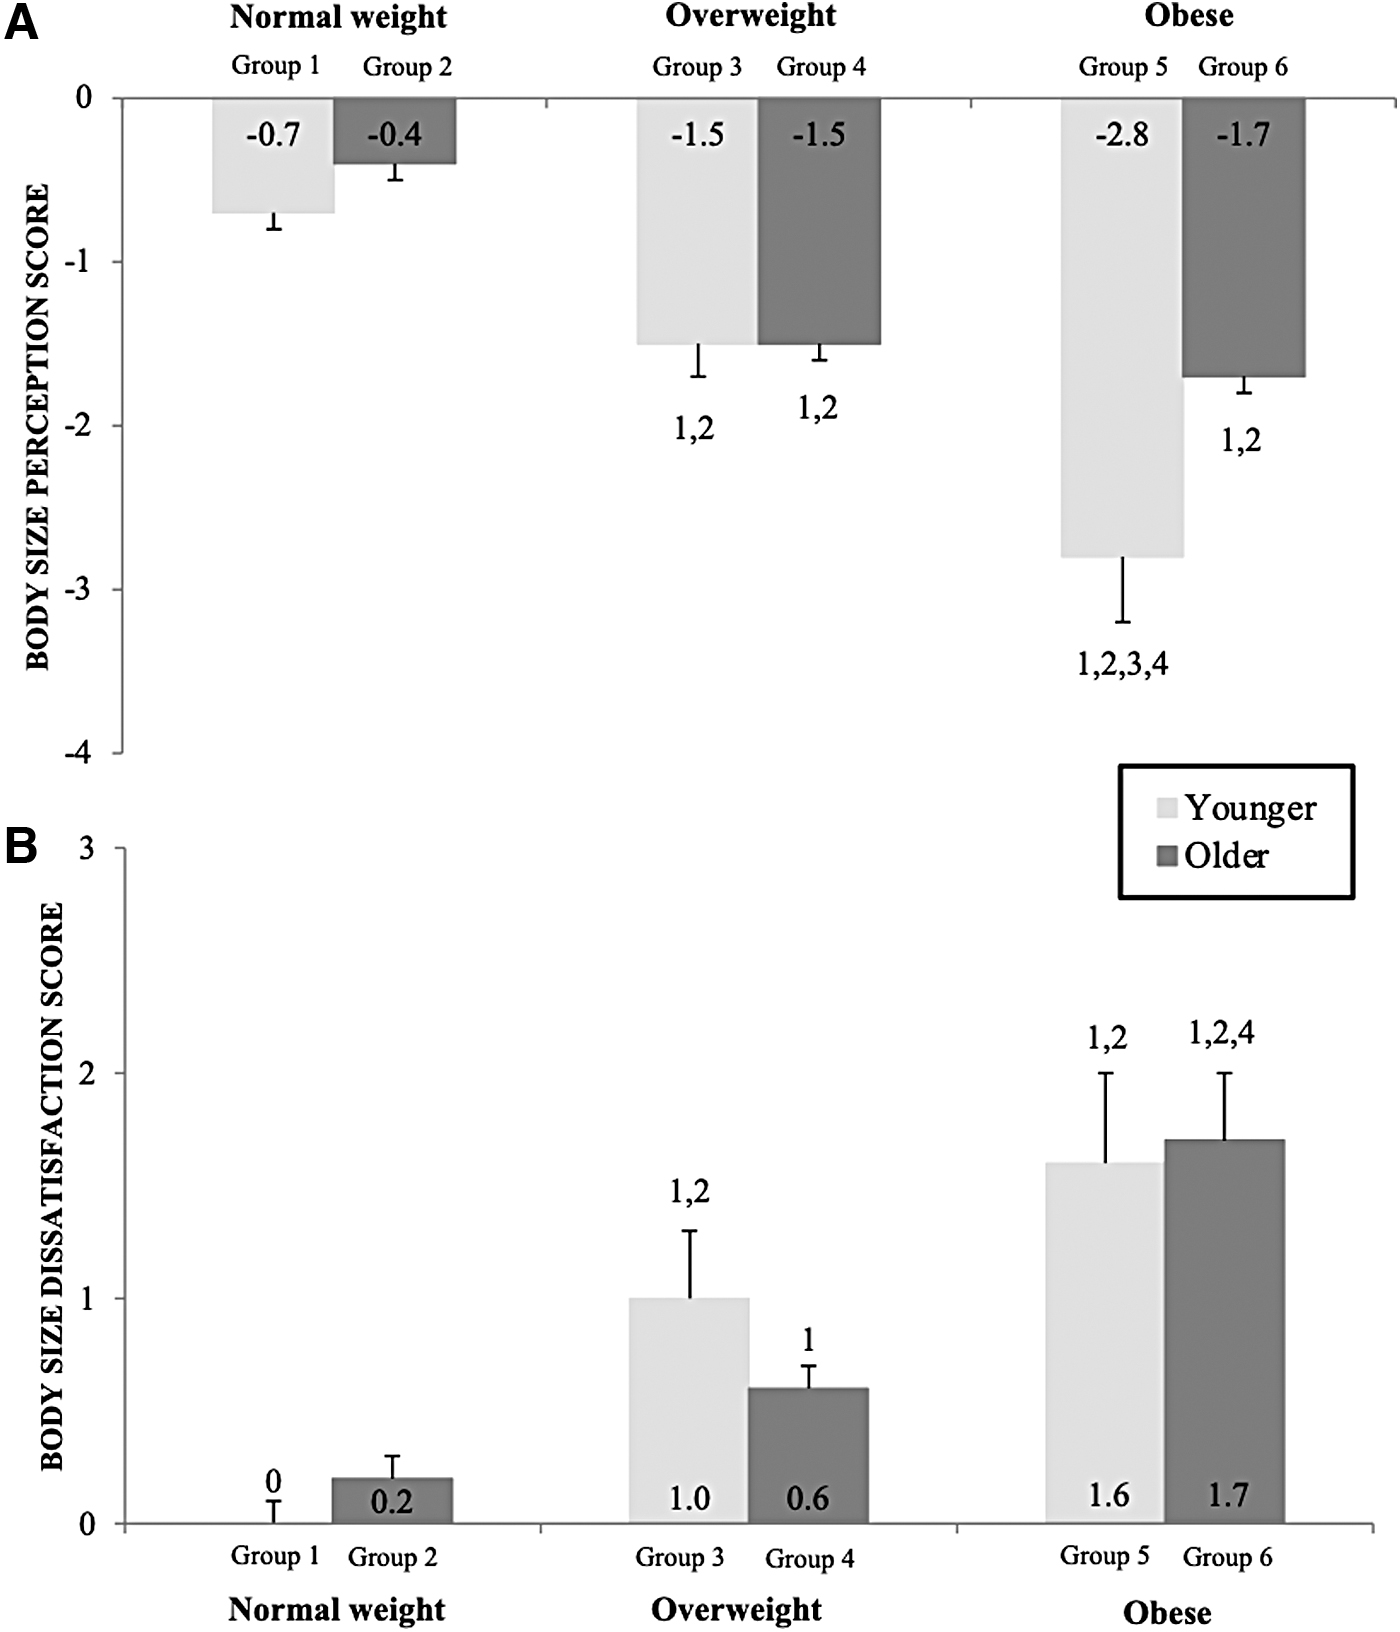
Results also show negative mean BSP scores, which correspond to an underestimation in each subgroup (Table 1). In this study, 25% of children had an accurate body size self-perception (accurate estimators), while 64% thought they were thinner (underestimators) and 11% thought they were heavier (overestimators). The prevalence of children in each BSP category was different according to body weight status. All children in the obese subgroup were categorized as underestimators, while this proportion reaches 92% among overweight subgroup (Fig. 1A). BSP scores were significantly different between the normal-weight group and the overweight and obese subgroups (−0.6 ± 1.0 vs. −1.5 ± 0.8 vs. −2.1 ± 1.0; p < 0.001, respectively). Furthermore, when weight status subgroups were further divided by age, no significant difference was observed for BSP scores between age subgroups within each weight status subgroup (Fig. 2A).

Prevalence of categorization of body size perception (accuracy, underestimation, and overestimation) and (A) body size dissatisfaction (satisfaction, desire to be thinner, and desire to be heavier) (B) by weight status (normal weight, overweight, and obese).
Body size perception scores
Body Size Dissatisfaction
The BSD score was used to identify the children who appear to have satisfaction with their perceived body size. In the whole sample, 51% reported being satisfied with their body size, while 37% wanted to be thinner and 12% wanted to be heavier. The prevalence of children in each BSD category was different according to body weight status (i.e., 53% of children living with overweight and 88% with obesity desired a thinner body size) (Fig. 1B).
When further divided by age, we observed that there is no difference between age groups (Fig. 2B). Children living with overweight and obesity show a higher desire to be thinner than the normal-weight subgroups (Fig. 2B). Even though the regression analysis showed a contribution of sex for the dependant variable BSD score, post hoc analyses show no significant difference for BSD scores between boys and girls (data not shown) among each weight status subgroups.
Relationship between BSP and BSD Scores
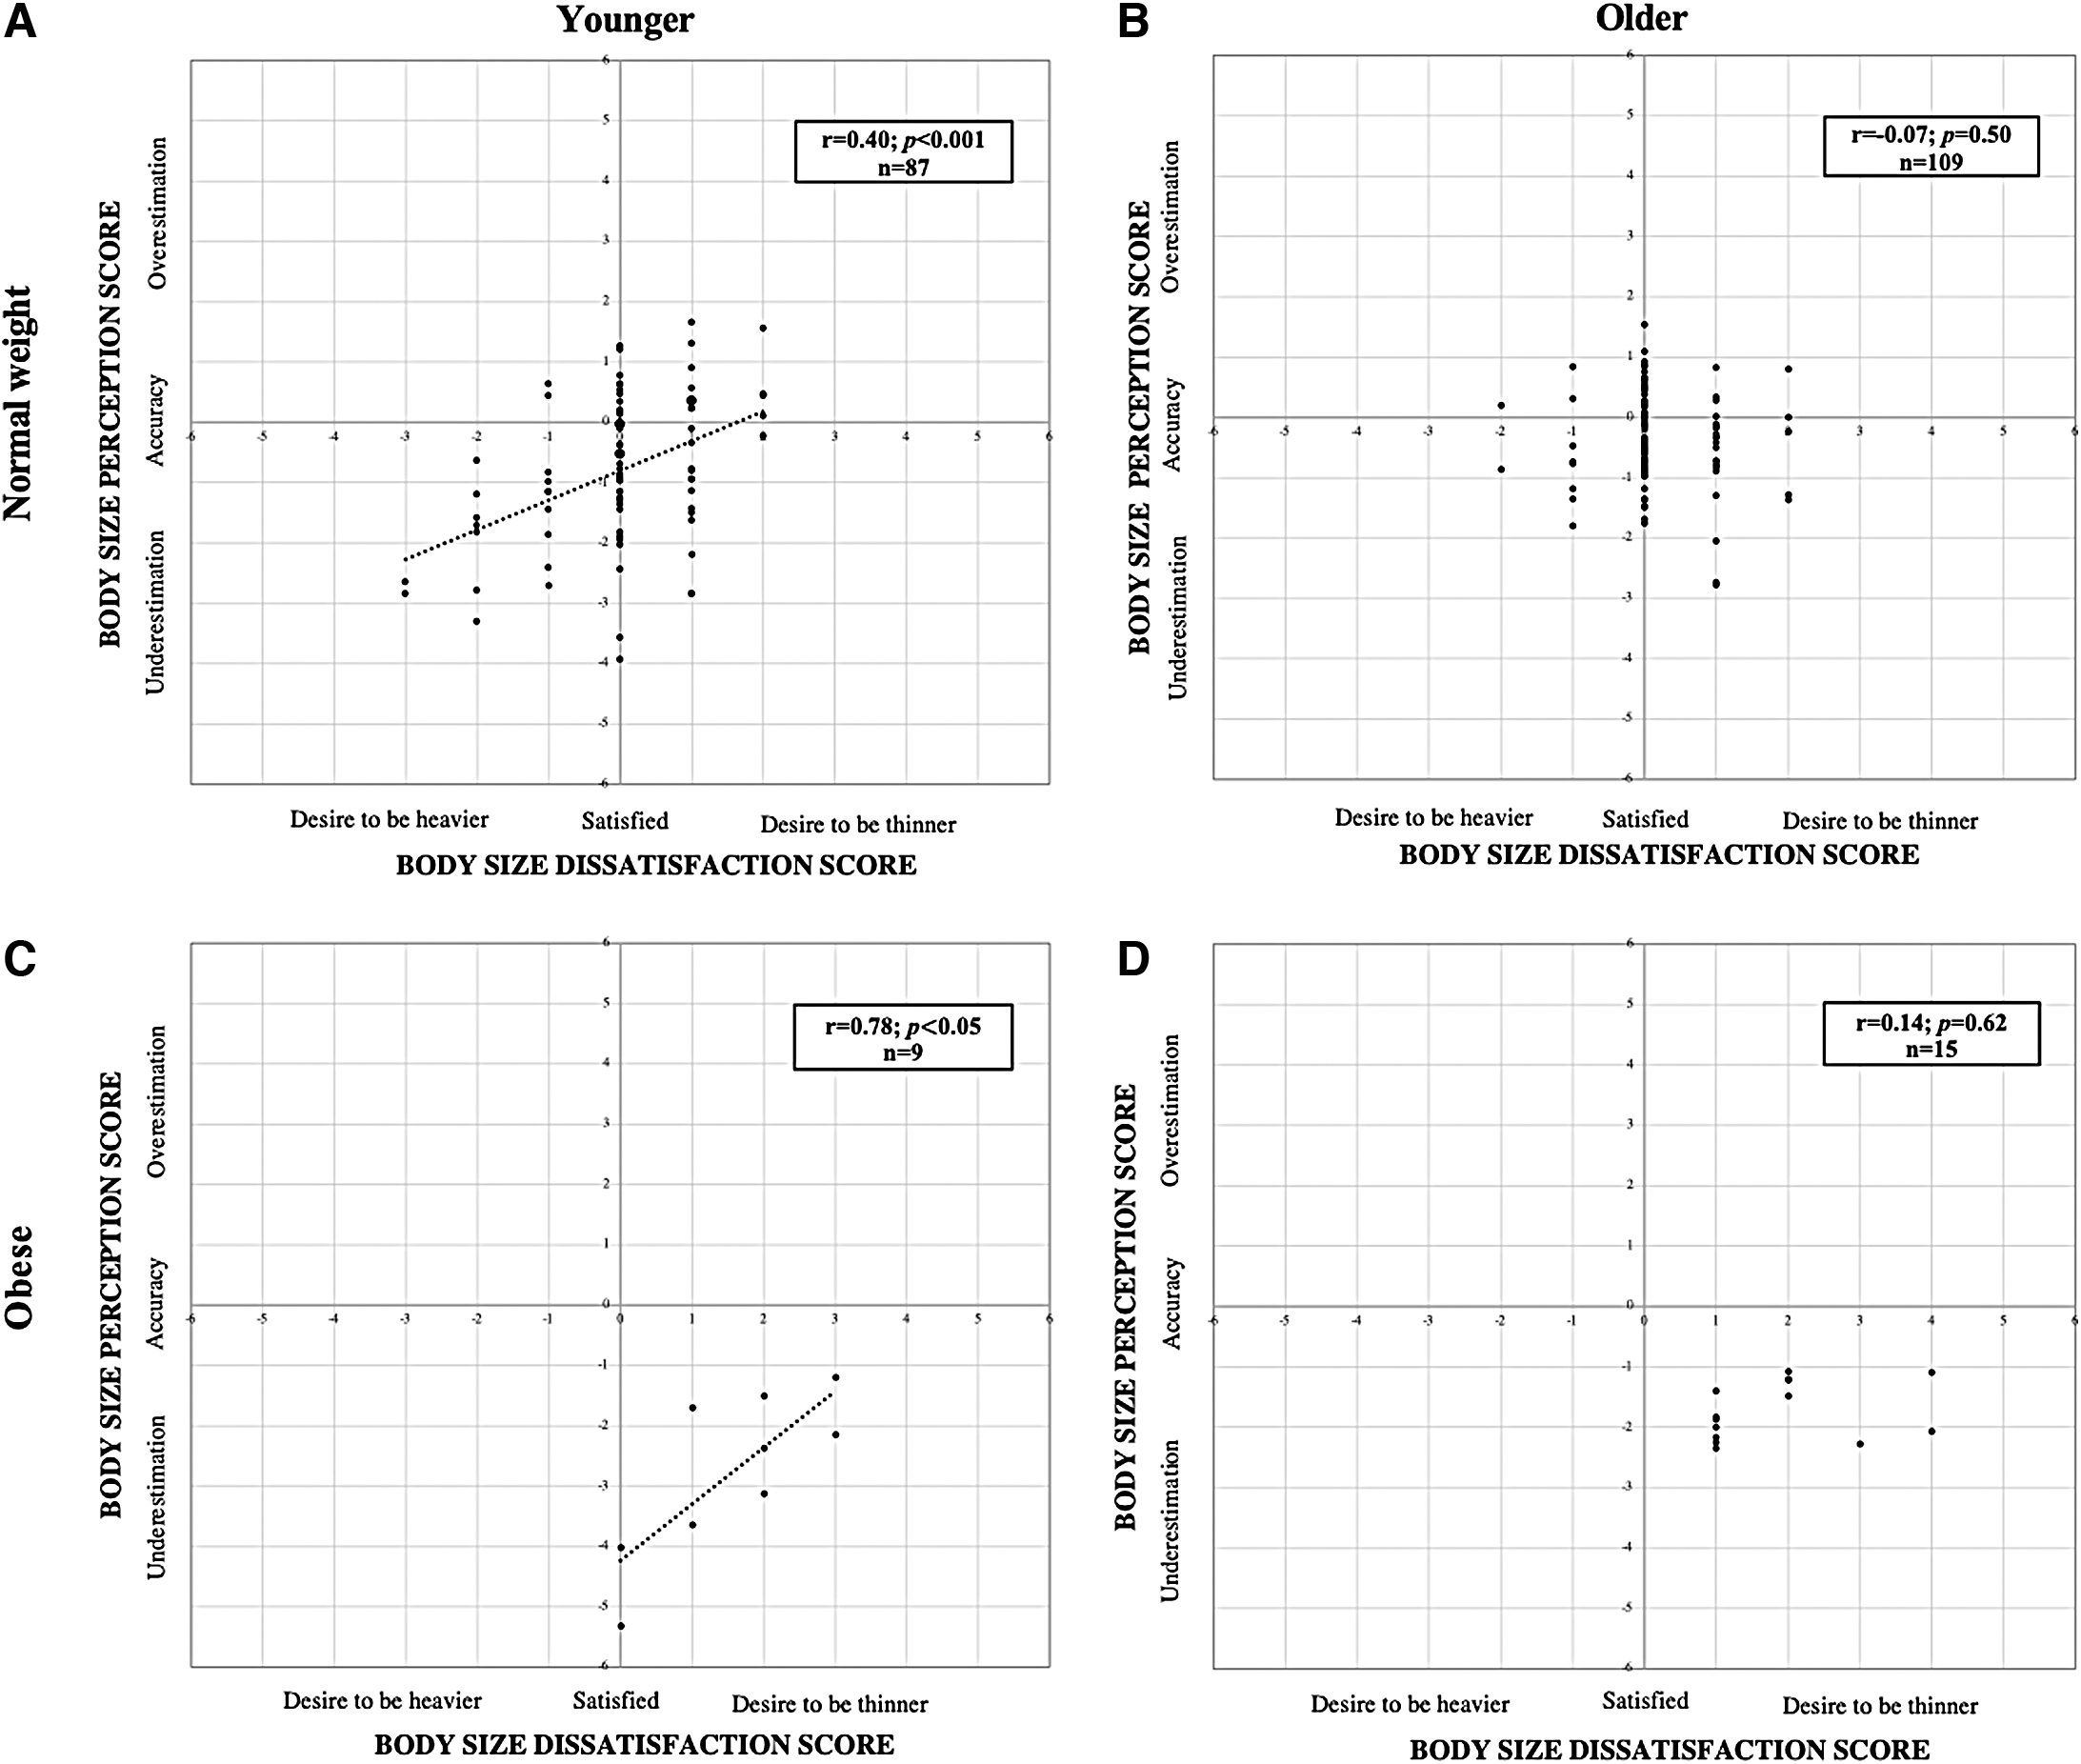
When looking at the Pearson's correlations on the entire sample, there was no association between BSP and BSD scores. Considering the contribution of age and BMIZ on BSP and BSD scores, Pearson's correlation was performed between these two scores within subgroups. No significant correlation was observed in younger and older subgroups of children who were classified as overweight. However, Figure 3A and C show significant positive correlations between BSP and BSD scores among younger children in the normal and obese subgroups (r = 0.40; p < 0.001 and r = 0.78; p < 0.05, respectively). Moreover, the relationships between BSP and BSD were significantly different between the two subgroups (slope and intercept: p < 0.001). No significant relationship was observed within the older children in the normal and obese subgroups (Fig. 3B, D).
Pearson's correlation between body size perception scores and body size dissatisfaction scores by weight status (normal weight, overweight, and obese) and age groups (younger and older) in children. Younger normal weight
Discussion
The aim of this study was to examine the association between BSP and BSD in elementary school children and to document the potential interactions of age, sex, and actual body size on their relationship. Misperception and dissatisfaction of body size were more present among children who were overweight or living with obesity. Almost all children from these two weight status subgroups underestimated their actual body size (92% in overweight subgroup and 100% in the obese subgroup), while more than half (55%) of the overweight subgroup and 88% of the obese subgroup were dissatisfied with their body size. Furthermore, no significant relationship was found between BSP and BSD scores in the entire sample, but when examining the contribution of weight status and age, positive associations were observed in the normal-weight and obese younger subgroups.
Our results revealed that children living with overweight and obesity were more likely than children with normal weight to demonstrate body size underestimation, which is in agreement with the literature.5–8 This underestimation among children living with obesity could be explained by the increasing exposure of children to adults living with obesity in our society. 29 As discussed by Boothroyd et al., individuals living with overweight/obesity (e.g., parents and schoolmates) can frequently be seen in children's environments and this may contribute to the modification of their perceptions of what constitutes a “normal” body size. 30 The misperception of a child's actual body size may also be driven by parents' beliefs or denial. 31
In this study, the desire to be thinner was also more prevalent in children living with overweight and obesity, which confirms data from previous surveys.7,12 The high prevalence of dissatisfaction in children could be explained by the negative attitudes about overweight and positive attitudes toward thinness conveyed in society.32,33 These results suggest no difference in BSD with age among elementary school children. This could be explained, in part, by children not having reached puberty. During the earliest phase of puberty, it is reported that body dissatisfaction appears to be more related to BMI than with sex. 34 Thus, our results show that BSD is observed as early as elementary school. However, no significant difference was observed between boys and girls. This last observation could be explained by the sample size. More studies are needed to investigate the sex contribution on dissatisfaction at this age.
Considering that body size underestimation and dissatisfaction are both common among children, investigating the associations between perception and dissatisfaction and the influence of individual factors such as body weight status on their relationship could help to understand how one variable may influence the other. Accordingly, we found significant correlations between BSP and BSD scores only in the normal-weight and obese younger subgroups. Furthermore, comparing the slope and intercept of these two weight status subgroups, we obtained significantly different relationship between BSP and BSD scores between normal-weight and obese younger subgroups (slope and intercept: p < 0.001).
When referring to the graphic representation, it is interesting to note that the significant positive correlations between BSP and BSD scores among younger children in the normal and obese subgroups are not located in the same dial and do not have the same slope, which suggests that these results may not be interpreted in the same way. In younger children living with obesity, the positioning and steeper slope of the positive regression line suggest that underestimation could be protective of BSD since these individuals appear to be more satisfied with their body size. This is in line with other studies that reported body size underestimation, particularly among young individuals living with overweight/obesity, could be associated with a greater body size satisfaction. 7 Moreover, some longitudinal studies have shown that underestimators may have a lower risk of weight gain in the following years regardless of their initial weight status.35,36
This relationship between BSP and BSD should be further investigated in other populations (e.g., adolescent) and other context (e.g., obesity treatment and prevention) and should include various lifestyle behaviors (e.g., diet quality and leisure-time physical activity levels) and environmental factors (e.g., parental styles, peer pressure, and socioeconomic status). A better understanding of potential determinants of the relationship between BSP and BSD may be useful to provide proper recommendations and interventions that will allow development of a positive body image. The relationship between BSP and BSD should also be investigated in adolescents. Body image components may have a noticeable impact on adolescence, an important period where self-esteem is evolving.37,38
Limitations
Study limitations should be considered when interpreting these findings. The main concern is the ability of children to self-evaluate their body size. 39 It has been reported by Collins that a tendency to select figures highly correlated with BMI increases for children around 9 years of age. 20 To further document the impact of puberty, the Tanner stages should be identified to provide additional information that may help to properly investigate potential age and sex differences. Also, the Collins's silhouettes consider only two dimensions of BSD (the desire to be thinner or heavier). It would have been interesting to be able to discriminate those children who desire to be more muscular from others who desire to be thinner.
In addition, it would be interesting to add other factors such as lifestyle habits as well as parental and peer pressures, which are known to impact self-esteem in children and adolescents. 40 Furthermore, because the small sample size is not representative of the whole population, our results cannot be generalized. Moreover, interpretation of subgroup analysis needs to be taken with care as some of them are composed of a small sample of children. Future research could replicate this study with a larger sample. Despite these limitations, this study provides novel findings regarding BSP and BSD in children and opens a whole field of investigation.
Conclusions
This research highlights the importance of understanding the components of body image (perception and dissatisfaction) as young as elementary school children. Underestimation and dissatisfaction of body size are significant in children who are overweight or living with obesity. Moreover, results from this study highlight that misperception could be protective in younger children living with obesity since it is associated with a lower drive to be thinner. These results show the relevance of investigating the association between BSP and BSD scores and the potential influence of individual factors. Better understanding of this relationship may help to develop specific prevention/promotion approaches in children and adolescents.
Footnotes
Authors' Contributions
G.L., C.B., V.D., and N.A. contributed to data collection; M.B. and G.L. analyzed the data; M.B., G.L., V.D., and N.A. interpreted results of the experiments; M.B. prepared the figures; M.B. drafted the article; V.D. and N.A. edited and revised the article; M.B., G.L., C.B., V.D., and N.A. reviewed and approved the final version of the article; and C.B. and N.A. conceived and designed the research.
Acknowledgments
We acknowledge Dr. Sylvie Dodin for providing access to data from summer day camp children. We thank all the children and their parents who participated in the study. We are very grateful for teachers, school principals, supporting staff, camp counselors, and coordinators who facilitated our data collection in schools, summer day camps, and specialized medical clinic. We also thank graduate students and research assistants who helped with data collection.
Funding Information
G.L. received a scholarship from Fonds de la recherche en santé du Québec (FRSQ). N.A. was supported by Centre de recherche en prévention de l'obésité (CRPO).
Author Disclosure Statement
No competing financial interests exist.