
Abstract
Background:
The COVID-19 pandemic has presented a great challenge to children and their families with stay-at-home orders, school closures, decreased exercise opportunities, stress, and potential overeating with home confinement. Our study describes the body mass index (BMI) changes over an entire decade, including a year of the COVID-19 pandemic at a large children's hospital.
Methods:
With our retrospective observational study, data were extracted from Cincinnati Children's Hospital's Epic electronic medical record, a free-standing children's hospital with 670 inpatient beds and >1.2 million patient encounters per year. Children aged 19 years and under with at least one height and weight were included in the analysis.
Results:
In all, 2,344,391 encounters were analyzed with 712,945 visits in years 2018–2021. The prevalence of overweight/obesity was relatively stable with a gradual rise from 35% to 36.4% from 2011 to 2020. However, the year of the COVID-19 stay at home and restrictions (2020–2021) showed an increase in overweight/obesity to 39.7% (8.3% increase), with the greatest increase in those with Class 3 obesity from 3.0% to 3.8%. When viewing the change in BMI percentile during the pandemic year compared with the 2 years prior, there was a significantly increasing trend (p < 0.0001).
Conclusions:
Children attending a large children's hospital showed an increase in overweight/obesity during the COVID-19 pandemic. These data suggest greater efforts are needed to reverse the increase in weight status from the COVID-19 pandemic as obesity is a risk factor for poor outcomes with COVID-19.
Introduction
COVID-19 illness caused by the SARS-CoV-2 was first described in December 2019, quickly spread worldwide, and on March 11, 2020, was declared to be a pandemic by the World Health Organization. 1 Although morbidity and mortality have been high among individuals with or without pre-existing health conditions, the COVID-19 pandemic has presented great challenges to children and their families with lockdowns, school closures, decreased exercise opportunities, stress, and potential overeating with home confinement.2–4 Multiple studies in adults show that these COVID-19 risk factors have led to weight gain.5–7 Studies in children have shown an increase in weight status during the early pandemic but are limited to lock down and the immediate period afterward of <1 year.8–13
On March 23, 2020, Governor Mike DeWine issued a stay-at-home order (SAHO) that required individuals to stay at home other than for essential services until May 29, 2020. 14 The Ohio SAHO had a profound effect on Cincinnati Children's Hospital (CCHMC) and the children and families it serves. CCHMC, with its 670 registered beds, is one of the largest children's hospitals in the world, averaging >1.2 million visits a year with patients from all 50 states and >50 nations.
In 2011, the hospital completed the rollout of its current electronic medical record creating an accessible database of weights, heights, and body mass index (BMI) on a large number of patients. With our retrospective study, we report on BMI trends over the past 10 years as well as the 1-year effect of the COVID-19 pandemic on the weight status of the children served by CCHMC.
Methods
With our retrospective observational study, data were extracted from the EpicCare Electronic Health Record (Epic Systems Corporation, Verona, WI) of CCHMC. Children of ages 2–19 years old with at least one height and weight were included in the analysis. Children seen in the emergency department were excluded as they do not typically have a height done at their visits. BMI and percentile for age and gender were calculated in Epic. Statistical Analysis Software (SAS®) was used to clean and process data. BMI measurements were grouped by BMI percentile for age and sex: <85th (normal or underweight), 85th to <95th (overweight), 95th to <120% of 95th percentile for BMI (Class 1 obesity), 120 to <140% (Class 2 obesity), and 140% and above (Class 3 obesity).
The number of admissions with a diagnosis of COVID-19, COVID-19 infection, COVID-19 viremia, and COVID-19 toes with a measured BMI was obtained using the “SlicerDicer” application of Epic. The percentage prevalence of BMI categories was compared year to year. In addition, we extracted the BMI percentile for each observation, evaluated the rate of change of BMI percentile over time, and compared pre-COVID-19 2018–2020 with COVID-19 2020–2021 using a General Linear Mixed Model that adjusted for multiple BMI measurements per child.
In addition, the trend over these 3 years was tested for significance with the Cochran–Armitage Trend Test. Years were grouped from April 1 to March 31 to align closely with the Ohio SAHO. Statistical significance was defined as p < 0.05. Unadjusted differences between the two pre-COVID-19 years and the COVID-19 year were tested using chi-square and Cramer V testing. The study was approved by the CCHMC institutional review board.
Results
From April 1, 2011, to March 31, 2021, there were 2,344,391 BMI observations on 404,022 patients, with 5.8 observations per child. From April 1, 2018 to March 31 2021, there were 712,945 BMI observations made on 195,490 patients. Over the 10-year study period, 51.1% were male, 69.1% were non-Hispanic White, and 20.9% were non-Hispanic Black with a mean age of 10.7 ± 4.97 (standard deviation) years. Of visits with a BMI calculated, 92.3% were as outpatients. During the COVID-19 year, there were 15,141 admissions with a BMI of whom 479 (3.2%) had a diagnosis of either COVID-19, COVID-19 infection, or COVID-19 viremia. The mean number of admissions with a BMI for the 2 years before the SAHO was 17,216 with 3 COVID-19–related diagnoses.
Figure 1 shows the unadjusted prevalence of BMI measurements by weight class over the 10-year study period. From 2011–2012 to 2019–2020, the combined overweight/obesity rate was relatively stable and showed a slight decrease of 1.1% by 1.4% compared with an increase of 2.5%% during the COVID-19 year (2020–2021). During the COVID-19 year, BMIs in the Class 3 obesity range increased by 0.7%, an increase of 20.5% for that class.
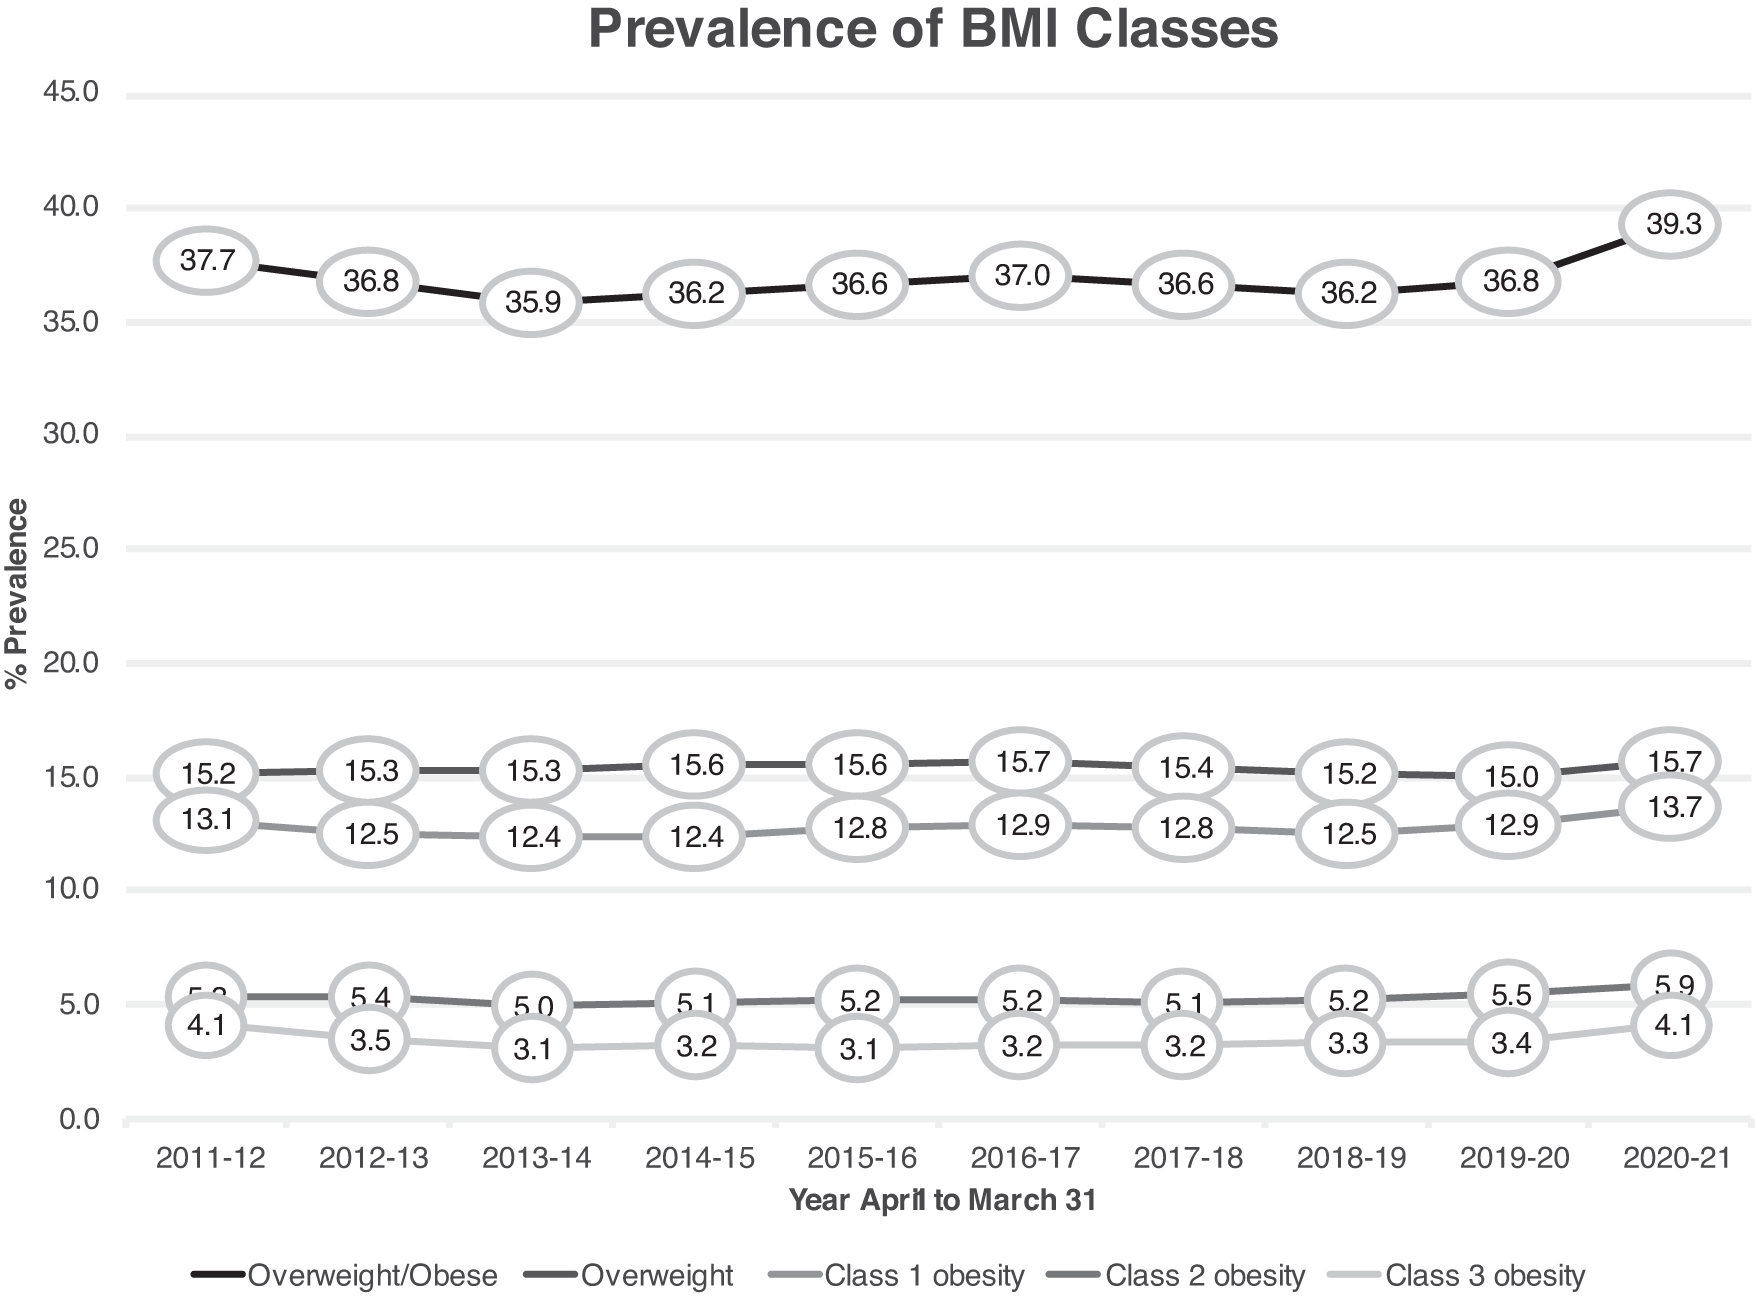
Prevalence of BMI percentile observations by weight class over the 10-year study period.
Figures 2–6 show how the BMI percentile for all patients in the study and patients grouped by gender, age, race/ethnicity, age group, and inpatient/outpatient changed during the COVID-19 year (2020–2021) and the two previous years (2018–2019 and 2019–2020). Using General Linear Mixed Model analysis, all groups showed a significant increase in trend (p < 0.0001) when comparing the COVID-19 year with the previous 2 years. The significance of the trend was confirmed by p < 0.001 by Cochran–Armitage testing. Table 1 summarizes the key and available variables of the two pre-COVID-19 years compared with the COVID-19 year.
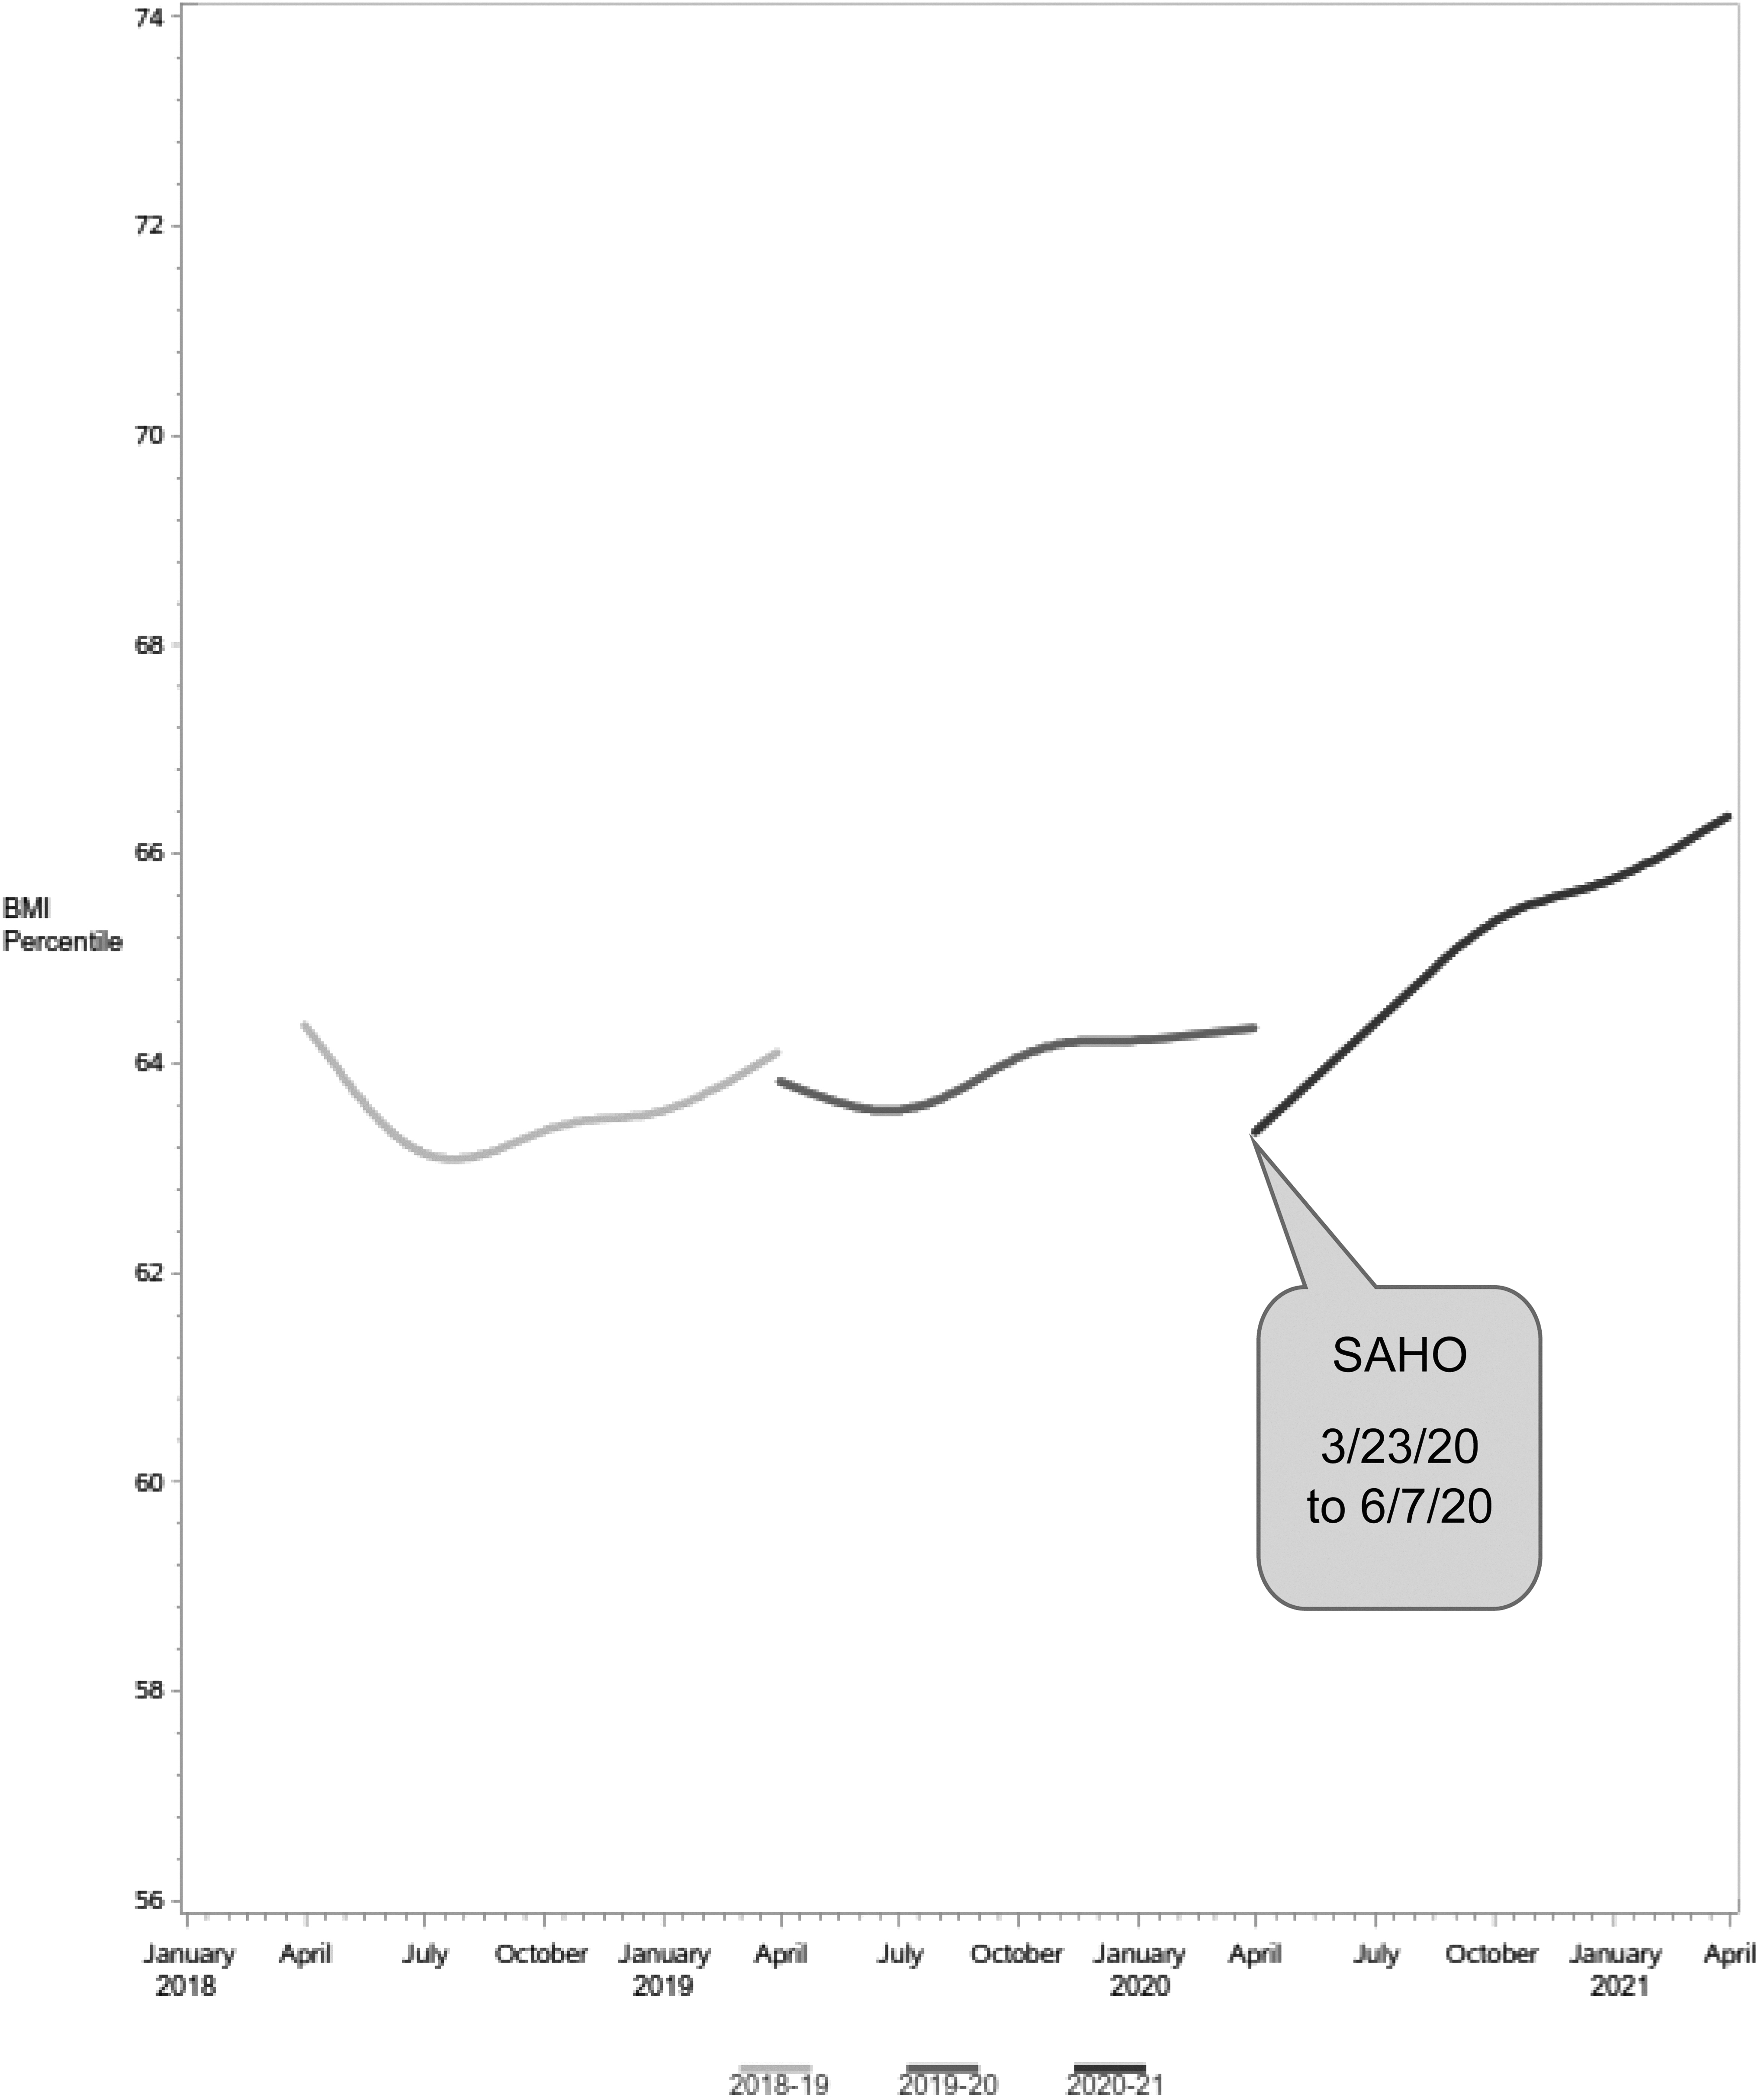
Mean BMI percentile for the entire study population over the 2 years pre-COVID-19 and during the COVID-19 year with SAHO period labeled. SAHO, stay-at-home order.
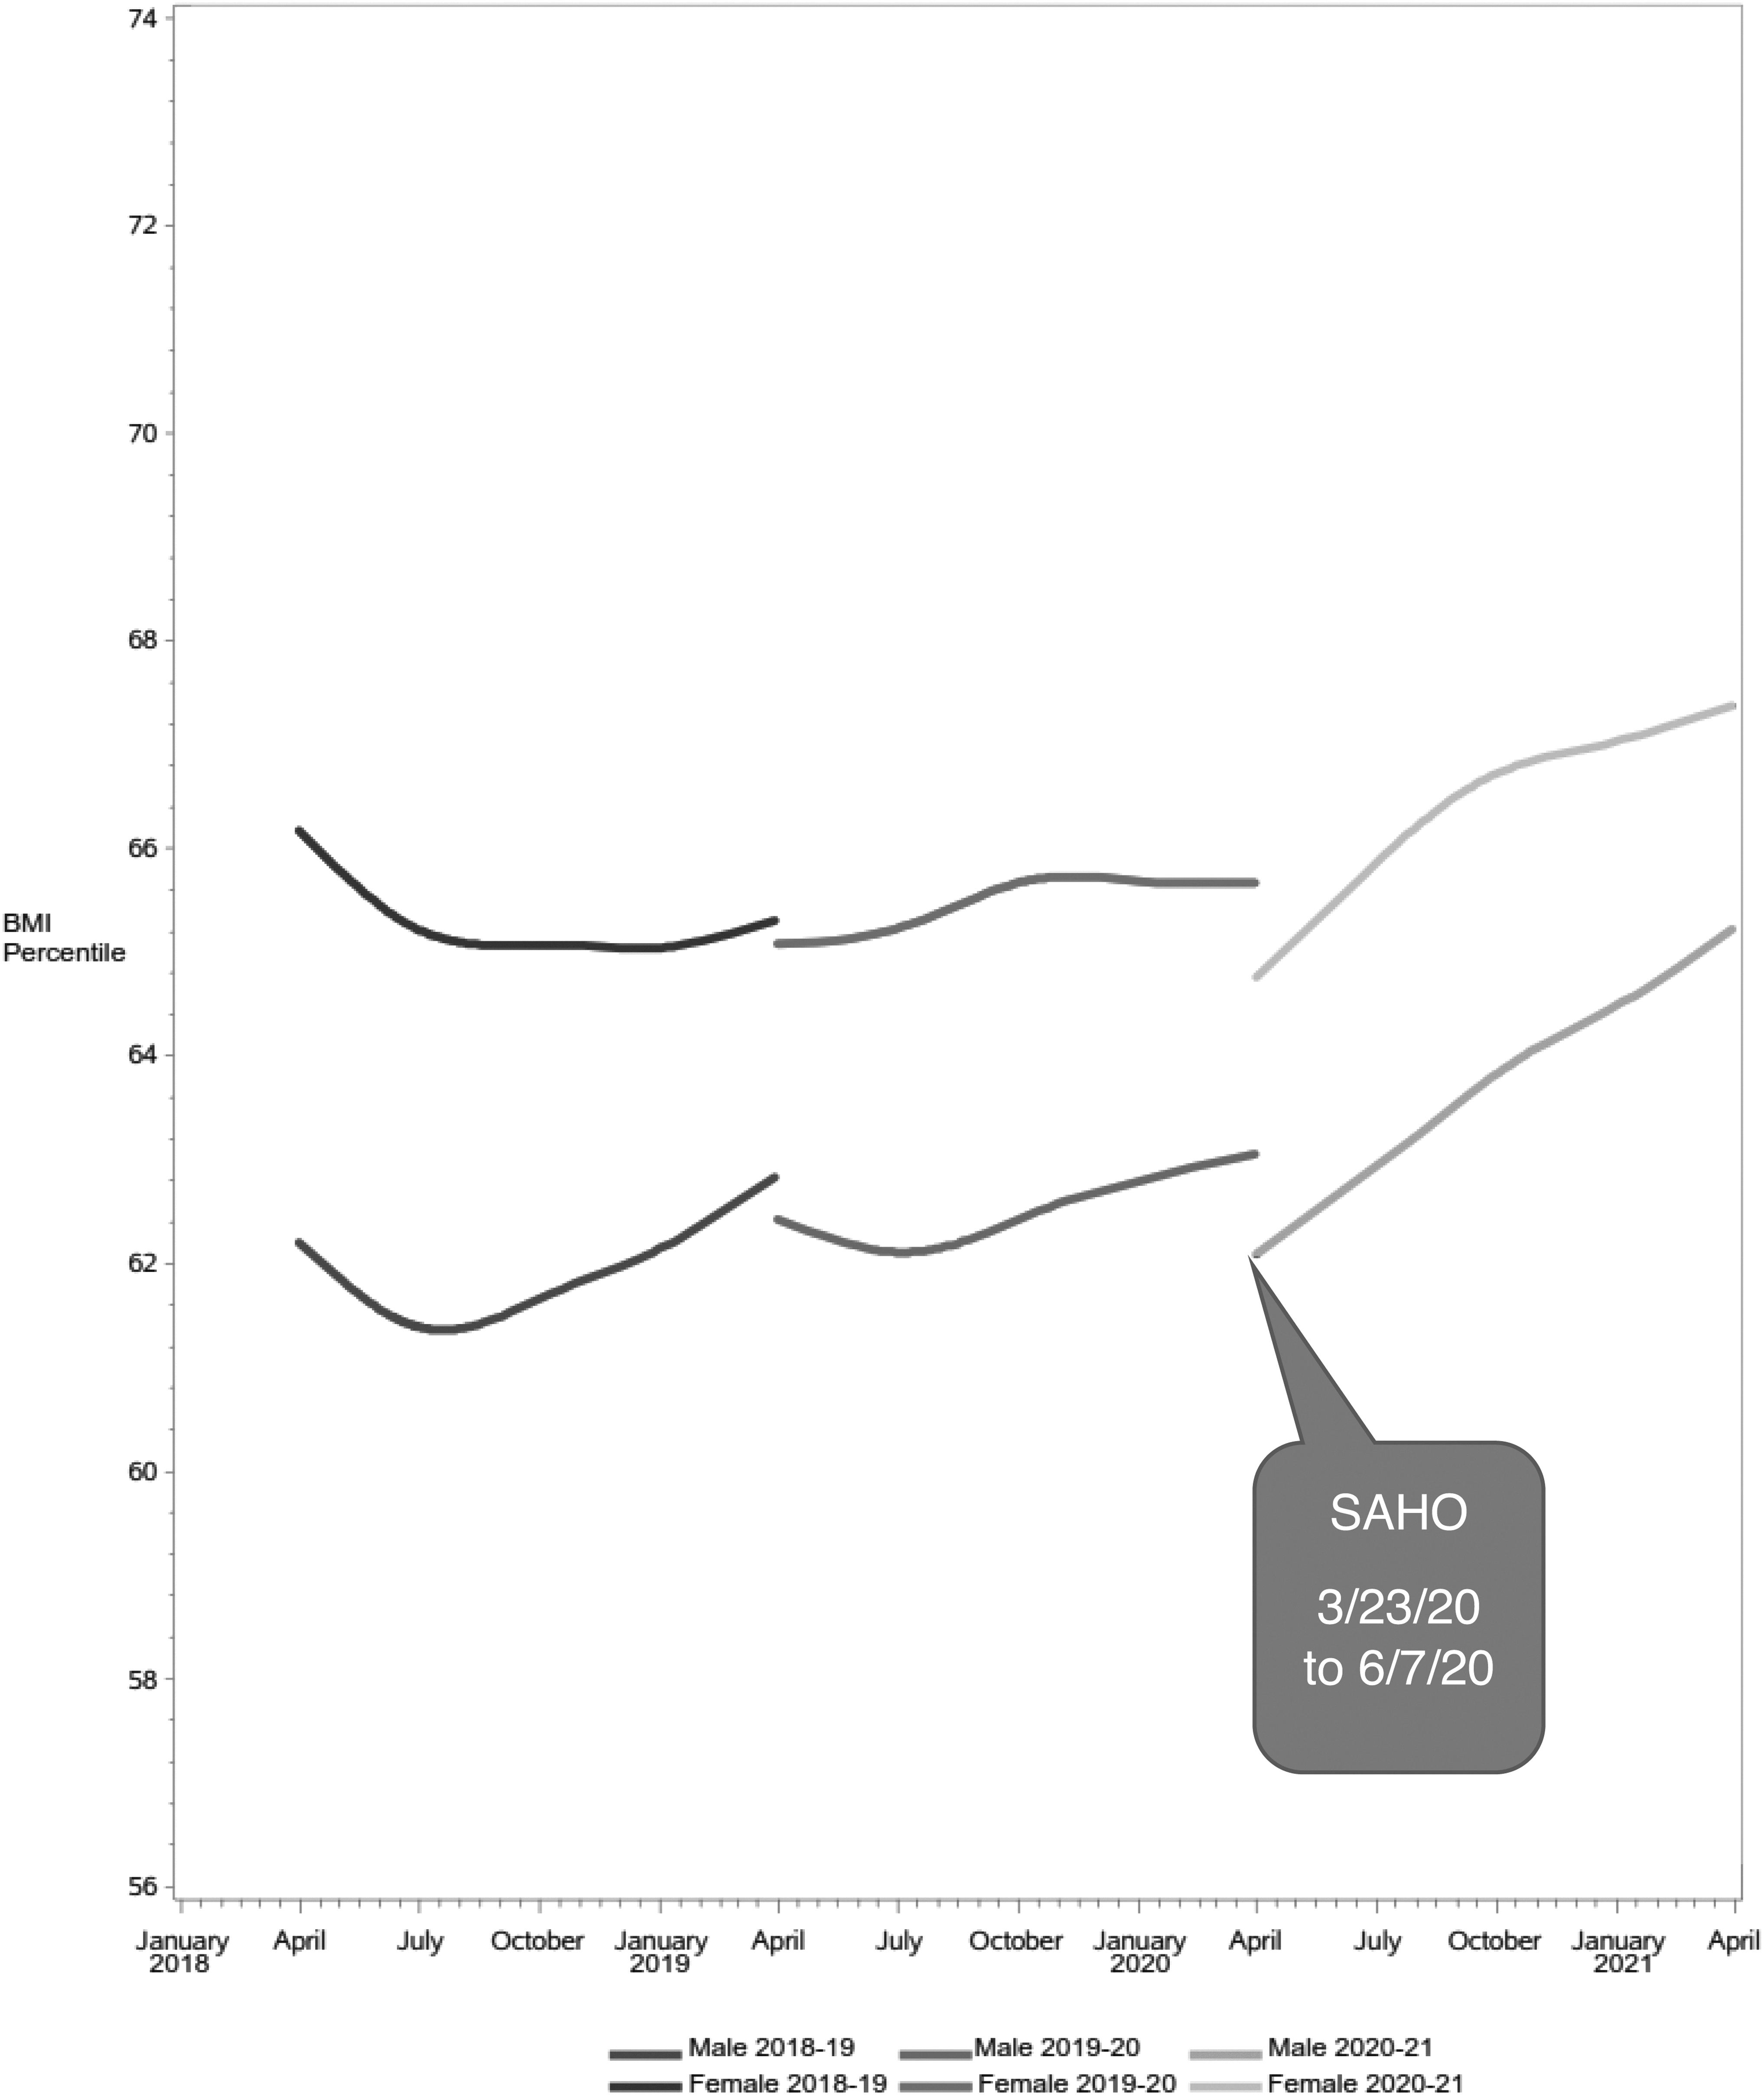
BMI percentile by gender over the 2 years pre-COVID-19 and during the COVID-19 year with SAHO period labeled.

BMI percentile by race/ethnicity over the 2 years pre-COVID-19 and during the COVID-19 year with SAHO period labeled.

BMI percentile by age group over the 2 years pre-COVID-19 and during the COVID-19 year with SAHO period labeled.
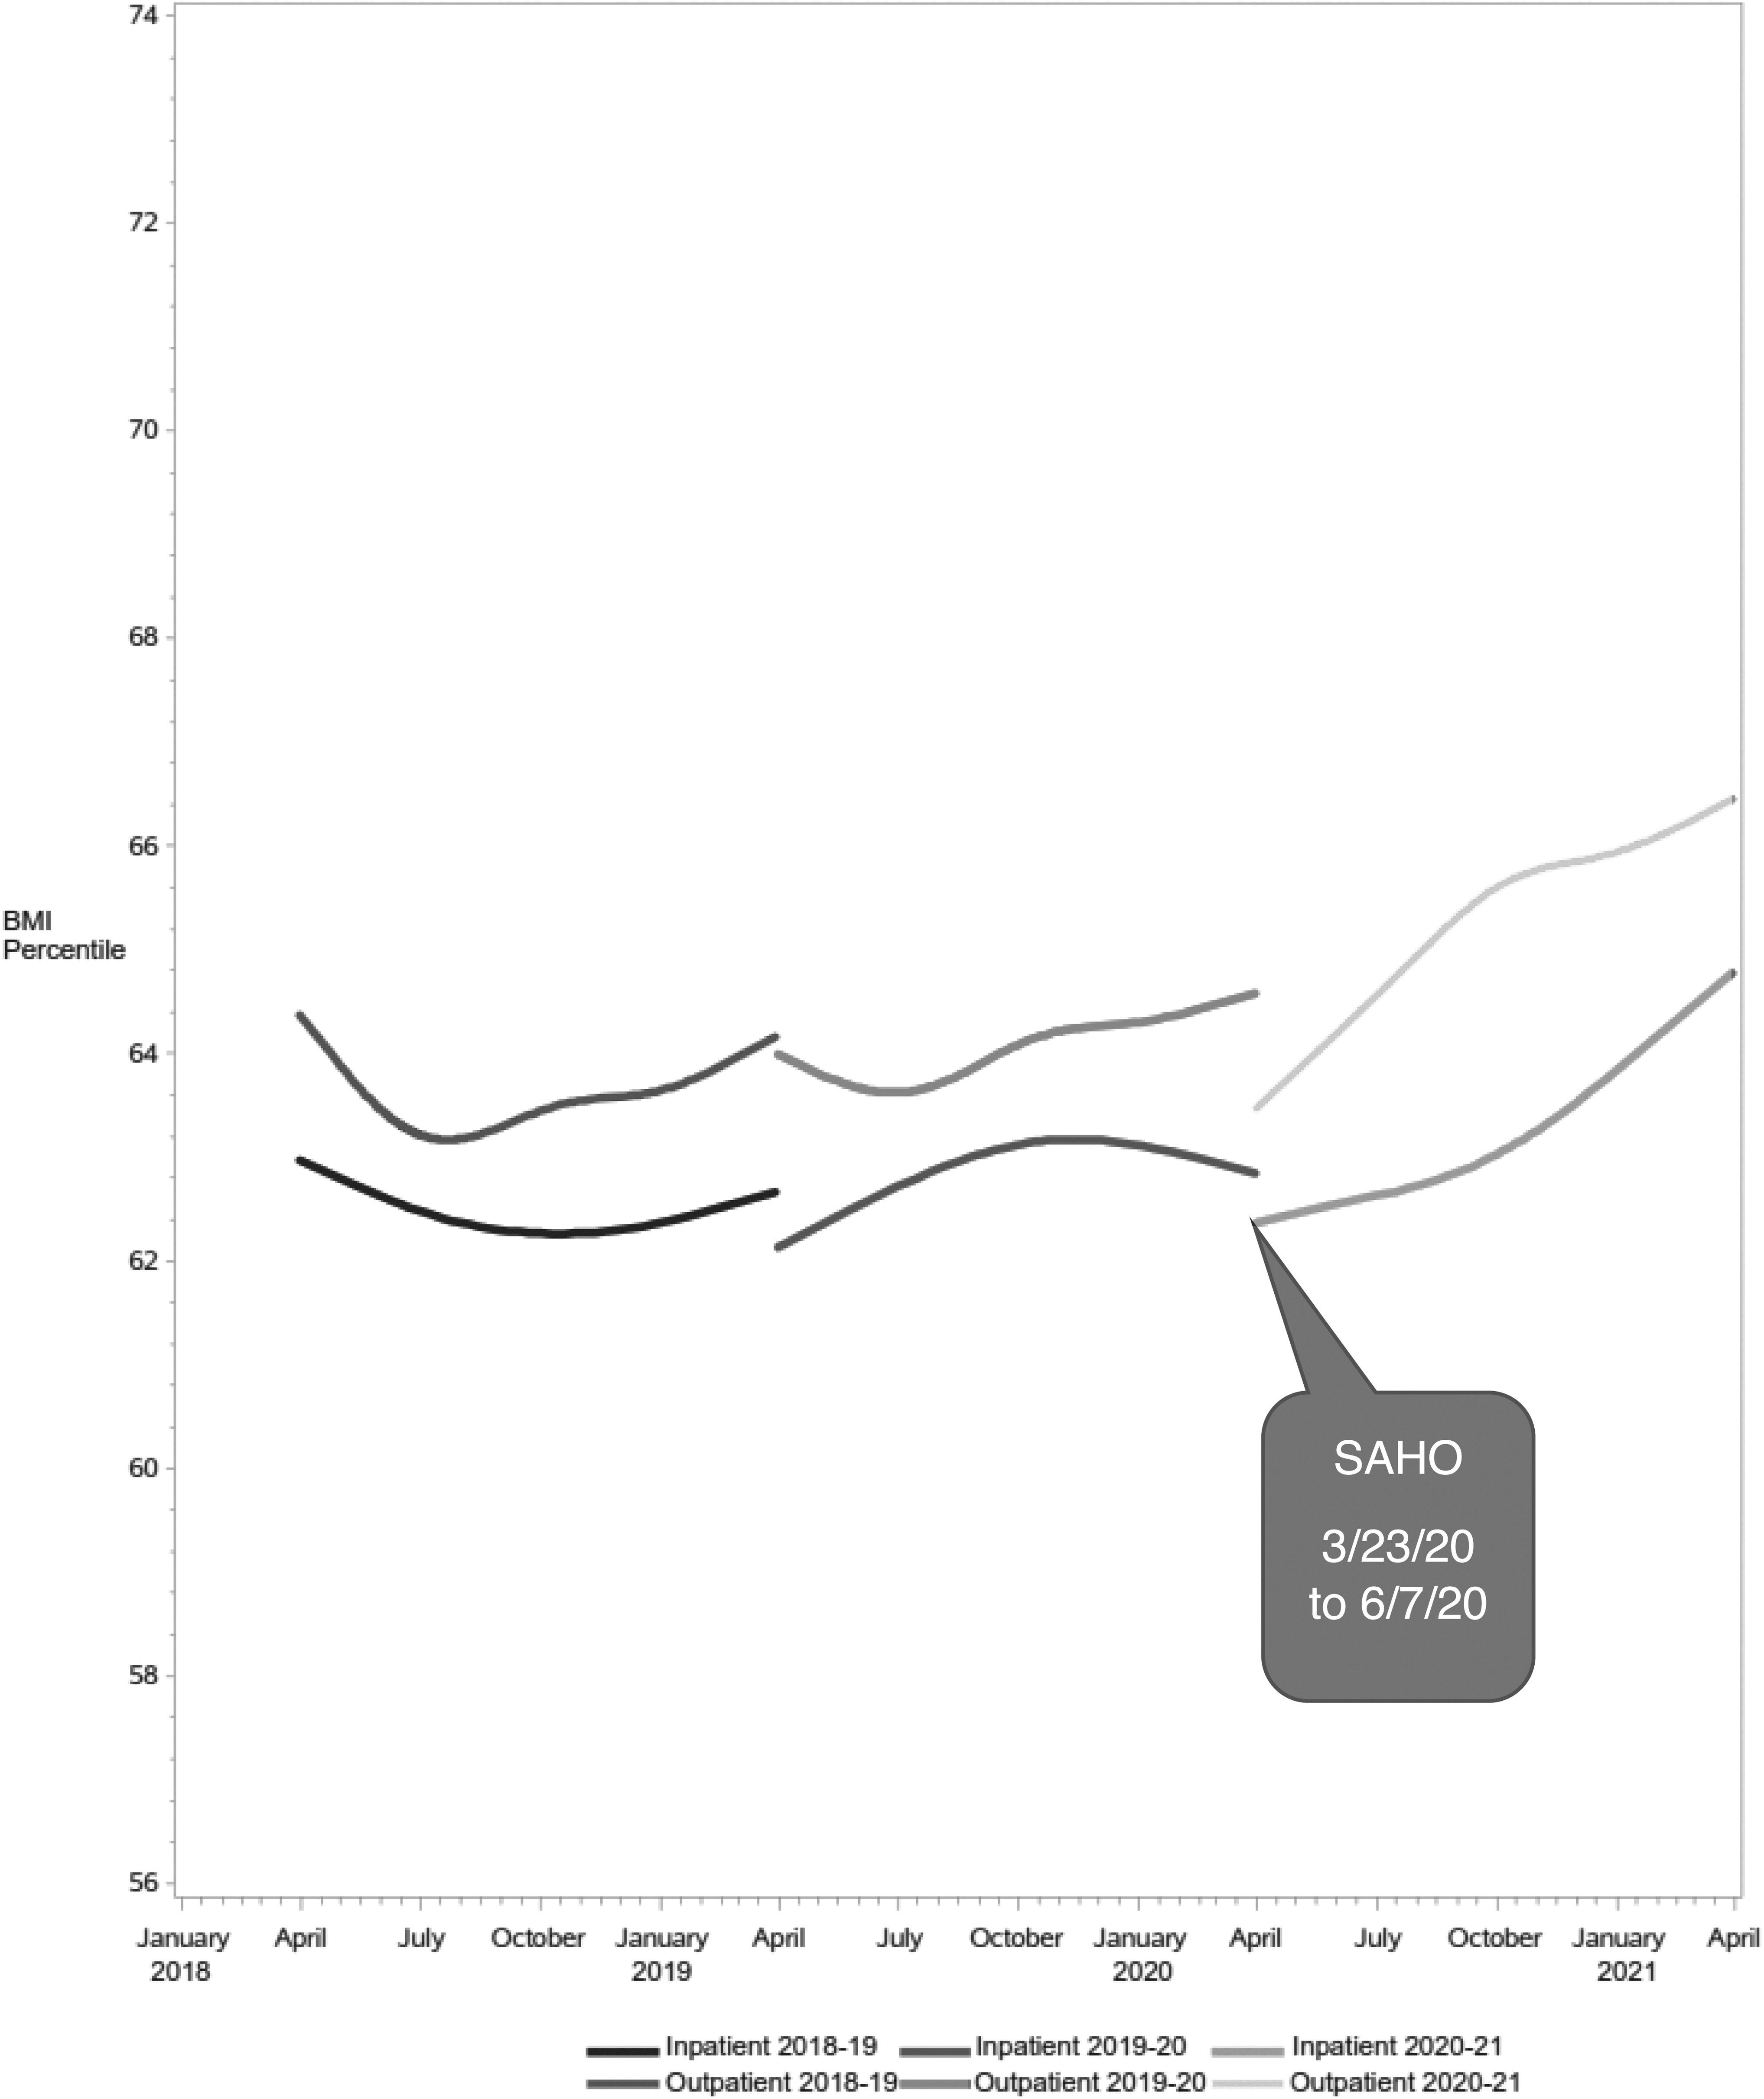
BMI percentile by inpatient and outpatient status over the 2 years pre-COVID-19 and during the COVID-19 year with SAHO period labeled.
Unadjusted Comparison of Variables 2 Years Pre-COVID-19 (2018 and 2019) and During the COVID-19/Stay at Home Year (2020)
Years are from April 1 to March 31.
Of note, when using chi-square analysis, the years differed with respect to gender, race/ethnicity, and percentage of inpatient and outpatient visits (p < 0.0001 for all three). The Cramer V test for the strength of the relationship, however, was low (all three <0.1), suggesting the associated difference between the numbers during the measured years is weak and the high level of significance is likely due to the large number of observations. Table 1 also includes the absolute number and percentage of BMI measurements in each weight status class in the 2 years before COVID-19 and the COVID-19 year. Of note, the percentage of those with BMIs overweight and with obesity in all four weight classes increased during the COVID-19 year.
Discussion
With our study, we demonstrate that when looking at children served by a large Midwestern children's hospital, there was a significant increase in weight status during the year of the COVID-19 pandemic beginning with a SAHO compared with weight trends from the previous 2 years. The increase occurred across all age, gender, and race/ethnicity groups as well as among inpatients and outpatients.
This increase is not surprising as the SAHO followed by COVID-19 restrictions as previously reported almost certainly led to increased sedentary behavior, unhealthy diet, increased intrafamilial stress, and mental health issues in children and adolescents.8–13 In addition, our study shows that this trend in increased weight status persists after 1 year of restrictions. The increase in weight status is particularly concerning as obesity and its comorbidities such as type 2 diabetes are risk factors for poor outcomes with COVID-19 infection.
Our study has limitations. The data obtained are from a clinical electronic medical record. There was no standardization in how weights or heights were done and there may have been errors in data entry. In addition, not all children had heights and weights done at all visits that may have biased the sample. Another concern is that there may have been differences in the patient population seeking care at the hospital during the pandemic. Of note, the percentage of BMI measurements that were overweight or obese increased during the COVID-19 year, but the absolute numbers in all the categories decreased.
Although the most likely explanation is that overweight and obesity increased and the absolute numbers decreased in each category because fewer children were seen at the hospital, it is possible that nonoverweight children were either less likely to present to the hospital or have a BMI measured during the COVID-19 year. Follow-up studies of BMI are needed to confirm the trend of increased BMI. Finally, our study is unable to specifically sort out the effect of COVID-19 infection on weight status compared with the restrictions of COVID-19 mitigation practices as we do not have COVID-19 prevalence data for outpatients as there was no universal testing at outpatient visits.
Our institution, however, did have a protocol of universal testing of all inpatients. Our prevalence of a COVID-19 diagnosis at 3%, however, suggests that direct infection was not the dominant effect, and much of the increase in weight status can be attributed to the effects of COVID-19 mitigation practices and the cascade of effects brought on the pandemic. Still, our data set is very large and the length of observations for COVID-19 data was 1 year. Our results help confirm that the COVID-19 pandemic has led to increased weight gain in children and adolescents.
How to lessen the effects of the pandemic remains unclear as many of the underlying factors that led to increased weight status such as food deserts or lack of access to recreational facilities were pre-existing and exacerbated by the pandemic. 1 Programs aimed at better nutrition and physical activity can be mediated nationally and locally. Using celebrities in national public service messaging on how and what school children should eat along with television or online segments of celebrities leading child-friendly exercise classes might be helpful. Schools could reinforce healthy lifestyle by offering instructor-led online exercise classes and providing literature on healthy eating suggestions and guidelines of when children should eat during the school hours.
During the lockdown phase in Ohio, outdoor exercise breaks were permitted. Formal exercise programs geared to families with school-age children, during the SAHO, may have been more effective in keeping children active and led to less weight gain. Before the pandemic, our group, the Center for Better Health and nutrition, piloted a program in which children and their families received a tangible teaching tool, a “FitKit,” of a nonperishable meal for four along with an exercise toy to help teach food preparation and physical activity. 15
During the pandemic, we distributed >12,000 meals at a cost of <$2 per meal. With funding, programs such as the “FitKit” could be spread to other communities and promote healthy eating and activity during a pandemic. Clearly, further efforts are needed to ensure that children and adolescents can maintain a healthy lifestyle during pandemic restrictions.
Footnotes
Acknowledgments
We gratefully acknowledge the help of the Heart Institute at CCHMC for its support of this project and the staff of the Heart Institute Research Core for their help in extracting the data. Presented in part at the 2021 Obesity Society Conference.
Funding Information
There were no external funding sources for this study.
Author Disclosure Statement
The authors have no conflicts of interest to report.