




Abstract
Background:
The “fat but fit” paradigm suggests that high fitness levels counteract the negative consequences of obesity on cardiometabolic risk, nevertheless, this paradigm has been less studied in children.
Objectives:
To analyze the relationship between “fat but fit” categories and cardiometabolic risk factors in school children, and to examine whether the intensity of physical activity (PA) is related with the fat but fit (FF) category in which the child is classified.
Methods:
We analyzed the baseline measurements of 312 school children aged 9–11 years involved in the clinical trial MOVI-daFit!, including adiposity parameters (BMI, waist circumference, and body fat mass percentage), cardiorespiratory fitness (CRF), blood pressure parameters, PA, and biochemical parameters (blood lipid profile, insulin, C-reactive protein, and glycosylated hemoglobin).
Results:
The cluster analysis of body fat mass percentage and VO2 max estimate z-scores agreed with the four categories of the “fat but fit” paradigm: fat unfit (FU), unfat unfit (UU), FF, and unfat fit (UF). Analysis of variance (ANOVA) models indicated that children in the FF and UF clusters had better levels of biochemical parameters [high-density lipoprotein cholesterol (HDL-c), triglycerides (TG), TG/HDL-c, insulin], vigorous PA amount and metabolic syndrome (MetS) index than their peers in the FU and UU cluster categories (p < 0.05).
Conclusions:
Our results reinforce the “fat but fit” paradigm proving that CRF levels can counteract the effect of obesity on some cardiometabolic risk factors (HDL-c, TG, TG/HDL-c, insulin, PA, and MetS) in school children. ClinicalTrials.gov Identifier: NCT03236337.
Introduction
In children, the relationship between obesity and an unhealthy cardiometabolic risk has been widely studied.1,2 In addition, cardiorespiratory fitness (CRF) has been suggested as a marker of cardiovascular health in children and adolescents, such that higher levels of CRF are associated with a better cardiovascular profile.3–5 However, the evidence regarding whether CRF influences cardiometabolic risk regardless of adiposity levels is not as conclusive. In fact, several studies have explored the mediator role of BMI on the association between CRF with some cardiovascular risk factors.6,7
BMI is recognized as a reasonably practical and inexpensive indicator of overall adiposity, and an important risk factor for several chronic diseases such as hypertension or diabetes and for all-cause mortality, but BMI is still an index of weight relative to height and, therefore, does not discriminate between fat and lean body mass.8,9 In fact, the relationship between BMI with various diseases and mortality, at least theoretically, should not be as clear as that body fat or lean body mass because BMI includes two compartments of body composition that are antagonistic in terms of their influence on health, while excess body fat is a risk factor for several chronic diseases, skeletal muscle, the main part of lean body mass, is a protective factor for most of these diseases. 10
The “fat but fit” paradox argues that good physical fitness levels may attenuate the negative consequences of obesity on cardiovascular risk and mortality.11,12 This paradigm suggests that an individual with excess of adiposity but with high CRF levels has less cardiometabolic risk than their peers with excess of adiposity but with low CRF levels, even better than normal-weight unfit individuals.13–15 Furthermore, individuals with obesity and moderate-to-high CRF levels did not show a significantly higher risk of cardiovascular disease mortality than the theoretically healthiest group possible (normal-weight and fit).12,16 These assumptions have been repeatedly demonstrated in terms of cardiovascular risk 17 and other health variables such as depression, 18 or bone health in adults 19 and health-related quality of life in children 20 However, it has so far not been analyzed in children whether, as in adults, “fat but fit” categories are related to cardiometabolic profile.
Some studies analyzing the validity of the “fat but fit” paradigm include fitness or exercise interchangeably in their analyses; however, physical activity (PA) is not synonymous with fitness. In children, PA, although influenced by numerous individual and social determinants, is a planned volitional behavior, 21 but physical fitness, especially in childhood, is largely genetically determined. 22 Furthermore, it is assumed that in children, PA promotion programs tend to improve CRF; however, it has been observed that this improvement in VO2 max is greater for girls than for boys,23,24 although it is far from being a large improvement (ΔVO2 max MD:1.19 mL/[kg·min]), 25 even in the case of high-intensity interventions26,27 Therefore, it seems necessary to examine whether PA modifies the probability of belonging to any fat but fit (FF) category, something that has not been done so far.
Thus, this study aimed to analyze the relationship between the categories of “fat but fit” paradigm and cardiometabolic risk factors using statistical clustering techniques in children, and to examine whether the amount and intensity of PA that children engage in daily is associated with the “fat but fit” category in which the child is classified.
Methods
Study Design and Participants
This study is a cross-sectional analysis of data from baseline measurements (September–November 2017) of the MOVI-daFit! project. It was a cluster randomized controlled trial aimed to assess the effectiveness of a high-intensity interval training intervention to reduce cardiovascular risk and to improve physical fitness and academic achievement in school children. Recruitment, data collection, and measurement procedures have been described extensively elsewhere. 24 MOVI-daFit! study included 559 school children aged 9–11 years from 10 public schools from the province of Cuenca (Castilla-La Mancha region), Spain. All participants met the inclusion criteria: (1) they did not have any Spanish learning disability and (2) did not have any physical or mental disorder or chronic disorder impeding child participation in the intervention.
The study protocol was approved by the Clinical Research Ethics Committee of Virgen de la Luz Hospital in Cuenca (REG:2016/PI021). Before the study started, the director's and board of governors' approval was requested to access schools, and all children's parents belonging to the fourth and fifth grades were invited to participate in this project. According to the general recommendations of the Declaration of Helsinki parents were asked to sign informed consent allowing their children to participate.
Study Variables
In each school, trained researchers measured the variables under standardized conditions. Anthropometric variables were measured twice at a 5-minute interval, considering the average for the analyses. Weight and height were measured with children in light clothes and barefoot, using a scale and a wall-mounted stadiometer (Seca 861 and Seca 222, respectively). We calculated BMI as weight in kilograms divided by the square of height in meters. Children were classified as underweight, normal weight, overweight, or obese, according to BMI cutoff values stablished by the International Obesity Task Force. 23
Waist circumference was determined by the average of three measurements taken with flexible tape placed at the midpoint between the last rib and the iliac crest at the end of a normal expiration. Body composition [i.e., fat mass percentage (% fat mass) and fat-free mass] was determined using the output results from an eight-electrode Tanita® Segmental-418 bioimpedance analysis system (TANITA Corporation, Tokyo, Japan). Measurements were obtained twice under controlled temperature and humidity conditions. Before testing, children were fasting and were asked to void their bladder, remove their shoes, and rest for 15 minutes. To assess the sexual maturation, parents identified their children's pubertal status using figures based on the Tanner stages.
Diet quality was estimated using the Children's Eating Habits Questionnaire (CEHQ), completed by parents. 28 The CEHQ includes a food frequency section in which parents reported the frequency of their child's consumption of 15 food items in a typical week during the preceding 4 weeks. Response options displayed from left to right were as follows: “Never,” “Less than once a week,” “Once a week,” “2–4 times a week,” “5–6 times a week,” “1 time per day,” and “2 or more times per day.”
A health dietary quality index was calculated, which contained each food item component. Each component has a minimum score of 0 and a maximum score of 7, where the highest score indicates the highest possible quality of the diet. In this sense, the items that scored positively (higher score indicates greater frequency of consumption) were the following: consumption of fruit, vegetables, milk, cheese or other dairy products, cereals, bread, and fish. Otherwise, the items that scored inversely (higher score indicates lower consumption frequency) were the following: sweets, sugar-containing soft drinks, light soft drinks, and chips. 29
Diastolic blood pressure (DBP) and systolic blood pressure (SBP) were determined twice at a 5-minute interval, after a 5-minute resting period, using an OMROM-M5-I device (Omron Healthcare Europe BV, Hoofddorp, Netherlands) and different sized cuffs according to the child's arm circumference. The mean arterial pressure (MAP) was calculated using the formula: DBP + [0.333 × (SBP − DBP)]. 6 Pulse pressure (PP) was calculated by subtracting the (average) DBP from the (average) SBP value.
Biochemical determinations were obtained through the blood sample after a 12-hour fasting period. Total cholesterol, triglycerides (TG), high-density lipoprotein cholesterol (HDL-c), low-density lipoprotein cholesterol (LDL-c), insulin, glycated hemoglobin A1c (HbA1c), and C-reactive protein were determined. Lipid profile determinations were performed using the Cobas 8000 Roche Diagnostics system. Insulin was determined with the Architect i2000 Abbot Diagnostic system.
C-reactive protein was measured using the Cobas 6000 Roche Diagnostic system and HbA1c was measured by high-performance liquid chromatography with the analyzer ADAMS HA 8180 V Menarini Diagnostic, which was standardized for the Diabetes Control and Complications Trial, and the International Federation of Clinical Chemistry and Laboratory Medicine. When blood samples were not going to be in the laboratory in <75 minutes (due to the distance between the school and the laboratory) these samples were refrigerated in a portable cooler. Finally, the metabolic syndrome (MetS) index was calculated as the sum of the age-sex standardized scores of waist circumference, TG/HDL-c ratio, MAP, and fasting insulin. 30
To determine the amount of time children spent in each category of PA intensity, GENEactive accelerometers (ActivInsights) were used for 7 consecutive full days, with a fixed frequency of 30.0 Hz to record the data raw of acceleration measured in “g” for each movement axis (x, y, and, z). 31 We considered the measurements valid when accelerometer was worn ≥5 days, including 1 weekend day. The cutoffs applied were as follows: until 677 counts per minute for light PA, from 678 to 2263 counts per minute for moderate PA, and ≥2264 counts per minute for vigorous PA, based in the macro recently replaced by R Markdowns (www.activinsights.com/expertise/geneactiv/downloads-software/).
To determine CRF, the Course-Navette test (20-m shuttle run test) following the Leger's protocol was used. 32 The last half-stage completed (1 stage = 1 minute) by the children was considered the CRF level. In addition, the estimated maximal oxygen intake (VO2 max estimate) was calculated using the Leger 20-m shuttle run formula. 32
Statistical Analysis
First, we checked the distribution of continuous variables for normality using both statistical (Kolmogorov–Smirnov test) and graphical (normal probability plot) approaches. Then, we estimated partial correlation coefficients to examine the relationship between the study variables, controlling for age, sex, and Tanner stage.33,34
To identify homogeneous groups according to children's body composition and physical fitness based on the z-scores of % fat mass and CRF (VO2 max estimate), we conducted a hierarchical cluster analysis using Ward's method based on a squared Euclidean distance. 35 To reduce the sensitivity of Ward's method, all outlier values were removed before analysis. The number of clusters was established by visual inspection of the dendrogram and according to the conceptual model. The cluster analysis resulted in a four-cluster solution including the following categories: (1) fat unfit (FU), (2) unfat unfit (UU), (3) FF, and (4) unfat fit (UF).
Analysis of covariance (ANCOVA) models were used to test mean differences in health dietary score index, PA, physical fitness, body composition variables (independent variables), and biochemical blood variables (dependent variables) between “fat but fit” categories (fixed factors). Bonferroni test was used to examine the pairwise post hoc multiple comparisons.
In a supplementary analysis the results by sex were presented due to the observed statistically significant differences between boys and girls in % fat mass, health dietary score index, PA, physical fitness, and several biochemical cardiometabolic risk factors.
All statistical analyses were performed using the SPSS software v.28 for Windows (IBM Corp., Armonk, NY, USA). Statistical significance was set at 0.05.
Results
Of the 559 participants included in the MOVI-da fit! study, a subsample of 312 school children, 144 boys (46.2%) and 168 girls (53.8%), were included for the analysis of this study, from whom data on all study variables were collected. The children included in the data analysis for this study did not differ in age, sex, or BMI from the whole sample of children participating in the trial.
Table 1 shows descriptive characteristics (mean ± standard deviation) of the study sample by sex; there were significant differences by sex for % fat mass, CRF, light and vigorous PA, Tanner stage, SBP, PP, HDL-c, TG, TG/HDL-c, insulin, and C-reactive protein.
Characteristics of the Study Sample by Sex
Values are means ± SD. Bold values indicate statistical significance p ≤ 0.05.
Student's t-test (continuous variables), or chi-squared tests (categorical variables).
Higher scores indicate a better quality of diet.
MetS index reported as the sum of the age-sex standardized scores of waist circumference, TG/HDL-c ratio, MAP, and fasting insulin.
CRF, cardiorespiratory fitness; DBP, diastolic blood pressure; HbA1c, glycated hemoglobin A1c; HDL-c, high-density lipoprotein cholesterol; LDL-c, low-density lipoprotein cholesterol; MAP, mean arterial pressure; MetS, metabolic syndrome; n.s., not significant; PA, physical activity; PP, pulse pressure; SBP, systolic blood pressure; SD, standard deviation; TG, triglycerides.
Partial correlations between variables of body composition, health dietary score index, CRF, PA, blood pressure, biochemical parameters, and MetS index controlling for age, sex, and Tanner stage are shown in Table 2.
Partial Correlation Coefficients Among Fat Mass Percentage (% Fat Mass), Health Dietary Score Index, Physical Activity, Cardiorespiratory Fitness (VO2 Max), Blood Pressure Variables, Blood Biochemical Determinations, and Metabolic Syndrome Index Controlling for Age, Sex, and Tanner Stage
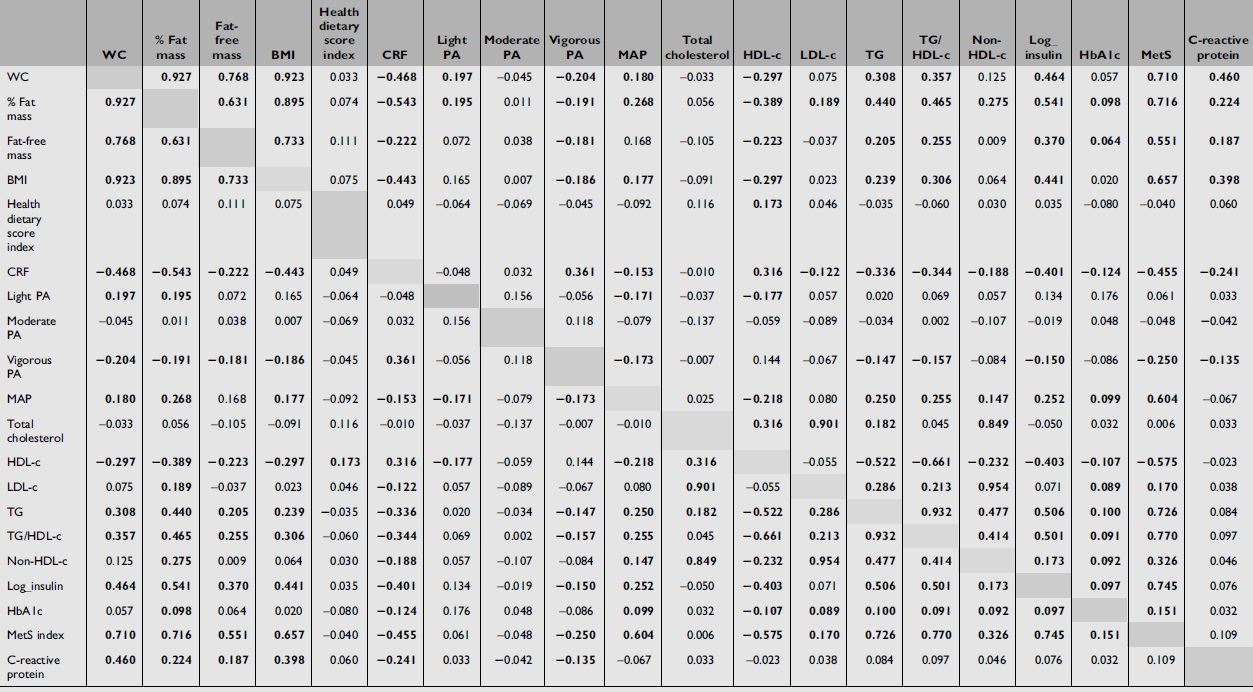
MetS index reported as the sum of the age-sex standardized scores of waist circumference, TG/HDL-c ratio, MAP, and fasting insulin. Bold mean statistical significance: p ≤ 0.05.
WC, waist circumference.
Cluster Analysis
Figure 1 shows the four-cluster categories: FU, UU, FF, and UF according to the mean of z-scores of VO2 max estimate and % fat mass.

Clustering of children using z-scores of adiposity (% fat mass) and cardiorespiratory fitness (VO2 max estimate) according to the Ward method.
Table 3 shows the mean difference results in cardiometabolic risk factors, health dietary score index and PA levels between the “fat but fit” categories. Analysis of variance (ANOVA) models showed the anticipated mean trends by clusters categories: an increasing trend (FU < UU < FF < UF) in terms of CRF (VO2 max estimate), and conversely, a significant decreasing trend in terms of adiposity (FU > FF > UU > UF).
Mean Differences in Body Composition, Physical Fitness, Blood Pressure Variables, Blood Biochemical Determinations and Metabolic Syndrome Index by Fat but Fit Categories
Values are means ± SD. Bold values indicate cluster statistical significance (p ≤ 0.05), using ANCOVA adjusted by age and Tanner total score.
Higher scores indicate a better quality of diet.
Estimated VO2 max.
Metabolic syndrome index reported as the sum of the age-sex standardized scores of waist circumference, TG/HDL-c ratio, MAP, and fasting insulin.
FF, “Fat but Fit”; FU, “Fat Unfit”; UF, “Unfat Fit”; UU, “Unfat Unfit.”
The health dietary score index did not show differences across the “fat but fit” categories.
For blood pressure parameter analyzed, only was statistically significant the pairwise comparison between FU and UF clusters categories for MAP parameter.
When PA was analyzed, differences by “fat but fit” categories were found only for vigorous PA, in which children with better CRF and normal weight (UF) showed a higher amount of vigorous PA than their partners with worse CRF levels and excess of fat mass (FU).
For biochemical determination, in both sexes, children with excess of % fat mass but high CRF (fat-fit phenotype) had better statistically significant values in HDL-c, LDL-c, TG, TG/HDL-c, non-HDL cholesterol, insulin, and in MetS index than their peers with high % fat mass and worse CRF (FU) but not in total cholesterol, C-reactive protein, and HbA1c.
The worst levels of HDL-c, TG, TG/HDL-c, insulin, and MetS index were found in overweight and unfit children (FU) compared with their physically fit partners (FF and UF).
Subgroup Analysis by Sex
Results by sex can be shown in the Supplementary Figure S1 and in Supplementary Table S1. Unfit girls showed worse TG, TG/HDL-c, non-HDL cholesterol, insulin, C-reactive protein, and MetS index levels than their fit partners, even more so when these girls had high % fat mass (FU vs. UU). IN addition, MetS index score was higher in those girls included in FU category than those in the FF category, regardless of them % fat mass.
In boys, pairwise comparisons showed the higher levels of TG, TG/HDL-c, insulin, and MetS index for the FU category when it was compared with FF, UF, and UF categories.
Discussion
This study supports the validity of the “fat but fit” paradigm and their relationship with cardiometabolic risk in children. First, the confirmation of the construct validity of “fat but fit” paradigm using statistical clustering techniques, classifying children according to their % fat mass and CRF and testing those children with high fat mass with higher CRF (fat-fit phenotype) showed better levels of HDL-c, TG, TG/HDL-c, insulin, and MetS index. Finally, regarding the PA-related behavior, we only observed significant differences in the mean daily time spent in vigorous PA by “fat but fit” category, but not in light or moderate PA, which might suggest that only vigorous PA would be able to influence on the probability to belong to either of the categories of the “fat but fit” paradigm.
The MetS is defined as a cluster of three or more metabolic disorders that pose a risk of cardiovascular diseases and type 2 diabetes mellitus, including abdominal obesity, elevated blood pressure, glucose tolerance, elevated TG levels, and low HDL-c levels. 36 Our results show that “fat but fit” children had better cardiometabolic profile and scored better in MetS index than those who have high % fat mass and low CRF (fat-unfit phenotype). Obesity is an important cardiovascular risk factor that tends to persist from childhood through adolescence into adulthood; something similar occurs with PA patterns and aerobic capacity.37,38
This could lead us to think that a child with obesity and low CRF could be a future fat and unfit adult. In addition, our results showed that unfit children with normal weight had worse values in some cardiometabolic risk factors such as TG and insulin in boys and MetS index in girls than children with normal weight and good CRF (UU vs. UF), highlighting the importance of having good CRF levels even at normal weight. Similar results were reported in a previous study concluding that good CRF levels attenuate the MetS index regardless of BMI categories (normal weight, overweight, and obesity). 39
Our data suggest that in children, vigorous is the only modality of PA that may influence the probability of belonging to the healthier “fat but fit” categories. It is well known that PA has the potential to improve the main cardiometabolic risk factors such as blood pressure, 40 waist circumference, 40 fasting insulin, 40 blood lipids, 41 and inflammatory markers 42 through several pathways; also, PA contributes to the control weight, and it influences the body composition (increasing the body lean mass 43 ) and improves the CRF.44,45 A pivotal review suggest that, 46 in 2010, in children and adolescent PA of at least a moderate intensity is the only modality to achieve valuable health benefits, but also suggested vigorous intensity may provide even greater benefits.
These results support the findings of several previous reviews suggesting that vigorous PA even bring more health benefits for youth than moderate-intensity activities.47,48 Nevertheless, most evidence on the health benefits of vigorous PA in children derived from cross-sectional studies, presenting a limitation due to the temporal relationship. In the last year, a review that prospectively analyzed the association between vigorous PA and health-related factors in children 49 confirmed that vigorous PA improved CRF levels and was negatively associated with adiposity and cardiometabolic risk in children and adolescents, showing that exercise interventions in these age groups should strengthen vigorous PA, but the optimal dose to achieve benefits was not provided.
This study has several limitations that should be considered to interpret the results. First, the cross-sectional design prevents us from to make causal inferences. Second, CRF was used to cluster the “fat but fit” categories, but other physical fitness components (muscular strength or speed/agility) could also influence the cardiometabolic risk variables. Third, other variable such as socioeconomic status or demographic variables that could affect the relationship between obesity, CRF, and cardiovascular risk factors were not included in the statistical models.
Fourth, it is important to bear in mind that the participants were healthy children and that the levels of the cardiometabolic risk factors studied were normal in most of them; nevertheless, children with excess % fat mass may have not yet developed metabolic disorders due to their young age, which does not exclude their likelihood to present with cardiometabolic disorders in the adolescence or adulthood.37,38 Finally in this study % fat mass was used to cluster “fat but fit” categories; however, we did not test other body fat distributions, such as visceral or subcutaneous fat mass.
Conclusions
Our study supports the “fat but fit” paradigm in some cardiometabolic risk factors such as HDL-c, TG, TG/HDL-c, insulin, and MetS index in children. In addition, our results highlight the importance to maintain a high CRF level through vigorous PA even at normal weight children to control the cardiometabolic risk factors.
Footnotes
Authors' Contributions
Dr Martínez-Vizcaíno and Dr Pozuelo-Carrascosa conceptualized and designed the study. Dr Martínez-Vizcaíno was the principal investigator and guarantor.
Dr Pozuelo-Carrascosa drafted the initial article with the support of Dr Garrido-Miguel and Dr Martínez-Vizcaino.
Dr Torres-Costoso, Dr Solera-Martínez and Mrs Rodríguez-Gutierrez designed the data collection instruments, collected data, carried out the initial analyses, and reviewed and revised the article.
All authors established the methods and questionnaires, provided comments on the drafts, and have read and approved the final version.
Acknowledgments
We thank all schools, families, and pupils for their enthusiastic participation in the study.
Funding Information
This study was funded by the Ministry of Economy and Competitiveness Carlos III Health Institute and FEDER funds (FIS PI19/01919). Additional funding was obtained from the Research Network on Preventative Activities and Health Promotion (RD12/0005/0009) to V.M.-V.
Author Disclosure Statement
No competing financial interests exist.

References
Supplementary Material
Please find the following supplemental material available below.
For Open Access articles published under a Creative Commons License, all supplemental material carries the same license as the article it is associated with.
For non-Open Access articles published, all supplemental material carries a non-exclusive license, and permission requests for re-use of supplemental material or any part of supplemental material shall be sent directly to the copyright owner as specified in the copyright notice associated with the article.
