




Abstract
Background:
Many parents and providers adopt a “wait and see” approach to obesity (OB) management. The goal of this study was to determine the likelihood that youth with overweight (OW) or OB would become normal weight over time.
Methods:
Data from the nationally representative Population Assessment of Tobacco and Health Study were used to examine the proportion of teens (aged 12–17 years) with OW/OB who tracked into a lower weight category over four waves of data collection (2013–2018). Analysis was restricted to those who completed all four waves of assessments (n = 10,086). Repeated-measures logistic regression models were used to describe the odds of having a BMI within the normal weight range at Waves 2–4, given an OW or obese weight status in the previous wave.
Results:
At Wave 1, 65% of the sample was normal weight, 18% had OW, and 17% had OB. By Wave 4, 24% had OW and 20% had OB. The adjusted odds of reporting a normal weight relative to OW/OB decreased by 13% each year. In Wave 4, only 2% [standard error (SE) 0.4%] of boys and 2% (SE 0.3%) of girls transitioned from OB to normal weight. For youth with OB in Wave 1, the probability of being in the normal weight category in Wave 2 was 0.04 (95% confidence interval 0.035–0.052), and decreased thereafter.
Conclusion:
Very few teens were able to return to normal weight once they developed OW/OB. Adopting a “wait and see” approach to OB management may be detrimental to a child's health.
Introduction
The prevalence of childhood overweight (OW)/obesity (OB) in the United States remains high and continues to rise among non-Hispanic Black and Hispanic youth,1–3 as well as the Asian/Pacific Islander and American Indian/Native Alaskan groups.4–6 There are several studies that demonstrate that excess weight gain during the physiologic nadir or by the time children are 5–6 years old greatly increases their risk of OW/OB as teenagers and adults.7–10 OB in adolescence is also highly correlated with OB in adulthood.11,12 A study of Canadian youth found that 83% who were OW by the end of adolescence continued to have OW as adults. 13 This is concerning because persistent OB from adolescence confers additional risk for coronary heart disease in adulthood14,15 and can have long-term effects on cardiovascular and metabolic health.16–18
Despite the continued high correlation between childhood, adolescent, and adult weight status, many parents and providers would like to adopt a “wait and see” approach to managing OB, hoping that the youth will “grow out of it.” However, it is unclear what proportion of children actually “grow out of their obesity” and adopt a healthy weight without active intervention. Primary care providers (PCPs) play an important role in identifying weight status as a health issue, arranging follow-up visits, conducting weight checks, monitoring progress, and keeping families engaged in a structured weight control program.19,20 Parents also value their PCP's role in identifying their child's weight status and providing weight management advice.21,22 These discussions can help correct weight status misclassification and promote proactive behaviors among parents.21,23 However, PCPs often report low confidence in their ability to counsel on this topic, as well as a lack of time and resources to provide more intensive treatment.24–26
The goal of this study was to determine the likelihood that youth with OW/OB develop normal weight over time. To do this, we tracked the natural progression in weight status among a nationally representative sample of US adolescents participating in the Population Assessment of Tobacco and Health (PATH Study). Specifically, we examined the proportion of healthy weight teens who tracked into a higher weight category, and the proportion of teens with OW and the proportion of teens with OB who tracked into a lower weight category over four waves of data collection.
Methods
Data Source
The PATH Study is a nationally representative longitudinal cohort study of tobacco use and health among youth in the United States conducted by the FDA Center for Tobacco Products and the NIH National Institute on Drug Abuse (NIDA). Public use data files were used from the PATH Study Youth Sample from Wave 1 (September 2013–December 2014), Wave 2 (October 2014–2015), Wave 3 (October 2015–2016), and Wave 4 (December 2016–January 2018).
The current study limited analyses to the Youth Survey Wave 1 Cohort (N = 13,651) who completed all four waves of assessment (n = 10,086). Among the Wave 1 Youth sample, aged 12–17 years, the weighted completion rates were 78.4%, 87.3%, 83.3%, and 79.5% for Waves 1–4, respectively. Population and replicate weights allow for population estimates that adjust for the study design and nonresponse to any of the survey waves. Informed parental consent and adolescent assent were obtained from all respondents. The original study was conducted by Westat and approved by the Westat Institutional Review Board. Further details regarding the PATH Study design and methods were previously published 27 and are in the User Guide to the PATH Study public use files. 28
Demographics
The Youth Interview was used to collect reports of age, sex, race, and ethnicity. The Parent/Guardian Interview was used to collect parental education level as a proxy for socioeconomic status. The highest level of education reported by the parent/guardian was categorized into two categories: “high school or less” and “some college or higher.” Race or ethnicity groups were classified first as “Hispanic,” irrespective of race, and among the remaining participants as “non-Hispanic White,” “non-Hispanic Black,” and “non-Hispanic Other.” Missing data on age, sex, race, ethnicity, and adult education were imputed as described in the User Guide to the PATH Study PUF. 28 Percent of values imputed ranged from <0.01% for age to 1.3% for race.
Body Mass Index
Parent Interviews collected parent report of the current youth height and weight at each wave. Parents are asked: “About how tall is [Child's first name] without shoes, please answer in either feet and inches or meters,” and “about how much does [Child's first name] weigh without clothes or shoes?” Westat included a derived value of BMI using the child's weight in kilograms divided by the square of height in meters. Interview tools included range checks on the height and weight variables to prevent improbable values from being recorded. BMI calculations were not permitted in the presence of improbable responses to one or more component variables.
Percentile scores for BMI were computed using the Centers for Disease Control 2000 Growth Charts 29 with “childsds” package 30 in R statistical software. 31 Children in the “normal weight” category had a BMI ≥5th percentile to <85th percentile for age and sex. Children with “overweight” had a BMI ≥85th percentile to <95th percentile, and those with “obesity” had a BMI ≥95th percentile. Youth aging into the Adult Survey, self-reported “About how tall are you without shoes” and “about how much do you weigh without clothes or shoes?” Self-reported height and weight were used to calculate BMI, and those with values ≤24.9, 25.0–29.9, and ≥30.0 were classified as having normal weight, OW, or OB, respectively.
Statistical Analysis Plan
All analyses were performed using R statistical software. 31 All estimates were weighted using the “survey” package. 32 Variance estimates and p-values were calculated using the recommended Balanced Repeated Replication method with Fay's adjustment and replicate weights supplied by Westat. Population and replicate weights were created that adjusted for the complex study design characteristics and nonresponse at subsequent waves. A repeated-measures logistic regression model was used in Model A to describe the associations (log odds) of planned covariates (fixed effects) for age, sex, race/ethnicity, parental education, and US region with having a BMI classified within the normal weight range (Waves 2–4). Model B included a time-varying fixed effect to reflect the association (log odds) between participants' weight status (OW/OB) at each previous wave of assessment and being in the normal weight range at the next assessment.
Model C then tested if the association between a participant's previous weight status and subsequent weight status (lagged time-varying predictor relationship) changed over the three waves to determine if the effect strengthened or weakened over time. Adjusted probabilities of being in the normal weight range, given that the covariates were predicted from the repeated-measures logistic regression model using the “effects” package.33,34
Results
Weight Status for Wave 1 Youth Aged 12–17
Table 1 gives the weight status for youth by their age group (12–14 years; 15–17 years), sex, reported race/ethnicity, parental education, and US region. Slightly higher rates of OW/OB were observed for males compared with female youth and for youth aged 12–14 years relative to older youth aged 15–17 years. Larger differences in prevalence of OW/OB were observed across racial/ethnic groups with non-Hispanic Black and Hispanic youth having higher rates than non-Hispanic White youth. A significantly higher prevalence was also observed among youth in families with lower parental education and residing in the South region of the United States.
Demographic Characteristics of Participants in the Population Assessment of Tobacco and Health Study, Wave 1 by Weight Status
All percentages are weighted.
SE, standard error.
Change in Weight Status Over Time
Figure 1 shows the US weighted prevalence of youth in the normal weight, OW, and OB categories at each wave. The weighted prevalence of youth transitioning between weight categories is depicted by the width of the lines connecting the weight categories across different waves of assessment. The widest lines correspond to youth who remain in the normal weight category across each wave. Normal weight youth represented 65% (standard error [SE] 0.5%) of the sample at Wave 1, decreased to 62% (SE 0.5%) at Wave 2, 58% (SE 0.6%) at Wave 3, and 56% (SE 0.6%) at Wave 4. Youth with OW represented 18% (SE 0.4%), 19% (SE 0.4%), 22% (SE 0.5%), and 24% (SE 0.5%) of the sample at Waves 1–4, respectively. Youth in the obese category represented 17% (SE 0.4%), 18% (SE 0.4%), 21% (SE 0.5%), and 20% (SE 0.5%) of the sample at similar time points.

Since trends in weight status can vary by sex, the percentage of youth transitioning across weight categories is presented by sex in Table 2.4,35,36 By Wave 2, 12% (SE 0.6%) of boys and 10% (SE 0.6%) of girls with normal weight in Wave 1 developed OW, while 2% (SE 0.3%) of boys and girls each developed OB. Among children with OW in Wave 1, 25% (SE 1.7%) of boys and 25% (SE 1.7%) of girls became normal weight in Wave 2, while 22% (SE 1.5%) of boys and 23% (SE 1.5%) of girls developed OB. Only 4% (SE 0.8%) of boys and 5% (SE 0.8%) of girls with OB became normal weight in Wave 2. By Wave 4, only 2% (SE 0.4%) of boys and 2% (SE 0.3%) of girls with OB transitioned to the normal weight category.
Weighted BMI Estimates and Standard Errors at Each Transition Period for Males and Females
All estimates of percentages are weighted. All n's reflect unweighted number of observations.
OB, obesity; OW, overweight.
In a repeated-measures logistic regression model with adjustment for planned covariates (Table 3), the odds of being in the normal weight category decreased significantly from Waves 1 to 4 [F(1,98) = 203.98, p < 0.001]. The adjusted odds of reporting a normal weight relative to OW/OB decreased by 13% each year [OR = 0.87, 95% confidence interval (CI) 0.86–0.89] (Model A). Having OW/OB during a previous wave (Model B) was significantly associated with decreased odds of being in the normal weight category [F(2,87) = 2472.011, p < 0.001].
Change in Odds of Having Normal Weight Relative to Overweight or Obesity Considering Previous Weight Status and Effects Over Time
All estimates reflect change in log of odds of being in the normal weight category. Lower (L95th%) and upper (U95th%) limits of 95% confidence intervals are presented for each estimate. The “—” indicates the reference group used in model comparisons. Model A includes all planned covariates and estimates of the odds of being in the normal weight category over the waves of assessment. Model B adds the effect of previous weight class as a predictor of the odds of being in the normal weight category. Model C adds an interaction term to reflect the change in relationship between weight at a previous wave and odds of being in the normal weight category at each wave.
To determine if the relationship between previous weight status and subsequent weight status changed over three waves, we used a likelihood ratio test of models with and without an interaction term (previous OW/OB by wave). Results suggested that the odds of being in the normal weight category for those with OW/OB during the previous wave were stronger and negatively associated in the later than earlier waves [F(4,85) = 387.6, p < 0.001] (Model C).
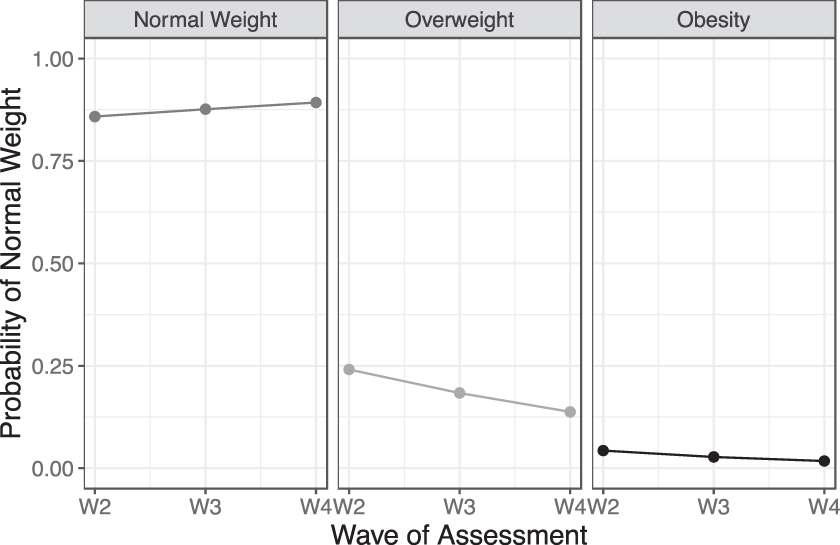
Figure 2 displays the results of Model C. In the first panel, there was a higher probability of being normal weight if youth were normal weight during the previous wave. This effect strengthens slightly over time. In contrast, among youth with OW, the probability of reporting the subsequent normal weight status was significantly reduced and decreases further with each wave. The probability of being in a normal weight category at Wave 2 for youth who had OW at Wave 1 was 0.24 (95% CI 0.22–0.26). This effect was amplified in youth with OB in the previous wave. The probability of being in a normal weight category at Wave 2 for youth who had OB at Wave 1 was 0.04 (95% CI 0.035–0.052).
Discussion
While some youth with OW developed normal weight over time, this proportion was small and decreased over time; among boys with OW, 25% developed normal weight in Wave 2, 20% in Wave 3, and 15% in Wave 4. The probability that this happened for a child who had OB in adolescence was even smaller; among boys with OB, 4%, 3%, and 2% developed normal weight in Waves 2, 3, and 4, respectively. In conjunction with this pattern, a steady proportion of youth with normal weight increased in weight status during adolescence and into young adulthood. At the beginning of the study period, 35% of the sample had OW/OB, but at the end of the 4 years, 44% had OW/OB.
While several studies have demonstrated the high correlation between childhood or adolescent OB and adult OB,7–12 few have demonstrated how youth move between weight status categories over time. Furthermore, the probability of becoming normal weight after one has developed OW/OB has not been highlighted. The results of this study demonstrate the steady progression toward OB that occurs among youth in the United States, and that very few teens were able to return to a normal weight status once they had developed OB.
The results of this study underscore the importance of identifying weight status during pediatric well-child visits and engaging families in healthy eating and physical activity behaviors early in life. Unfortunately, one study demonstrated that the majority of parents (>75%) with a child with OW/OB did not remember being told what their child's weight status was. 37 If parents are unaware of their child's weight status, they will have little impetus to make a change in their dietary or physical activity behaviors. Other studies have demonstrated that parents who recognize their child's weight status are more likely to be ready to make weight-related behavior changes 38 and make those changes more effectively. 39 Unfortunately, providers report a lack of confidence to engage in these conversations because of the potential psychological impact associated with weight stigma and fear of offending the family. 26
However, focus groups with parents revealed that parents were open to the term “unhealthy weight” when having these conversations, and that terms such as “unhealthy weight” or “weight problem” were rated as the most effective at motivating parents to start engaging in lifestyle behavior changes to lose weight. 40
In addition to identifying a child's weight status, PCPs have been called upon to discuss healthy lifestyle changes for the child and refer the family to an appropriate weight control program. 41 When referring to treatment, many parents prefer a multidisciplinary team to monitor their children's health. 42 This team would include professionals from other health- and education-related fields, such as dietitians, nurses, physical education teachers, psychologists, kinesiologists, and social workers. However, they expect the physician or pediatrician to diagnose OW, explain test results to parents, and refer families to resources. This dynamic may be particularly important for Latino families.
Systematic reviews of effective OB treatment for Latinos demonstrate that interventions in the primary care setting may have more of an effect3,43,44 than in other settings (e.g., community-based 45 or school-based interventions46,47). This may be because of the involvement of the health care provider. Latina mothers highly respect health care providers' opinions. 21 Therefore, any discussions with the PCP may help raise awareness of the issues and motivate parents to take action.
These findings also suggest that more programs or treatment options need to be created and implemented for teenagers, especially since it is unlikely that they will be able to transition to a normal weight status on their own. Unfortunately, studies targeting this age group are not as common as studies for younger children. Treatment programs for all ages focus on dietary and physical activity changes, however, adolescent treatment programs also include more severe options such as the use of medication or bariatric surgery. 48 Addressing OB earlier in childhood may prevent the need for these measures. It should be noted that up to 25% of children were able to move from the OW category to the normal weight category, particularly in the first year of the assessment period. Unfortunately, fewer children in the OB category were able to make this transition.
This finding suggests that changes in weight status may be easier when children are younger and not as heavy. Therefore, educating children and parents on healthy lifestyle behaviors when they are young and have not yet developed OB may have more of an impact on preventing long-term health consequences.
Given the large public health impact of OB, it is important to focus on early intervention and prevention programs. It is increasingly recognized that interventions within the first 2 years of life are important to change the growth trajectory of infants. 49 It is also important to address excess gestational weight gain during pregnancy and maternal prenatal weight status to prevent the intergenerational transmission of OB. Addressing OB in female adolescents and young adults could have a significant impact on breaking this cycle.49,50 As such, it is important for teens to learn preventive health behaviors as they transition to adulthood and become responsible for their own health and dietary/physical activity behaviors. Addressing these topics across the age spectrum will be important if we are to break this cycle and prevent the development of OB.
Limitations
While this analysis presented a novel method of tracking weight status among children over time, there were a few limitations. Objective height and weight data were not obtained in this national observational study, and parent- or self-report of child anthropometrics was used for analysis. Nevertheless, studies in adults have shown that self-reported weights can be highly correlated with objective weight measurements 51 and possibly slightly lower than the actual weight measurements. 52 Unfortunately, similar data in children are not available. Nevertheless, given this information, we may be underreporting the proportion of children who have OW/OB. We also do not know whether some teens in this study participated in weight control programs. Thus, we were unable to determine whether teens who moved from the OW/OB category into the normal weight category were able to do so on their own or because they joined a weight control program.
Conclusion
While 25% of teens with OW developed normal weight between Waves 1 and 2, the probability of this happening decreased over time. For youth with OB, the probability of developing normal weight was significantly lower (≤5%). In addition, a steady proportion of teens with normal weight (10%–13%) and OW (22%–23%) increased in weight status as they aged. This combination of increasing numbers of children developing OB as they age and the low likelihood of children with OW/OB transitioning to normal weight results in OB being a persistent public health issue. Efforts to help teens with OW/OB manage their weight or prevent them from gaining excess weight are needed to prevent future health consequences and the continued strain on the health care system.
Footnotes
Authors' Contributions
Dr. Rhee conceptualized the study, participated in the analysis and interpretation of the data, and drafted the original article. Dr. Strong participated in the conceptualization of the study, acquired the data, conducted the analysis, interpreted the data, and provided critical review of the article. Both authors approved the final article as submitted and agree to be accountable for all aspects of the work.
Impact Statement
Children with obesity (OB) typically continue to have OB into adulthood. Many caretakers opt to “wait and see” before engaging in treatment. We found that teens with OB had a 4% probability of becoming normal weight as they age. Earlier OB management and prevention efforts are needed to mitigate this trend.
Funding Information
No funding was received for this article.
Author Disclosure Statement
No competing financial interests exist.