
Abstract
Background:
Quality Rating and Improvement Systems (QRISs) are used to assess, improve, and communicate quality in early care and education (ECE) programs. One strategy for supporting healthy growth in early childhood is embedding nutrition, physical activity, infant feeding, and screen time content into state QRIS standards, using the Caring for Our Children high-impact obesity prevention standards (HIOPS) and the CDC Spectrum of Opportunities framework (CDC Spectrum). We assessed the number of obesity prevention standards in QRISs in 2020 and compared results to an analysis published in 2015.
Methods:
We collected state QRIS standards for ECE centers from March to April 2020. Two analysts coded documents for standards related to 47 HIOPS and 6 Spectrum areas.
Results:
Thirty-nine states and the District of Columbia had statewide QRISs in early 2020. Of these, 21 QRISs (53%) embedded 1 or more HIOPS, and 26 (65%) embedded 1 or more Spectrum components. On average, 6.9% of HIOPS were embedded in QRIS standards in 2020, an increase from 4.6% in 2015. Nine QRISs included more HIOPS in 2020 than in 2015. Five QRISs added 10% or more of the 47 HIOPS between 2015 and 2020. Physical activity and screen time standards continued to be most often included; infant feeding standards were least included.
Conclusion:
Obesity prevention components were embedded in three-quarters of state QRISs, and more were embedded in 2020 than in 2015, suggesting that QRISs can be levers for supporting healthy weight in ECE settings.
Background
Nearly 14% of children 2 to 5 years of age in the United States have obesity. 1 Excess weight in childhood and adolescence is associated with health conditions, such as type 2 diabetes, high blood pressure, and liver disease, as well as increased rates of obesity later in life. 2 Young children who are overweight in kindergarten are four times more likely to have obesity by eighth grade than kindergarteners who are not overweight. 3 If current trends continue, by 2050, 57.3% of today's children and adolescents are projected to have obesity by age 35. 4 Relatively small population-level reductions in BMI among children 2–5 years of age could result in significant health-adjusted life year and health care cost savings. 5
Of the roughly 21.2 million children birth through age 5 and not yet in kindergarten, 12.5 million, or 59%, are in early care and education (ECE) programs outside their home at least once a week, with center-based care the most common. 6 Many young children spend a significant amount of time in ECE programs, with infants and toddlers who attend ECE centers spending an average of 32 hours per week at the center. 7 ECE can thus be a key setting for supporting healthy weight and growth through nutrition, physical activity, screen time limits, and breastfeeding practices.8,9 Studies have demonstrated significant impacts of interventions to promote healthy weight in the ECE setting.9–11
For over a decade, the CDC has provided funding and technical assistance for states and communities to support policy, systems, and environment approaches to healthy weight in ECE settings.12,13 The CDC's Spectrum of Opportunities for Obesity Prevention in the ECE Setting (Spectrum) framework describes nine areas for supporting healthy weight in state ECE systems.8,9,13 One of these areas is QRISs, which are state-level systems used to assess, improve, and communicate the level of quality in ECE programs, often by awarding designation levels to ECE programs for meeting standards of quality care across several domains.14,15 States vary in the requirements and structure of their QRIS, 16 as well as in level of participation, 15 with an estimated one-third of ECE centers in the United States participating in a QRIS. 17 States review and update their QRISs regularly, with an increased focus in the past 5 years on equity and coaching.18–21
Participating in QRIS has been linked to stronger nutrition and physical activity policies and practices.22,23 For example, participating in Minnesota Parent AWARE QRIS was positively associated with adherence to nutrition practices and some physical activity practices. 22 Similarly, compared with ECE centers not participating in QRIS, QRIS-certified ECE centers in Texas reported more policies for physical activity and screen time and higher frequencies of some physical activity and outdoor practices such as vegetable gardens. 23
In 2017, the CDC published an analysis of QRIS obesity prevention standards based on 2015 state-level data. 24 Many states have updated their QRISs since 2015, 15 and thus, the objectives of this review were to assess the number of obesity prevention standards embedded in state QRIS center-based standards in 2020, and to compare changes between 2015 and 2020.
Methods
Data Source
We extracted information about each state's QRIS from the publicly available Quality Compendium database (Compendium), 15 which contains information on all QRISs in the United States. During a 3-week period from March 24 to April 13 of 2020, we systematically reviewed all 2019 state Compendium profiles to gather pertinent information about each QRIS system and collect PDF versions of each QRIS's standard documents and program guides from the links provided. States submitted their website links to the Compendium in 2019, but QRIS websites were able to be updated after the links were submitted, so the links offered accurate snapshots of 2020 standards. We only gathered standards for center-based programs, the most widely used care type in the United States. 6
Study Population
Of the 50 states and the District of Columbia (D.C.), 39 states and D.C. had an operating statewide QRIS in 2020 and are included in this analysis (n = 40), compared with 38 states with operating QRIS in 2015. In 2020, the remaining 11 states either did not have a QRIS or had a QRIS in the developmental/pilot phase (CT, HI, KS, MS, MO, SD, WV, WY); did not have a full profile in the Compendium (AL); or had QRISs that operate at the local/regional rather than state level (FL, CA).
Codebook: High-Impact Obesity Prevention Standards
Because a primary objective of this study was to identify changes in the number and type of obesity prevention standards included in QRISs between 2015 and 2020, we used the previous analysis's codebook. 24 We first coded for 47 High-Impact Obesity Prevention Standards (HIOPS), which are a subset of standards from Caring for Our Children's special collection, Preventing Childhood Obesity. 25 The HIOPS are well established and have been used for other topics such as state licensing.25,26 They cover four domains: infant feeding (n = 11), nutrition (n = 21), physical activity (n = 11), and screen time (n = 4). Full definitions of all 47 HIOPS can be found in Caring for Our Children. 25
Codebook: Spectrum of Opportunities Components
We reviewed each state's document(s) for six codes related to the Spectrum. 13 We retained four codes from the 2015 study: use of (1) facility-level self-assessments and/or interventions, (2) professional development trainings, and (3) technical assistance activities related to nutrition, physical activity, screen time, breastfeeding, or obesity prevention, as well as (4) connections to the Child and Adult Care Food Program (CACFP). We opted not to include two codes from the 2015 study, family engagement, and facility-level action planning, because the Spectrum, which has been updated since the previous study, does not include these areas as systems-level opportunities. We also did not include three Spectrum areas whose obesity prevention content would be difficult to count in QRIS standards: licensing, early learning standards, and funding streams. We instead introduced two new codes that are part of the Spectrum to reflect initiatives with momentum in ECE: (5) standards related to Farm to ECE activities, such as gardens or procurement of local foods27,28; and (6) recognition programs related to nutrition, physical activity, screen time, breastfeeding, or obesity prevention.
We therefore compare the number of Spectrum codes in 2015 to the number in 2020 only for the four codes used in both studies. We discuss Farm to ECE and recognition program results, but not as part of the comparison group. Hereafter, we refer to these six codes as “Spectrum components.”
Coding and Analysis
Two analysts independently coded each state's QRIS standard document(s) to determine if obesity prevention standards matching the HIOPS or Spectrum component definitions were included. Standards were coded if their language either fully or partially aligned with the criteria in the codebook, and analysts met regularly to reconcile their codes. Once all documents were coded, both analysts independently reviewed the entire coded dataset, recoded as needed, reconciled final differences, and created summary tables. Before reconciling differences, an inter-rater reliability statistic was calculated by dividing the number of agreed-upon final standards by the total number of standards identified by both analysts, to represent the strength of agreement.
Results
Of the 39 states and D.C. with QRISs in 2020, 29 had updated their QRIS documents since the 2015 analysis (Table 1). Of these 40 QRISs, 21 systems (53%) included at least 1 standard that aligned with a HIOPS, and 26 (65%) included standards that aligned with 1 or more of the 6 Spectrum components. Comparison of the analysts' results yielded an inter-rater reliability statistic of 94.4%.
Summary of State Center-Based Quality Rating and Improvement System Standards' Alignment With High-Impact Obesity Prevention Standards/Spectrum of Opportunities Components, 2015 and 2020
“—” indicates that this state QRIS did not exist or was in pilot phase in 2015 and so was not included in the 2015 sample.
Note that the set of Spectrum components partially changed between the 2015 and 2020 data collection. Of the six Spectrum components in the 2015 study, two were removed, and two additional components were added. The tallies in these columns compare only the four Spectrum components included in both 2015 and 2020: CACFP, facility-level assessment tools and/or interventions, professional development, and technical assistance.
This QRIS met one of the new Spectrum components (recognition programs or Farm to ECE), which is not included in this total.
This 2015 total differs from the Geary et al results table. 24 It was updated based on an additional single-coder review of the 2015 QRIS standards documents performed in 2020.
CACFP, Child and Adult Care Food Program; ECE, early care and education; HIOPS High-Impact, Obesity Prevention Standards; QRIS, Quality Rating and Improvement System.
HIOPS Components
On average, states embedded an average of 6.9% of HIOPS in center-based QRIS standards in 2020, an increase from an average of 4.6% of the 47 HIOPS in 2015 (Tables 2 and 3). Twenty-one states' QRIS standards included at least 1 standard that aligned with a HIOPS, compared with 19 states in 2015. Figure 1 shows the 18 states and D.C. whose QRISs contain no HIOPS, the 15 states with 1–9 HIOPS, the 5 states with 10–19 HIOPS, and the 1 state (South Carolina) whose QRIS contains 20 or more HIOPS.

State Quality Rating and Improvement Systems That Align With High-Impact Obesity Prevention Standards, by Standard, 2015 and 2020
This 2015 total differs from the Geary et al results table. 24 It was updated based on an additional single-coder review of the 2015 QRIS standards documents performed in 2020.
Average Number and Percentage of High-Impact Obesity Prevention Standards Included in State Quality Rating and Improvement Systems, by High-Impact Obesity Prevention Standards Category, 2020
In 2015, for comparison, state QRISs contained an average of 2.18 HIOPS, or 4.6%. These averages were calculated from the 2015 state HIOPS inclusion data published by Geary et al 24 , with data updated based on an additional single-coder review of the 2015 QRIS standards documents performed in 2020.
Nine QRISs that were in operation in both 2015 and 2020 included a greater number of HIOPS in their 2020 standards than in 2015 (Fig. 2). Among these, two states had a greater than 30% point increase in the number of HIOPS included in their QRISs from 2015 to 2020: North Dakota progressed from 1 (2% of HIOPS) to 18 (38%), while Texas progressed from 4 (9%) to 19 (40%).
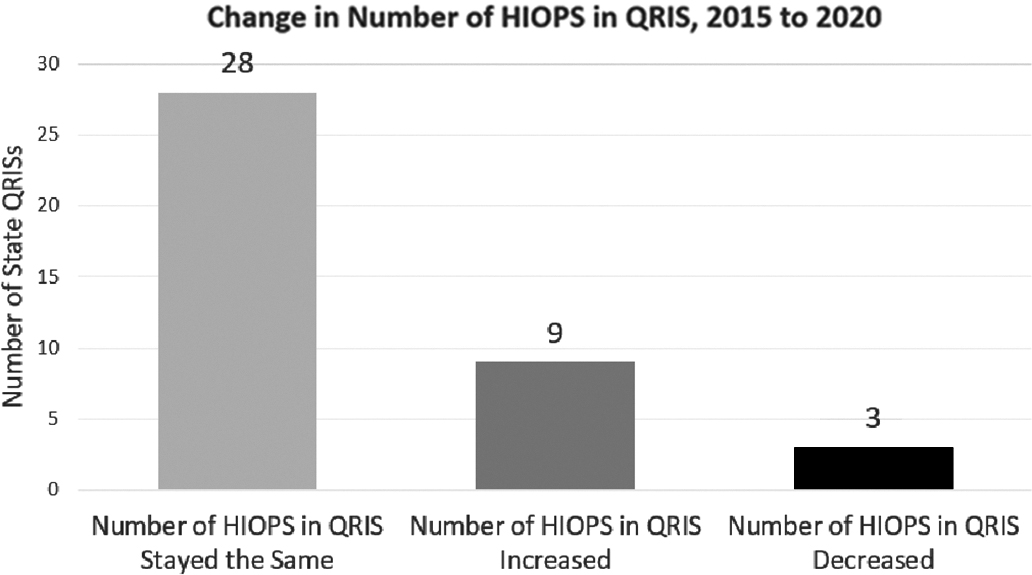
Conversely, 3 QRISs decreased the number of HIOPS in their QRIS standards in 2020 compared with 2015: Utah, from 10 to 0; Montana, from 3 to 1; and Oklahoma, from 3 to 2.
Thirty-two of the 47 HIOPS standards (68.1%) were incorporated in more states' QRISs in 2020 than in 2015, while there was only a net decrease in the number of states using 3 of the HIOPS (NH1, PA4, PB1) (Table 2). Consistent with 2015 results, physical activity, and screen time standards were most often included, with an average of 11.1% of physical activity standards and 10.6% of screen time standards included in each state QRIS (Table 3). These were followed by nutrition standards, with QRISs, including 6.0% of nutrition standards on average. Infant feeding standards were least frequently included, with an average of just 3.2% included in each QRIS.
The HIOPS most commonly incorporated in QRIS standards were in the physical activity category: PA1: space for play (included in n = 10 QRISs), PD1: caregiver-led physical activity (n = 9), PC1: outdoor play (n = 8), and PC3: preschool physical activity (n = 6). Additionally, among the infant feeding HIOPS, IA1: breastfeeding support (n = 6) saw the most uptake. Conversely, five of the HIOPS related to infant feeding and nutrition were included in zero states' QRIS standards.
Spectrum Components
Of the Spectrum components included in both the 2015 analysis and our analysis, 26 states' QRISs included at least 1 standard that aligned with 1 of the 4 Spectrum components, compared with 2015, when 19 included at least 1 of these 4 components (Table 1). The most common of these 4 Spectrum components in 2020 was connections to CACFP, with 15 states including CACFP-related standards in 2020, compared with 12 in 2015 (Table 4). The next most common Spectrum component included in states' QRIS standards was facility-level assessment tools and/or interventions related to obesity prevention (13 states in 2020, 6 in 2015), followed by professional development (8 states in 2020, 10 in 2015) and technical assistance (7 states in 2020, 6 in 2015) related to healthy weight. Within each Spectrum component, there was fluctuation, with states that had previously met the component no longer meeting it and vice versa. Overall, of the four Spectrum components included in the 2015 data, all but one (professional development) saw increases in the number of states, including the component in their center QRIS standards between 2015 and 2020.
State Quality Rating and Improvement Systems That Align With Spectrum of Opportunity Components, by Component, 2015 and 2020
Additionally, for the two new Spectrum components in the 2020 study, four states incorporated recognition programs related to obesity prevention in their state QRIS: Arizona (Empower Program), Georgia (SHAPE Award), Tennessee (Gold Sneaker Certification), and Utah (TOP Star, Healthier CACFP, Nature Explore Outdoor Classroom). Just two states—Colorado and Pennsylvania—incorporated Farm to ECE content into their QRIS standards.
Discussion
The number of obesity prevention standards included in state QRIS center-based standards increased slightly overall from 2015 to 2020, with three-quarters of the 40 statewide QRISs in 2020, now including both a Spectrum and HIOPS component (17 QRISs), at least 1 HIOPS (4 QRISs), or at least 1 Spectrum component (9 QRISs). Furthermore, two additional states had QRISs in 2020, translating to greater population reach of QRISs. The increases in both HIOPS and the common Spectrum components that we observed support the feasibility of including obesity prevention content in QRISs. However, the average proportion of HIOPS included is still relatively small, and some states removed HIOPS between 2015 and 2020, so there remain opportunities for inclusion of additional HIOPS in many states.
The overall increase in obesity prevention content was driven largely by updates in several states, with North Dakota, Texas, Idaho, South Carolina, and Oregon having the greatest HIOPS increases. Additionally, over half of states include one or more standards that align with the HIOPS in their center QRIS standards, with physical activity and screen time standards the most common, and nearly one-quarter of states increased the number of HIOPS included in their standards between 2015 and 2020. These findings demonstrate the acceptability of including healthy weight content in QRIS. However, infant feeding standards (other than IA1: breastfeeding support) are still rarely included. Interestingly, this finding is not mirrored in trends in state licensing regulations, where infant feeding and nutrition standards tend to be most often included, while physical activity and screen time tend to be least supported. 26 Possibly, this discrepancy is due to states with more licensing regulations focused on one topic, such as infant feeding, not repeating these standards in their QRISs, and vice versa.
Nevertheless, nutrition practices in the first 2 years of life are vital for supporting growth and development.29,30 Incorporating the 47 HIOPS, including standards around infant feeding, when updating state QRIS standards is one strategy for supporting nutrition and healthy growth.
Twenty-six states included at least one of the four common Spectrum components in their state QRIS standards, with all but one of these four Spectrum components seeing an increase in the number of states incorporating that component between 2015 and 2020. In recent years, several QRISs have moved away from point-based scoring models to more holistic, strength-based quality improvement cycles that allow programs to demonstrate their strengths through a variety of methods and observation opportunities. 15 Many QRISs have made connections to other ECE agencies in their state, such as by awarding points for professional development credit hours or technical assistance related to obesity prevention. Among the two new Spectrum components, four states—Arizona, Georgia, Tennessee, and Utah—featured healthy weight recognition programs. We coded these programs for “recognition program” only, but their content aligned with several HIOPS and Spectrum components. For example, there are 24 HIOPS/Spectrum components included in the Arizona Empower Program.
Similarly, 15 states included connections to CACFP, such as requiring all QRIS-participating ECE programs to follow CACFP meal patterns regardless of CACFP eligibility. While CACFP connections were only coded for the Spectrum area, to avoid double counting, following the CACFP meal pattern fully meets 13 infant feeding and nutrition HIOPS. Therefore, embedding obesity prevention recognition programs and CACFP meal patterns into QRIS can be powerful strategies for increasing healthy weight content in QRIS. Finally, Colorado and Pennsylvania were the only states with Farm to ECE content in their QRIS in 2020. As Farm to ECE efforts continue to grow around the United States, 28 states might consider incorporating Farm to ECE content in QRIS.
QRIS standards can act as an important policy lever for supporting healthy growth in ECE, as demonstrated by findings that QRIS-certified ECE centers in Texas reported more policies and practices related to physical activity, screen time, and outdoor time than noncertified centers. 23 As QRISs continue to evolve, state agencies can also consider the equity implications of QRIS. 17 Since 2015, many states have conducted equity reviews of their QRISs, and restructured their QRISs to focus on improvement, rather than point-based rating, as a result.15,18,20 The connections to CACFP observed in this review, with 15 QRISs, including CACFP-related content, are one avenue for supporting equity, as CACFP participation provides reimbursements for nutritious meals and snacks to eligible children and ECE programs and has been associated with improved nutrition practices, the provision of healthier meals, and even improved physical activity practices.22,31,32
Strengths and Limitations
This study had three strengths. First, it includes all publicly available 2020 state center QRIS standards, which affect a large number of US children 0–5 years of age. Second, the codebook is built around the expert-backed Caring for Our Children standards and Spectrum of Opportunities framework.9,25,26 Third, we used two independent analysts and a rigorous reconciliation process with high inter-rater reliability.
This study also had five limitations. First, because we chose to review only state center standards, this analysis cannot provide information on local/regional QRIS or on standards for family child care homes. Second, while the Compendium data collection process is thorough, the publicly available, state-reported QRIS materials it includes may contain some standard documents that were unavailable or slightly out of date. Third, between this study and the Geary et al 24 study, family engagement and facility-level action planning codes were removed, and recognition program and Farm to ECE codes were added. We could, therefore, only compare the number of Spectrum components included in state QRIS standards in 2015 and in 2020 for the four Spectrum components included in both studies. Fourth, state ECE licensing regulations were not factored into this review, even when licensing regulations were used as the basis of the first level of the quality rating designation for the state. 14 Thus, states may have found it unnecessary to include standards in QRIS if they were already part of licensing regulations.
Reviewing the alignment of a state's licensing regulations with obesity prevention standards25,26 in conjunction with the findings of this QRIS review will provide a more complete picture of how well the state's ECE system supports obesity prevention, and illustrate how licensing and QRIS can act as complementary, layered policy levers. Fifth, this study was an analysis of QRIS standards only, and did not review other contextual items such as coaching topics or continuous quality improvement (CQI) frameworks that are often part of QRIS and becoming increasingly common. 15 Future analyses might consider how strength-based approaches, CQI, and technical assistance in state QRIS can support healthy growth.
Conclusion
These results demonstrate how states have continued to embed healthy weight content into state QRIS standards. In states with high rates of QRIS participation, these standards can positively impact large numbers of children during the many hours per week those children spend in care. Embedding HIOPS and Spectrum components into QRISs is a strategy decisionmakers can consider to support healthy growth, nutrition, and physical activity in ECE programs in their state.
Impact Statement
Quality Rating and Improvement Systems (QRISs) assess, improve, and communicate quality in early care and education (ECE) programs. The inclusion of healthy weight standards in three-quarters of state QRISs, and the increase in inclusion 2015–2020, suggest that QRISs continue to be viable levers for supporting healthy weight in ECE settings.
Footnotes
Authors' Contributions
K.H.: conceptualization, data curation, investigation, formal analysis, writing—original draft, reviewing, and editing. N.G.: conceptualization, methodology, investigation, and formal analysis. A.L.W.: methodology, and writing—review and editing. C.D.: conceptualization, methodology, supervision, and writing—review and editing.
Disclaimer
The findings and conclusions in this report are those of the authors and do not necessarily represent the official position of the Centers for Disease Control and Prevention.
Funding Information
No funding was received for this article.
Author Disclosure Statement
No competing financial interests exist.