




Abstract
Introduction:
Dietary quality is poor and intake of ultraprocessed foods (UPFs) is high among children and adolescents in the United States. Low dietary quality and high UPF intake are associated with obesity and higher risk of diet-related chronic diseases. It is unknown whether household cooking behavior is related to improved dietary quality and lower consumption of UPFs among US children and adolescents.
Methods:
Nationally representative data from the 2007–2010 National Health and Nutrition Examination Survey (n = 6032 children and adolescents ≤19 years of age) were used to examine the relationships between household cooking frequency of evening meals and children's dietary quality and UPF intake using multivariate linear regression models adjusted for sociodemographics. Two 24-hour diet recalls were used to assess UPF intake and dietary quality [Healthy Eating Index-2015 (HEI-2015)]. Food items were categorized according to Nova classification to obtain the UPF percent of total energy intake.
Results:
A higher household frequency of cooking dinner was associated with lower UPF intake and higher overall dietary quality. Compared to children in households cooking dinner 0–2 times per week, children in households cooking dinner 7 times/week had lower intake of UPFs [β = −6.30, 95% confidence interval (CI) −8.81 to −3.78, p < 0.001] and marginally higher HEI-2015 scores (β = 1.92, 95% CI −0.04 to 3.87, p = 0.054). The trends toward lower UPF intake (p-trend <0.001) and higher HEI-2015 scores (p-trend = 0.001) with increasing cooking frequency were significant.
Conclusions:
In this nationally representative sample of children and adolescents, more frequent cooking at home was associated with lower intake of UPFs and higher HEI-2015 scores.
Introduction
Dietary quality among children and adolescents in the United States is poor, 1 with significant disparities among lower-income, Black, and Hispanic youth. 1 Poor dietary quality is associated with an increased risk of overweight and obesity among children, 2 which increases long-term risk of diet-related chronic diseases and all-cause mortality.3–5 In addition, dietary intake during childhood is predictive of dietary intake in adulthood, 6 further underscoring the importance of addressing poor dietary quality among children.
There is growing interest in home cooking as a means to improve dietary quality.7,8 Much of the literature examines children's cooking skills and involvement with meal preparation. 9 However, to date, no nationally representative study in the United States has examined the relationship between household cooking frequency and dietary quality among children. Among adults, cooking frequency is associated with higher consumption of fruits and vegetables and lower intake of fat, sugar, and overall energy intake.10–12
A study of US adults found that household cooking frequency is associated with higher Healthy Eating Index-2015 (HEI-2015) scores, 13 and these findings are supported by a number of smaller studies.14–16 Parental practices are a strong predictor of children's dietary intake. 17 However, parental influence shifts as children age. 17 Therefore, the relationship between parental behaviors such as household cooking frequency may also be associated with higher dietary quality among youth, but this association may vary by age group.
Despite recent efforts to increase home cooking,18,19 time spent cooking in the United States declined significantly after 1965, through the end of the 20th century. 20 According to the nutrition transition model, this decline coincided with increased consumption of ultraprocessed foods (UPFs) and meals prepared outside the home.21–23 UPFs are industrially produced foods made from ingredients with little or no culinary use and “cosmetic additives,” such as flavor enhancers, thickeners, emulsifiers, and antifoaming agents. 24 UPFs are further characterized by their convenience, low cost, long shelf-life, hyperpalatability, and marketing tactics, especially targeting young children. 24 Currently, UPFs account for >50% of dietary intake among US youth. 25 High consumption of UPFs is associated with poorer dietary quality, including higher intake of energy-dense foods with added sugar and lower consumption of dietary fiber.26,27
Likewise, mounting evidence links high UPF intake and adverse health outcomes in both children and adults, including increased risk of obesity and cardiometabolic diease.27–32 Cooking may be an effective strategy for decreasing UPF intake, especially intake of ready-to-heat/ready-to-eat meals prepared outside the home. Several studies have demonstrated a relationship between household cooking behaviors and children's intake of UPFs.33,34 However, these studies have been small and have not assessed cooking frequency.
This study aims to examine the relationship between household cooking frequency and UPF intake and dietary quality among youth 0–19 years of age in the United States. We hypothesized that cooking frequency would be inversely associated with UPF intake and positively associated with dietary quality.
Methods
Data and Design
Data come from the National Health and Nutrition Examination Survey (NHANES). The NHANES is a cross-sectional survey designed to collect nationally representative data on the health and nutritional status of the US population. 35 NHANES uses a multistage, clustered, probability sampling strategy to select participants. 35 During the NHANES 2007–2008 and 2009–2010 waves, a screener was administered to an adult—the household reference person—to collect demographic characteristics. 36
Two 24-hour dietary recalls were collected from each participant; 36 the first was collected in person at a Mobile Examination Center and the second was collected through phone within 3–10 days. 36 Adolescents 12–19 years of age completed dietary recalls individually. 36 Children 6–11 years of age completed their own recall, but were assisted by a caregiver familiar with their dietary intake. 36 A proxy (responsible for preparing the participant's meals) completed dietary recalls for children <5 years of age. 36 After the second dietary recall was collected, interviewers administered the Flexible Consumer Behavior Survey (FCBS), which asked about individual and household behaviors. 36
Children >16 years of age completed their own FCBS. 36 The main meal planner (MMP) in a household completed the FCBS for children <11 years of age. 36 For children 11–15 years of age, the child completed the FCBS if they were the MMP, or the MMP completed the FCBS for the child. 36 This study used data from the NHANES 2007–2008 and 2009–2010 waves of data collection, which were the only years the FCBS asked about household cooking frequency.
Study Sample
The study sample included youth ≤19 years of age with 2 days of complete and reliable dietary recalls (as determined by NHANES) in the study sample (n = 6523). Breastfeeding infants (n = 254), individuals with implausible energy intake <500 kcal (n = 65) or >5000 kcal (n = 12), and those with missing information for cooking frequency (n = 84), food security status (n = 5), Special Supplemental Nutrition Program for Women, Infants, and Children (WIC; n = 70), US born (n = 4), or Supplemental Nutrition Assistance Program (SNAP; n = 1) were excluded. The final analytic sample included 6028 children (Appendix Fig. A1).
Measures
Exposure: Household cooking frequency
During the NHANES 2007–2008 and 2009–2010 waves, the FCBS asked the survey question, “During the past seven days, how many times did you or someone else in your family cook food for dinner or supper at home?” Responses were categorized into the subsequent categories following prior literature: (1) 0–2 times/week; (2) 3–4 times/week; (3) 5–6 times/week; and (4) ≥7 times/week.37,38
Outcomes: UPF intake
The Nova classification system was used to categorize all food and beverage items reported in participants' dietary recalls. Nova is a system used to categorize foods based on the degree of industrial processing. 39 Nova includes four categories: Group 1 unprocessed or minimally processed foods; Group 2 processed culinary ingredients; Group 3 processed foods; or Group 4 UPFs.24,39 Full descriptions of the four Nova groups are located in Appendix Table A1.
We categorized participants' food and beverage items into one of the four Nova groups using the following NHANES variables: “Main Food Description,” “Additional Food Description,” and “SR Code Description.” Variables “Combination Food Type” and “Source of Food” were also considered. For potential handmade recipes, the classification was applied to underlying ingredients (SR codes). Foods were classified independently by two researchers and discordant classifications were resolved by discussion.40,41 We calculated UPF intake by dividing energy intake from UPFs averaged across 2 days of dietary recalls by the participant's total energy intake averaged over the 2 days of dietary recalls (mean proportion method).
Outcomes: Dietary quality
We measured dietary quality using the HEI-2015. The HEI-2015 assesses dietary quality with a score from 0 to 100. 42 Higher scores indicate higher dietary quality according to the 2015–2020 Dietary Guidelines for Americans, and lower scores signify poorer dietary quality.42,43 Intake of total fruit, whole fruits, total vegetables, greens and beans, whole grains, dairy, total protein foods, seafood and plant proteins, and fatty acids are scored from 0 to 5 or 0 to 10, where higher scores represent higher intake. Intake of refined grains, sodium, added sugars, and saturated fats are scored from 0 to 10, but higher scores represent lower intake. Each component is scored and summed to generate the overall HEI-2015 score. HEI scores were calculated using the Simple HEI Scoring Algorithm based on a mean of days 1 and 2 dietary recall data. 44
Demographic covariates
In this analysis, covariates included age (0–5; 6–11; and 12–19 years), sex, race/ethnicity (Non-Hispanic White; Non-Hispanic Black; Hispanic; or other), income to poverty ratio (<1.0; 1.0–1.99; 2.0–2.99; 3.0–4.99; 5.0+: and missing), household reference person marital status (not married; married; or living with a partner), household reference person education [less than high school; high school diploma or General Education Development (GED); more than high school; or missing], household reference person marital status (not married; married/living with a partner; or missing); household size (1–3 people or 4+ people), born in the United States vs. not, receipt of SNAP in past 12 months (no or yes), receipt of WIC in past 12 months [No (but eligible), Yes, or Not eligible], and household food security status (high; marginal; low; or very low).
Analysis
Analyses were weighted to account for the complex sampling strategy in NHANES and produce nationally representative estimates. Cross tabulations and chi-squared tests were used to examine associations between household cooking frequency and study covariates. Multivariate linear regression models were used to assess the relationships between cooking frequency and UPF intake, and cooking frequency and HEI-2015. Models were adjusted first for age and sex and then adjusted using the covariates described above and total energy intake. Using the fully-adjusted model, mean UPF intake (as a proportion of total energy intake) and mean HEI-2015 score were predicted at different levels of household cooking frequency using postestimation margins commands. Tests of linear trend were performed to assess the effect of household cooking frequency as an ordinal continuous variable.
Interactions between household cooking frequency and age, race/ethnicity, SNAP, and food security status were separately included in the multivariable models to test for potential effect modification. Categories for all variables were the same as described above (and in Table 1) with the exception of race/ethnicity. For this interaction model, we excluded “Other” and tested the interaction between cooking and non-Hispanic Black, non-Hispanic White, and Hispanic children. All tests were two sided and significance was considered at p < 0.05. Analyses were performed using Stata, version 17 in 2022.
Characteristics of the Study Sample by Frequency of Cooking Dinner/Supper, National Health and Nutrition Examination Survey 2007–2010, (N = 6028)
p-Value from chi-squared tests. p-Trend from simple linear regressions with cooking dinner frequency included as a continuous ordinal variable.
Total row presents weighted row percentages for the cooking frequency groups. The other rows present weighted column percentages.
Non-Hispanic multiracial.
Based on mean of days 1 and 2 dietary recall data.
GED, General Education Development; HEI, Healthy Eating Index; SE, standard error; SNAP, Supplemental Nutrition Assistance Program; UPF, ultraprocessed food; WIC, Special Supplemental Nutrition Program for Women, Infants, and Children.
Results
Characteristics of the study sample are described overall as well as stratified by household cooking frequency in Table 1. Around 7.5% participants lived in households where dinner was cooked 0–2 times/week, 20% lived in households where dinner was cooked 3–4 times/week, 32% lived in households where dinner was cooked 5–6 times/week, and 40% lived in households where dinner was cooked 7 times/week. Participants were more likely to live in a household where dinner was cooked 7 times/week if they were Hispanic, they were <11 years old, they lived in a household that received WIC or SNAP benefits, they had low or very low household food security, they lived in a 4+ person household, they had an income to poverty ratio <2.0, and if the household reference person had less than a high school education or was married/living with a partner (p's < 0.001).
There was a significant inverse association between household cooking frequency and children's intake of UPFs (p-trend <0.001). Children in households where dinner was cooked 7 times/week had the lowest unadjusted intake of UPFs [60.78% (standard error, SE 0.69)], whereas children in households where dinner was cooked 0–2 times/week had the highest intake of UPFs [68.36% (SE 1.08)]. There was also a significant positive association between household cooking frequency and children's HEI-2015 scores (p-trend <0.001). However, children in households that cooked 5–6 times/week had the highest HEI-2015 score [50.07 (SE 0.58)], while children in households that cooked 7 times/week had an average HEI-2015 score of 49.98 (SE 0.45). We observed no significant association between household cooking frequency and total energy intake (Table 1).
Associations between household cooking frequency with UPF and HEI-2015 scores are presented in Table 2. Compared to households that cooked 0–2 times/week, higher household cooking frequency was associated with lower UPF intake among children in the multivariable-adjusted model [3–4 times/week: β = −3.62, 95% confidence interval (CI) −6.01 to −1.23; 5–6 times/week: β = −4.24, 95% CI −6.77 to −1.70; and 7 times/week: β = −6.30, 95% CI −8.81 to −3.78], with an overall p-trend <0.001. Likewise, in the multivariable-adjusted model, higher household cooking frequency was associated with higher HEI-2015 scores among children (3–4 times/week: β = −0.06, 95% CI −2.12 to 2.01; 5–6 times/week: β = 1.66, 95% CI −0.53 to 3.85; and 7 times/week: β = 1.92, 95% CI −0.04 to 3.87), with an overall p-trend = 0.001.
Associations Between Household Cooking Dinner/Supper Frequency With Percent of Energy Intake from Ultraprocessed Foods and Healthy Eating Index-2015 Scores Among Children Ages ≤19 Years Old (National Health and Nutrition Examination Survey, 2007–2010, N = 6028)
Linear regression model adjusted for age, sex, race and ethnicity, household size, household reference person education, household reference person marital status, income to poverty ratio, food security status, SNAP receipt, WIC receipt, total energy intake, and US born. UPFs and HEI based on mean of days 1 and 2 dietary recall data.
CI, confidence interval.
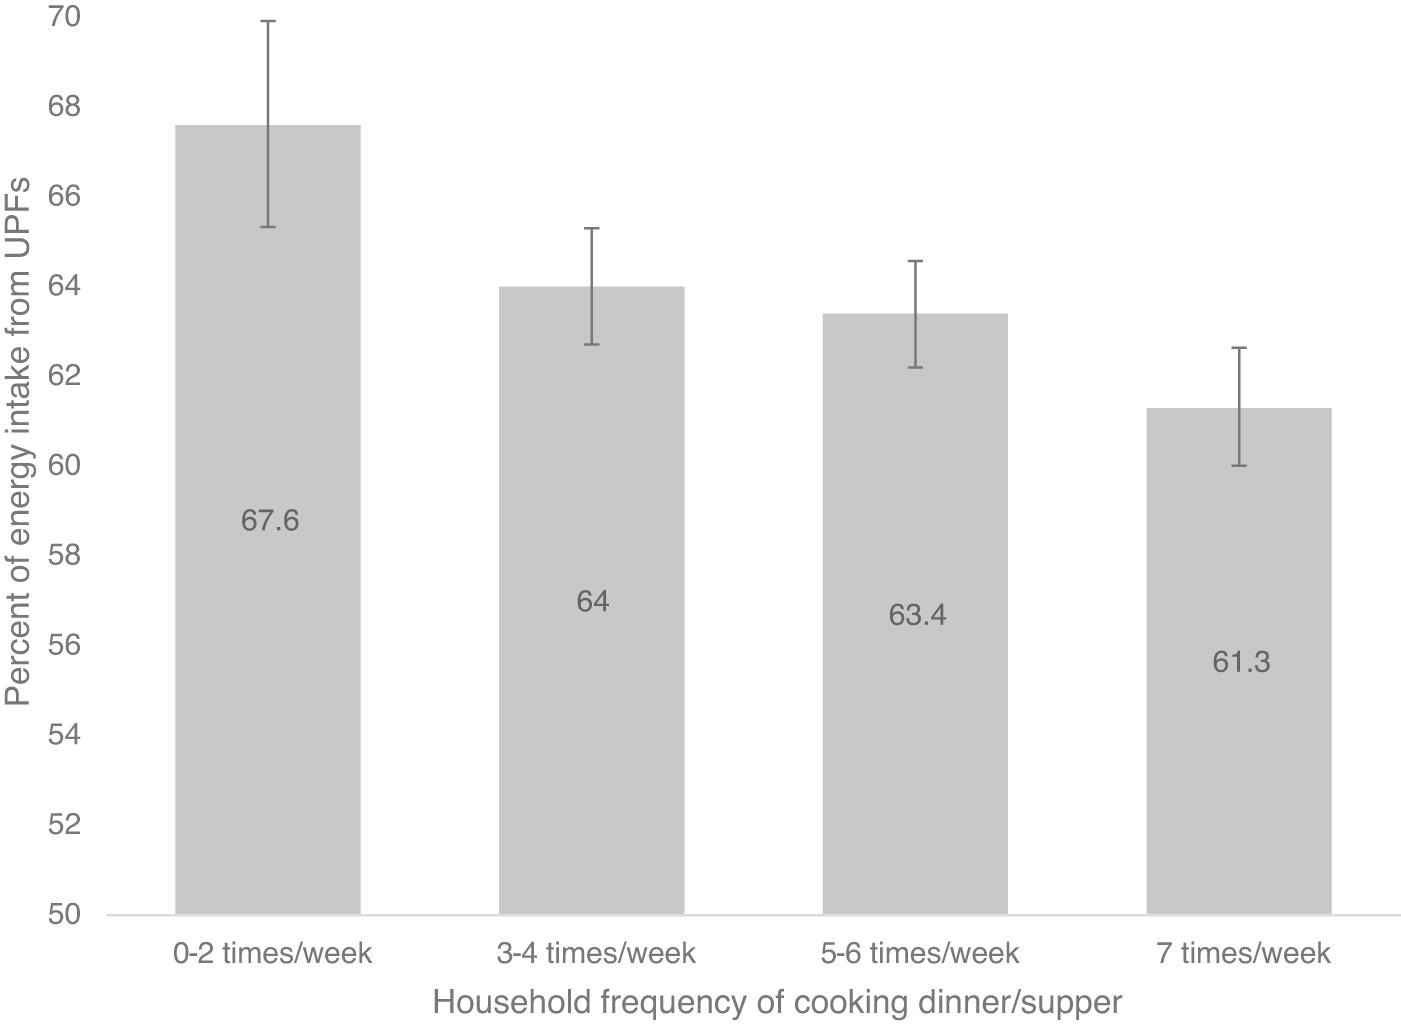
Figure 1 displays predicted UPF intake by cooking frequency based on fully-adjusted models from Table 2. The proportion of predicted energy intake from UPFs was 67.6%, among children in households where dinner was cooked 0–2 times/week compared to 61.3% among children in households where dinner was cooked 7 times/week. The predicted proportion of energy intake from all four Nova groups (from fully-adjusted models) is displayed in Appendix Figure A2. Figure 2 displays predicted HEI-2015 scores by cooking frequency based on fully-adjusted models from Table 2. Among children in households where dinner was cooked 0–2 times/week, predicted HEI-2015 score was 48.1 compared to 50.0 among children in households where dinner was cooked 7 times/week.

For both UPF intake and HEI-2015 outcomes, there was no evidence of effect modification based on age, race/ethnicity, SNAP, or food security status (all p-interactions >0.05).
Discussion
To our knowledge, this is the first study using a nationally representative sample of youth to examine the relationship between household cooking frequency and UPF consumption and dietary quality. Results indicate that, even after adjusting for demographic covariates, higher household cooking frequency is associated with lower intake of UPFs and higher HEI-2015 scores. UPF consumption among children and adolescents is high, 26 and is associated with poor dietary quality, obesity, and other adverse health outcomes.45–47 Our findings suggest that initiatives to support greater household cooking frequency may be an effective strategy for reducing UPF intake and encouraging healthier eating patterns among US youth.
These findings are largely consistent with the limited research available on household cooking practices and children's dietary quality. A cross-sectional study found that adolescents who reported any intake of evening meals prepared outside the home (fast food, meals delivered to home, or heat-and-serve/box meals) had poorer dietary quality, including lower consumption of fruits and vegetables and higher intake of sugar-sweetened beverages, convenience foods, and “junk food,” compared to adolescents who reported no intake of evening meals prepared outside the home. 34
This study also found that adolescents who reported any intake of evening meals cooked from scratch not only had higher intake of fruits and vegetables but also had higher intake of “junk food” compared to adolescents who reported no intake of evening meals cooked from scratch. 34 Given this evidence base and our findings which demonstrate an association between household cooking practices and dietary quality, future research should investigate potential associations between cooking frequency and cardiometabolic outcomes, including obesity among children overall and at different ages.
Our results align with findings in adults, where we demonstrated that higher cooking frequency is associated with higher HEI-2015 scores. 13 Interestingly, the association between HEI-2015 scores and household cooking frequency is weaker among children than adults, and children have poorer dietary quality overall. The weaker association between dietary quality and cooking frequency among children could be explained by the types of food prepared for children and/or inconsistency between meals prepared and children's intake. Younger children demonstrating picky eating behaviors may only eat part of a meal, such as eating pasta and avoiding green vegetables. 48
Older children, meanwhile, may not be at home during evening meals due to extracurricular or social activities, which may lead them to rely on fast food or convenience foods instead of meals prepared at home. Nevertheless, since we found no evidence of effect modification by age group, interventions to improve cooking behaviors in the home might have a positive impact regardless of the child's age.
Finally, it is notable that we found a stronger relationship between household cooking frequency and UPF consumption than with dietary quality. Not all meals prepared at home are healthy,49–52 and households with children may face additional constraints in cooking healthy meals. For example, parents describe limited time and children's picky eating behaviors as reasons for relying on prepackaged, processed foods.53–56
While higher-income parents can afford food waste if children reject vegetables or whole grains, lower-income parents report cost of food waste as a barrier to providing healthy meals. 48 Likewise, lower income, single parent, and households where both parents work full time have fewer resources and less time to cook. 57 UPFs such as ready-to-heat/ready-to-eat meals, fast food, and ultraprocessed ingredients or meal components fill a need for these households by providing convenient, affordable, and time-saving meals. Although many interventions have sought to promote healthy cooking at home, lack of time and resources remains barriers to behavior change. 57
This may demonstrate the need for nutritious products that are accessible to families with limited time and resources. Making less processed ready-to-heat/ready-to-eat meals more widely available and affordable, as well as incentivizing or requiring reformulation of processed/prepared foods to meet nutrition targets (i.e., for sodium and added sugars) may help parents provide healthy meals for children. In addition, investment in programs to build healthy cooking knowledge and skills (in addition to nutrition knowledge) for parents may also help build confidence and self-efficacy around cooking at home.58,59 Virtual and in-person cooking skills and food agency-based programs integrated into WIC, public schools, the health care system, churches, and other community venues are needed, as are robust evaluations of such programs.
Limitations
This study has several limitations. First, NHANES data are cross-sectional and therefore causal inferences about the relationship between cooking frequency and UPF consumption or dietary quality are not possible. Second, cooking frequency does not account for factors that influence nutritional quality, such as ingredients or preparation methods used. Cooking frequency also does not reflect whether or how often home-cooked meals are consumed. For example, parents may prepare meals, but children may rather eat prepackaged or ready-to-heat foods.
Another challenge with measuring cooking frequency is that individuals may interpret “cooking” differently, with some only reporting from scratch cooking, while others include preparation of ready-to-heat meals. 60 Another challenge is that our measure of cooking frequency only captures evening meals and refers to the past 7 days, whereas both UPF intake and HEI-2015 scores reflect 2 full days of dietary intake. Social desirability bias could also overestimate the strength of association between cooking frequency and UPF intake/HEI-2015 score, due to overreporting of cooking frequency and underreporting of dietary intake and UPF consumption. Finally, these data are from 2007 to 2010. More recent data have shown improvements in children's dietary quality since 2010, 1 which may have shifted the association with household cooking frequency. Future research is needed to examine whether the associations documented in this study still hold true.
Conclusion
In this study, we find that more frequent household cooking of evening meals is associated with lower UPF consumption. Dietary quality was low, regardless of how frequently dinner was cooked at home, although slightly better with greater cooking frequency. Initiatives focusing on building healthy cooking skills should be incorporated into comprehensive public health approaches to improve dietary quality and reduce UPF consumption among US children and adolescents.
Footnotes
Impact Statement
There is continued interest in cooking as a strategy to prevent childhood obesity, as well as mounting evidence demonstrating relationships between ultraprocessed food (UPF) intake and chronic disease. This study furthers understanding of these subjects by exploring the associations between household cooking frequency and UPF consumption and dietary quality among US youth.
Acknowledgments
J.A.W. conceived the study and the hypotheses. E.M.-S. and C.W.L. coded the Nova classification and the HEI-2015 outcomes, respectively. J.A.W. conducted the analyses and all authors contributed to the interpretation of the results. A.C.T. wrote the first draft of the article and all authors critically reviewed the article and approved it as submitted. This study was not subject to institutional review board approval as it consisted of secondary data analysis of de-identified, publicly available data.
Authors' Contributions
J.A.W.: conceptualization, methodology, formal analysis, and writing—review and editing; E.M.-S.: software, data curation, and writing—review and editing; C.W.L.: software, data curation, and writing—review and editing; A.C.T.: writing—original draft.
Funding Information
J.A.W. was supported by the National Institutes of Diabetes and Digestive and Kidney Diseases of the National Institutes of Health (Award No. K01DK119166). A.C.T. gratefully acknowledges support from the Harry D Kruse Publications Award in Human Nutrition.
Author Disclosure Statement
The authors have no conflicts of interest to declare.
Nova Classification
| Nova classification | Definition | Examples |
|---|---|---|
| Group 1: unprocessed or minimally processed foods | Group 1 includes foods that have undergone no processing or have only undergone minimal processing. Minimal processing includes grinding, roasting, pasteurization, freezing, drying, fermentation, roasting, or boiling. | Fruits, including 100% juice Vegetables Grains, including flour Legumes Meat, including poultry Fish Milk and yogurt |
| Group 2: processed culinary ingredients | Group 2 includes substances extracted, pressed, refined, or centrifuged from Group 1 foods or other naturally occurring foods. They are used to season and cook homemade or artisanal dishes from Group 1 foods. | Table salt Sugar, including table sugar, honey, and molasses Plant oils Animal fats, including butter and lard Vinegar |
| Group 3: Processed foods | Group 3 foods are manufactured using unprocessed or minimally processed foods (Group 1), with the addition of Group 2 processed culinary ingredients. This prolongs the durability of foods and modifies their palatability. Preservatives and stabilizers may be used in the preparation of these foods. | Cheese Canned fruits and vegetables preserved in brine or syrup Bread prepared from wheat flour and Group 2 ingredients (i.e., salt, yeast, butter, sugar) Salted, smoked, canned, or cured meat or fish |
| Group 4: Ultraprocessed foods | Group 4 foods are formulations of several ingredients, including Group 2 ingredients, and food additives not used in culinary preparations, like flavors, colors, sweeteners, emulsifiers, and other substances used to disguise undesirable qualities of the final product or imitate the sensorial qualities of Group 1 culinary preparations. | Carbonated drinks Fruit-flavored drinks Sweet or savory packaged snacks Candies Ready-to-eat and ready-to-eat heat pizza, sandwich, or burger, or frozen or shelf-stable dishes |
Source: Monteiro et al. A1