
Abstract
Background:
The etiology of obesity is multifaceted, with multiple risk factors occurring during early childhood (e.g., fast food frequency, eating dinner as a family, TV in the bedroom). Many past studies have largely considered obesity risk factors in isolation, when in reality, the risk factors likely cluster together. A latent class analysis can be used to identify patterns in child eating behaviors, parent feeding behaviors, and household habits among preschool-aged children and their families to identify distinct, heterogenous classes and to determine if classes are associated with overweight and obesity.
Methods:
We used data from a community-based study of 624 three- to five-year-old children and a parent in New Hampshire, from March 2014 to October 2015. Parent-reported data were used to determine frequency of eating behaviors and household habits. Height and weight were objectively measured.
Results:
Four classes were identified; Class 1: “Healthy/Mildly accommodating,” Class 2: “Healthy/Accommodating,” Class 3: “Moderately healthy/Moderately accommodating,” and Class 4: “Least healthy/Least accommodating.” Compared with Class 1, children in Class 4 had increased odds of being overweight or obese [adjusted odds ratio (aOR): 1.64, 95% confidence interval (CI): 1.13–2.15], whereas Classes 2 and 3 were not associated with BMI (Class 2: aOR: 1.24, 95% CI: 0.62–1.86; Class 3: aOR: 1.31, 95% CI: 0.81–1.81).
Conclusion:
Study findings highlight that child–parent interactions around meals differentially relate to children’s weight status given the context of children’s eating habits. Most important, our study findings confirm the importance of adapting multiple healthy habits within the home social and physical environment to offset obesity risk in young children.
Introduction
Childhood obesity is widespread in the United States. 1 The home social and structural environment around eating can have a considerable influence on obesity risk at a young age. Young children consume most of their calories either at home or from foods prepared at home,2–4 and family structure and rules around meals can impact children’s weight gain. Consuming meals together as a family is linked to a decreased risk of overweight and obesity among children, 5 and consuming takeout food is associated with overweight and obesity among children.6–8 More total screen time 9 and a TV in the child’s bedroom also increase the risk of obesity. 10 In addition, child appetitive traits relate to their weight status; for example, picky eating and food neophobia may be associated with both higher and lower BMI, 11 and parents may react to these child-level traits by altering the social feeding environment at home. 12
Our approach is grounded within the frameworks of the Division of Responsibility for Feeding13,14 and responsive feeding, 15 which detail how parents are responsible for the appropriate structure of feeding, the child is responsible for how much and whether or not to eat what the parent provides, the feeding context is pleasant with few distractions, and parents respond to the child in an emotionally supportive manner. Responsive feeding is helpful for children regarding reducing obesity risk, 16 where studies have found significant associations between parental feeding and child adiposity.17,18
Multifaceted obesity prevention programs are needed to maximize effectiveness in offsetting excess weight gain during childhood.19,20 However, while past studies have largely considered obesity risk factors in isolation, such risk factors likely cluster together. Kininmonth et al. suggested that future research should focus on comprehensive measures of multiple home environment factors to understand their influence on children’s weight status. 21 Identifying specific clusters may help to inform interventions at the individual-family level by targeting the most salient risk factors.
Four previous latent class analysis (LCA) studies22–25 (Table 1) have linked various obesity-related behaviors with BMI in 3–5-year-olds. These studies covered a variety of exposures ranging from cardiometabolic factors to neighborhood characteristics. The present study extends these findings by considering how multiple risk factors may collectively influence obesity risk by leveraging LCA, a method that considers how individual risk factors may reflect a shared latent construct. Presently, we focus on multiple home-based risk factors including fast food frequency, child chooses what to eat for dinner, parent buys foods with pictures child likes, parent gets child to try new foods, child is a picky eater, parent prepares different food for child than family, eating dinner together, getting takeout for dinner, child has a TV in bedroom, TV is on when no one is watching, physical activity, and nighttime sleep. These factors have not collectively been included in LCA approaches examining young children’s overweight or obesity to date. Our goal is to identify clusters of modifiable, home-based risk factors for child overweight or obesity that can be targeted with interventions.
Literature Table of Latent Class Analyses of Obesity-Related Factors and BMI Among 3–5-Year-Olds
aOR, adjusted odds ratio; CI, confidence interval; LCA, latent class analysis; OR, odds ratio.
Materials and Methods
Data for this secondary analysis were collected from a community-based study of 624 three- to five-year-olds and a parent, recruited in New Hampshire and enrolled between March 2014 and October 2015. The parent study was designed to test the prospective associations between child food marketing exposures and dietary intake26,27 and weight gain. 8 Recruitment sites included pediatric outpatient clinics, community events, child care centers, Facebook, and referrals. Children were 3–5 years old, resided within 1 hour’s drive of recruitment site, and lived with a parent at least 3 days a week. Children had no health condition that affected food intake and parents were English literate. This current study used baseline data from the parent study. Overall, 667 children were screened and 624 enrolled (93.6%). One participant did not have covariate information and was dropped.
Parents completed a survey to self-report socio-demographics, eating behaviors, physical activity, sleep, and household habits related to meals and media (herein called household habits). Surveys were pretested with a demographically comparable sample for comprehension, face validity, and completion time.28,29 Trained staff measured child weight and height. Informed written consent was obtained. The Dartmouth College Committee for the Protection of Human Subjects approved the study (full board review.)
Indicator Variables
From the survey, we selected 14 child eating behaviors, parent feeding behaviors, and household habits (i.e., home-based risk factors) that could be potentially associated with obesity.6–8,10,11,30 LCAs allow for many indicators. 31 The original distribution and response choices for these selected candidate predictors are in Supplementary Table S1. Variables were collapsed so that no single response category was less than 10% of the sample. 31 For child fast food frequency, responses were “less than once a month,” “at least monthly to less than once a week,” and “at least weekly.” For child chooses what to eat for dinner, parent buys foods with pictures or packaging child likes, parent tries to get child to try new foods, child is a picky eater, and parent prepares different foods for the child than family, responses were “never,” “sometimes,” “most of the time,” or “all the time.” For number of days per week family eats dinner together, gets takeout for dinner, or cooks dinner together, responses were 0, 1–2, 3–4, 5–6, or 7 days. For TV in the bedroom, response choices were “yes” or “no.” For TV on even when no one is watching, responses were “never,” “hardly ever,” “some of the time,” “most of the time,” and “all the time.” For time spent playing outside per week, responses were <1, 1–2, 3–4, 5–6, or 6+ hours per day (weekdays and weekend days), combined for weekly estimates. For nighttime hours of sleep, parents selected the times their child usually went to sleep and woke. Average hours of sleep per night were estimated. Table 3 presents the collapsed indicator variables and frequencies used in the final LCA.
Outcome
Age- and-sex-adjusted BMI percentiles were computed with Centers for Disease Control and Prevention equations. 32 Overweight was defined as BMI ≥85th and <95th percentile, obesity as BMI ≥95th percentile, and healthy weight as BMI ≥5th and <85th percentile. Very few children were underweight (BMI <5th percentile) (n = 9) and were combined with healthy weight. Weight status was dichotomized as “overweight and obese” versus “healthy.”
Covariates
Covariates included child age, biological sex, race/ethnicity (non-Hispanic White vs. other), parent age (20–29 or 30+ years), and parent education (up to Associate’s or technical degree vs. Bachelor’s degree or higher).
Statistical Analyses
LCA was used to identify latent classes based on child eating behaviors, parent feeding behaviors, and household habits. A correlation matrix of indicator variables was first computed to examine pair-wise correlations between variables; variables in pairs with high correlations (i.e., |r| > 0.5) 31 were identified as ones to potentially exclude because of multicollinearity. Child and parent fast food frequency were positively correlated (r = 0.61). We retained child fast food frequency because of proximity to child intake and thus weight. Frequency the family cooks together was negatively correlated with frequency the family gets takeout for dinner (r = −0.55). We retained the takeout for dinner variable in that pair because the measure for takeout foods likely better reflects meals higher in total fat, sugar, and calories than the more general measure of meals cooked at home.8,33 We did keep two moderately correlated variables (r = 0.56) (child is a picky eater, parent prepares different food for child than family). Although this parental behavior may be a reaction to child picky eating, it can also reflect other aspects of mealtime parenting to accommodate child’s requests or not be restrictive.
We used fit statistics to identify the best-fitting LCA model. We began with a 2-class model, compared with a 3-class model, and then a 3-class model to a 4-class model, hierarchically, up to six models. Standard criteria were used to select the best fitting model31,34 to define and make the groups interpretable. We dropped two indicators (outside play, sleep) for poor quality to separate classes. 31 In single-variable studies from the same dataset, sleep and physical activity were also not associated with weight, 8 ultra-processed food intake, 35 and diet quality. 36 Other LCAs also did not find sleep and physical activity to be helpful indicators.22,23 Our goal in fitting the model and identifying the final number of classes was to derive a model that was parsimonious and interpretable.31,34
LCA model results were compared with and without covariates. We found similar item response probabilities and class labels and thus only unconditional LCA results are shown.31,34 Adjusted logistic regression was used to fit child weight status on the classes using the Bolck–Croon–Hagenaars (BCH) method. 37 Covariates were significant at the p < 0.05 level. Mplus (version 8.7) and R Language for Statistical Computing (version 4.2.2) were used.38,39
Results
Table 2 shows the study population included mostly 3-year-olds, and similar proportions of boys and girls and children were mostly White, non-Hispanic. Most children were at a healthy weight. Supplementary Table S2 presents the correlations among all candidate predictors for the LCA, covariates, and child BMI to check for multicollinearity. Table 3 describes the potential home-based risk factors retained for the LCA model. Table 4 presents the model fit statistics of six estimated models. We retained the 4-class model based on mean class average probabilities (≥0.80), entropy (≥0.80), Bootstrap Likelihood Ratio Test (p < 0.05), lowest Bayesian information criteria, low sample size adjusted Bayesian information criteria, class size, and interpretability. 31 The distribution across the final class assignment was Class 1: 26%, Class 2: 14%, Class 3: 33%, and Class 4: 27%.
Child, Parent, and Household Characteristics in Preschool-Aged Children and Families (2014–2015)
Among 624 parent–child dyads enrolled in a cohort study who completed baseline survey.
Entries may not add to 624 up because of missing responses.
Univariate Counts and Proportions of Home-Based Risk Factors in Preschool-Aged Children and Families (2014–2015)
Among 624 parent–child dyads enrolled in a cohort study who completed baseline survey.
Entries may not add to 624 up because of missing responses.
Fit Statistics for a Latent Class Analysis of 10 Home-Based Risk Factors a Among 3–5-Year-Olds and a Parent (n = 624)
Includes child fast food intake frequency, child chooses what is for dinner, parent buys foods based on packaging their child will like, parent has child try new foods, child is a picky eater, parents prepare different foods for the child than rest of family, frequency of eating dinner together as a family, getting takeout for dinner, child has TV in bedroom, and frequency the TV is on even if no one is watching.
Final selected solution.
A measure of separation between the classes.
Average probability of an individual being assigned to a class given responses on the indicator variables used to create the classes. Values ≥0.80 are desirable.
p-Value for k-class solution versus (k + 1) class solution.
AIC, Akaike information criteria; BIC, Bayesian information criteria; SSABIC, sample size adjusted Bayesian information criteria.
Figure 1 presents the probability of item responses for each variable, stratified by class assignment. Class 1 had the lowest frequency of fast food intake and getting takeout food for dinner and the highest frequency of consuming meals together as a family and no TV in the child’s bedroom. Child choosing dinner and parent making different food for the child “sometimes” were also common in Class 1. We thus labeled Class 1 as “Healthy/Mildly accommodating,” reflecting a higher alignment of healthy eating habit recommendations 40 with some accommodation to child preferences. In contrast to Class 1, Class 2 was defined by a higher frequency of fast food intake, child exhibiting picky eating, parent making different food for the child, and buying food with packaging the child likes. We thus labeled Class 2 as “Healthy/Accommodating.” Class 3 was similar to Class 2 with distinctions marked by a higher frequency of fast food intake, child choosing dinner, and TV being on when no one is watching, but lower frequency of parent making different foods. We thus label Class 3 as “Moderately healthy/Moderately accommodating.” Finally, fast food intake and getting takeout for dinner were most frequent and parent making different food the least frequent in Class 4. We thus labeled Class 4 as “Least healthy/Least accommodating.”
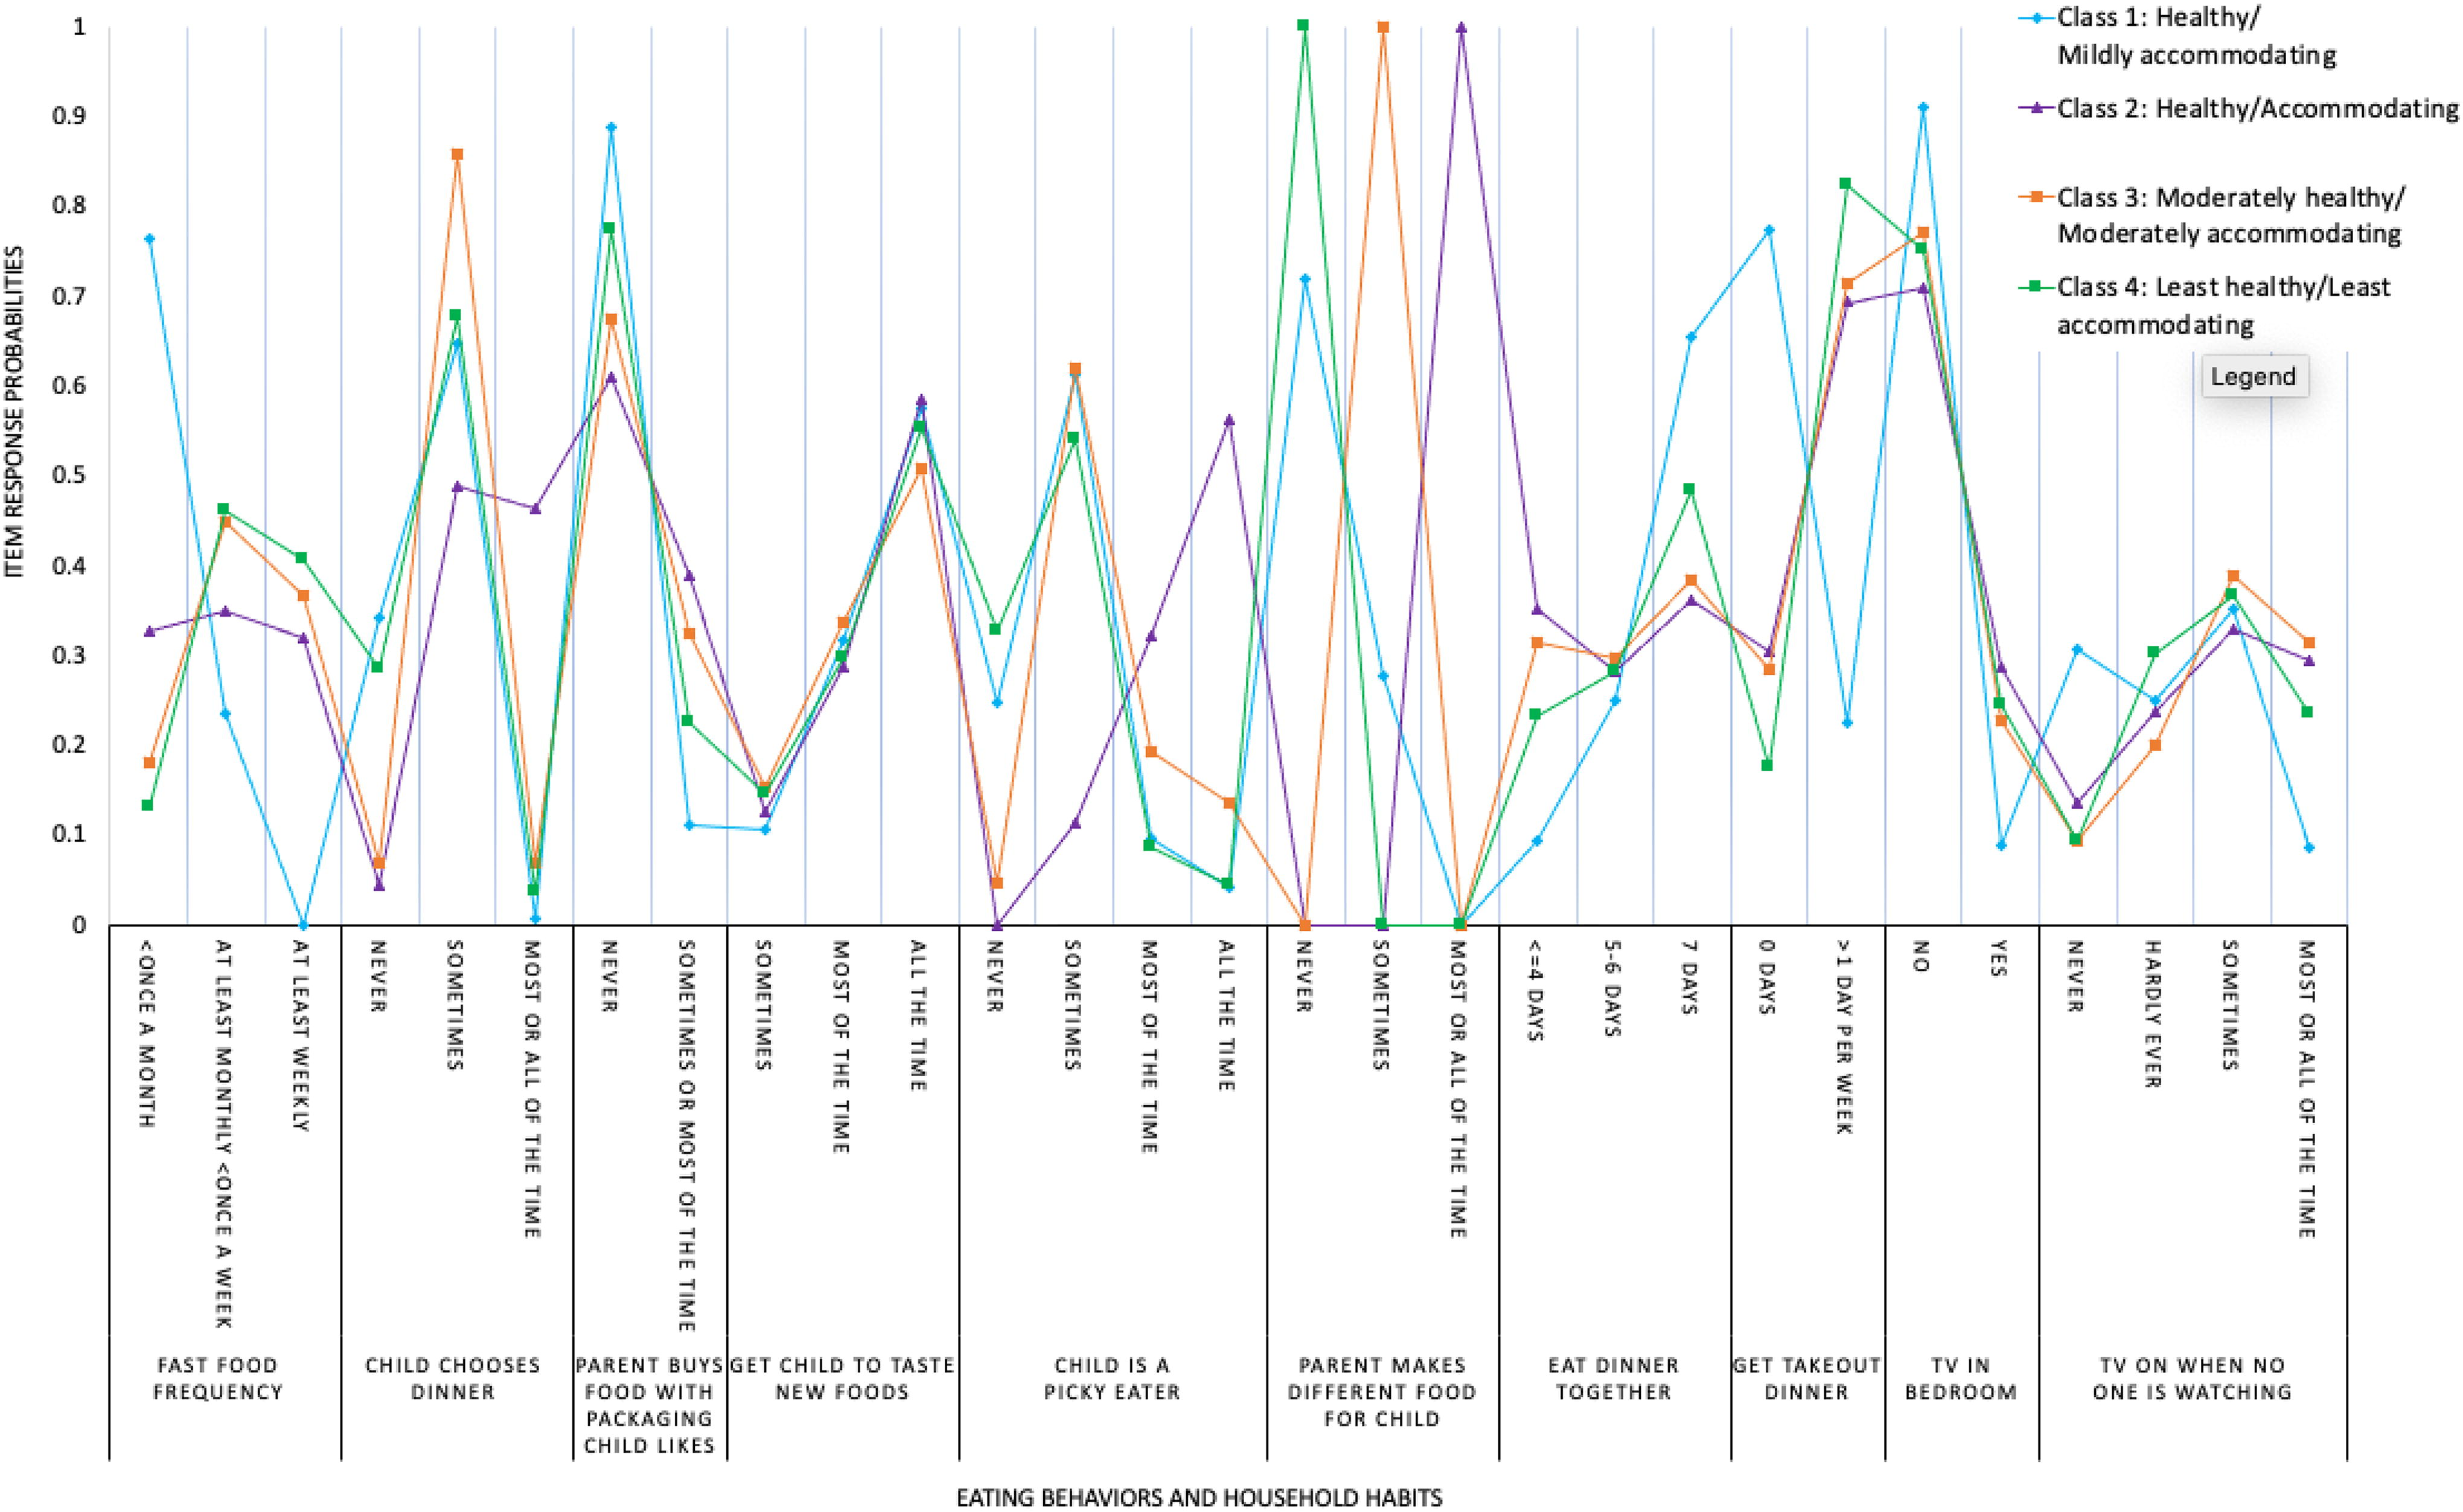
Probability of latent class membership and item-response probabilities: Unconditional 4-class solution among 3–5-year-olds and a parent (2014–2015).
When we added covariates to the LCA (Table 2), the classes did not substantially change. Only two covariates predicted a particular class (p ≤ 0.05). Compared with parents with a higher education level (Bachelor’s degree or higher), parents with a lower education level (“up to an Associate’s degree”) were more likely to be in Class 3 versus Class 1 (p ≤ 0.01). Compared with children with reported White, non-Hispanic race/ethnicity, children who were not White, non-Hispanic were more likely to be in Class 4 versus Class 1 (p = 0.01).
Table 5 presents adjusted odds of children having overweight or obesity by the final latent classes. The prevalence of a child having overweight or obesity increased monotonically from Class 1 to Class 4, with a statistically significant difference between Class 4 and Class 1 [adjusted odds ratio (aOR): 1.64; 95% confidence interval (CI): 1.13, 2.15].
Adjusted Odds Ratios and 95% Confidence Intervals of Children Having Overweight or Obesity by Latent Classes of Home-Based Risk Factors and Probabilities of BMI Categories in Preschool-Aged Children (2014–2015) (n = 623)
Adjusted for child age, sex, race and ethnicity, parent age, and parent education.
Discussion
There was a relatively similar prevalence of children across the 4 classes (Class 1: “Healthy/Mildly accommodating,” Class 2: “Healthy/Accommodating,” Class 3: “Moderately healthy/Moderately accommodating,” and Class 4: “Least healthy/Least accommodating”). We found that Class 4 had the highest odds of overweight and obesity compared with Class 1. Class 2 and Class 3 were not associated with odds of overweight and obesity as compared with Class 1.
The most distinct variable was the probability a parent makes different food for the child as they do not like what the rest of the family eats. Only one of the classes was significantly related to odds of overweight and obesity (i.e., Class 4), suggesting potentially that “never” being flexible with regard to child food preferences may contribute to higher odds of overweight and obesity compared with Class 1. This is supported by research that shows that parents avoiding restrictive and coercive feeding behaviors, serving healthy foods, and being positive models for eating behaviors contribute to better weight outcomes in children. 41
Research also suggests that parents with an “authoritative parenting style” (e.g., limit setting with connection) characterized by parents who have reasonable expectations for their child, respect the child’s opinion, foster child autonomy, and provide warmth may be protective of less favorable weight outcomes. 42 In contrast, parents with an “authoritarian parenting style” (e.g., discipline and control) characterized by parents who are not sensitive to the child’s opinion and place strict demands on their child may have a higher risk of overweight. 42 This finding may reflect less restrictive parent feeding practices, where parents do not explicitly prohibit certain foods they perceive as unhealthy. Indeed, greater parental restriction of food is related to a greater risk of overweight and obesity among children. 43 Literature suggests that parents should include less favorite or new foods with favorite foods and have foods available for tasting.44,45 Targeted interventions could be developed to encourage less restrictive parenting styles.
Class 2 showed high levels of accommodation to picky eating [i.e., allowing the child to choose dinner, moderate consumption of fast food, buying foods the child is interested in (e.g., packaging, making separate meals, getting takeout), and not always eating dinner together)]. The healthier weight of these children is consistent with some literature on picky eating and BMI. In a systematic review of picky eating and child BMI, 11 studies found a negative association. 11
Furthermore, Class 2 had a similar probability of healthy weight versus overweight and obesity as Class 3. This may be attributed to certain types of leniencies and potentially parents giving children opportunities to make eating choices, whether guided or not. Parents in Class 1 had moderate probability of flexible attributes for some indicators, suggesting a combination of limit setting and flexibility may have favorable BMI outcomes. Overall, these findings suggest certain patterns of indicator variables may have an impact on children’s weight status.
Media use is a risk factor for overweight and obesity. 10 Classes 2, 3, and 4 had similar probabilities for media use, whereas Class 1 was more distinct.
Four previous studies used LCA in children aged 3–5-year-olds to investigate other obesity-related variables, as shown in Table 1.22–25 Three studies found at least one distinct class had an increased odds of overweight or obesity compared with the reference. For example, one study in 3–11-year-olds identified 6 classes. Compared with the “healthy” group, all conferred higher odds of overweight [effect sizes: odds ratio [OR]: 1.31–1.94 (95% CI: 1.03–3.18)] and obesity [effect sizes: OR: 1.46–3.33 (95% CI: 1.10–6.68)] for all classes except one. 22 Factors that may have influenced this relationship include increased screen time, cholesterol, lipids, and low income. 22 The present study found similar results, with one distinct class (Class 4) having increased odds of overweight and obesity compared with Class 1 with similar magnitude of effect [OR: 1.64 ((95% CI: 1.13–2.15)]. In contrast, one study in 3-year-olds found no classes with increased odds of overweight or obesity (effect sizes: OR: 0.87–0.93 (95% CI: 0.46–1.89). 25 The present study expands these findings by using objective height and weight for BMI (24) and focuses on different family- and individual-level variables.
Our findings highlight the heterogenous patterns in home-based risk factors of preschool-aged children and may help facilitate family-level interventions. For example, development of targeted interventions could include supporting parents getting takeout less often, not having a TV in the child’s bedroom, turning off the TV, and generally uptaking an authoritative versus authoritarian parenting style.
Strengths of this study include taking place in a natural setting, objective height and weight, and multiple risk factors potentially related to children’s BMI. We also kept ordinal categories; several LCA studies dichotomize response indicators, 34 potentially losing important information. An LCA (a data-driven approach) can be used to identify subgroups of individuals who may benefit from different interventions that may be missed by using single variable or multivariable models. Focusing efforts on a particular class (e.g., Class 4) may have more public health impact, such as a targeted intervention for those that endorse similar response choices as Class 4 (e.g., fast food intake, “never” making different food for child), distinct characteristics that were identified in the LCA.34,46
Limitations including the results of this study are based on parent’s self-report of child behaviors, potentially being affected by recall error, social desirability bias, and reporting bias. However, our exposure indicators are consistent with other studies. This study is cross-sectional and temporality cannot be confirmed. Results could be affected by residual confounding, although we adjusted for several important covariates. Limitations of LCA include class membership based on probabilities, so classes are not certain, exact proportion of sample members in each class cannot be determined, and there is a risk of class names not accurately reflecting the classes. However, this method is still valuable for identifying patterns of home-based risk factors to facilitate development of interventions to prevent overweight and obesity among preschool-aged children. Our sample reflected a largely non-Hispanic, White population (∼86%), representative of the New Hampshire community where recruitment took place 47 ; however, results may not be generalizable to the entire United States. More research is needed in more diverse populations.
Conclusions
Our study defined distinct clusters of home-based risk factors that differentially related to child weight status. Our approach demonstrates the utility of LCA to understand the heterogeneous nature of obesity risk factors with households. Study findings specifically highlight that child eating behaviors, parent feeding behaviors, and household habits differentially relate to children’s weight status given the context of children’s eating habits. Most important, our study findings confirm the importance of adapting multiple healthy habits within the home social and physical environment to offset obesity risk in children.
Impact Statement
This LCA suggests the need for developing family-level, targeted interventions to prevent overweight and obesity in preschool-age children that address multifaceted risk factors.
Footnotes
Acknowledgment
The authors would like to thank all of the study participants and their families for participating in the study.
Authors’ Contributions
S.R.S., N.V., and E.B.-J. contributed to the conception and design of the secondary data analysis. S.R.S., N.V., and E.B.-J. made a substantial contribution to the interpretation and verification of the data analyses. S.R.S., N.V., E.B.-J., and J.A.E. revised the article for important intellectual content. J.E.C. made a substantial contribution to the acquisition of data, design, execution, and interpretation of the data analyses and writing and revising all sections of the article. All authors read and approved the final version of the submitted article.
Disclaimer
The National Institutes of Health had no role in the design and conduct of the study; collection, management, analysis, and interpretation of the data; preparation, review, or approval of the article; or decision to submit the article for publication.
Funding Information
This work was supported by the National Institutes of Health (grant numbers R01HD071021 and K01DK117971).
Author Disclosure Statement
All authors declare that they have no conflicts of interest in the authorship or publication of this article. No financial disclosures were reported by the authors of this article.
References
Supplementary Material
Please find the following supplemental material available below.
For Open Access articles published under a Creative Commons License, all supplemental material carries the same license as the article it is associated with.
For non-Open Access articles published, all supplemental material carries a non-exclusive license, and permission requests for re-use of supplemental material or any part of supplemental material shall be sent directly to the copyright owner as specified in the copyright notice associated with the article.