
Abstract
Background:
The intensive treatment aimed at achieving optimal A1C may increase a risk of hypoglycemia. Therefore, we examined the rate and duration of hypoglycemia (<70 mg/dL) and the duration of hyperglycemia (≥200 mg/dL) according to their A1C status, using continuous glucose monitoring (CGM) in Japanese patients with type 2 diabetes who were treated with hypoglycemic agents.
Methods:
Forty subjects were equally divided into three groups according to their A1C levels (low, intermediate, and high A1C groups). The 24-h CGM data were collected immediately upon admission to hospital with the patients continuing to take the same medications they had prior to hospitalization.
Results:
There was a significant difference in the total duration of hyperglycemia among the groups, with the low A1C group having a median duration of hyperglycemia of 50 min (25–75th percentile, 0–550 min) compared with 302.5 min (220–500 min) in the intermediate A1C group and 660 min (185–830 min) in the high A1C group. However, the incidence rate and total duration of hypoglycemia were similar for all A1C groups.
Conclusion:
The A1C level did not predict the presence or the duration of hypoglycemia.
Introduction
Research Design and Methods
Study subjects comprised type 2 diabetes patients between 30 and 85 years old who were treated with more than one hypoglycemic agent (sulfonylureas, glinides, insulin). Subjects were equally divided into three groups according to their A1C levels (low, intermediate, and high A1C groups) at their hospitalization. As glycosylated hemoglobin (HbA1c) (Japan Diabetes Society values) are used in Japan, A1C (NGSP values) were calculated adding 0.4 to the HbA1c (Japan Diabetes Society values). 8 Hypoglycemia was defined as a glucose level below 70 mg/dL. Hyperglycemia was defined as a glucose level above 200 mg/dL.
Subjects started CGM after hospitalization and continued treatment with the same medications they had taken prior to admission. The rate and total duration of hypoglycemia and the total duration of hyperglycemia were assessed over a 24-h period according to A1C group using CGM data taken from a continuous 21:00–21:00 h period, within 3 days of their hospitalization. The purpose of hospitalization was to improve glycemic control for all subjects. CGM was performed using the CGMS® System Gold™ (Medtronic Inc., Northridge, CA). The interstitial glucose values obtained with the CGMS System Gold were calibrated four times daily with self-monitoring of blood glucose values taken before each of the three meals and at 21:00 h. The CGMS values were proven to significantly correlate with the self-monitoring of blood glucose values, 9 demonstrating an acceptable clinical accuracy for the CGMS data. 10,11
In addition, the number of subjects who had at least one episode of hypoglycemia was graphically assessed according to the duration of hypoglycemia, classified as follows: 5–30, 31–60, 61–90, 91–120, 121–150, or ≥151 min.
The number of subjects who had at least one episode of hypoglycemia was compared using Fisher's exact test among the three groups. The total duration of hypoglycemia and the total duration of hyperglycemia during the 24-h period were compared using the Kruskal–Wallis test among the three groups. Statistical analyses were performed using SAS version 9.1 (SAS Institute, Cary, NC). The CGM study was approved by the Institutional Review Board of Jikei University School of Medicine, Tokyo, Japan.
Results
Subjects comprised 40 type 2 diabetes patients (14 women [35%]; median age, 68.7 years [25–75th percentile, 60.4–74.0 years]; median body mass index, 24.3 [21.9–26.8] kg/m2; median A1C value, 8.0% [7.2–8.9%]). Thirty subjects (75%) received insulin therapy (Table 1). A1C levels for all subjects ranged from 6.0% to 10.9%, with 13 subjects in the low A1C group (defined as 6.0–7.2%), 14 subjects in the intermediate A1C group (7.3–8.6%), and 13 subjects in the high A1C group (8.7–10.9%). There was no significant difference among the three groups in regard to age, sex, body weight, body mass index, and hypoglycemic medication usage.
Hypoglycemia was defined as below 70 mg/dL; hyperglycemia was defined as above 200 mg/dL. The low A1C group was defined as 6.0–7.2%, the intermediate A1C group as 7.3–8.6%, and the high A1C group as 8.7–10.9%. Data are median values (25–75th percentiles).
By Kruskal–Wallis test. **By Fisher's exact test.
No significant difference was found in the number of subjects who had at least one episode of hypoglycemia over the 24-h period according to A1C level, with four subjects (30.8%) in the low A1C group, five subjects (35.7%) in the intermediate A1C group, and six subjects (46.2%) in the high A1C group (P = 0.7802 by Fisher's exact test). In addition, there was no significant difference in the total duration of hypoglycemia among the A1C groups (P = 0.6573 by Kruskal–Wallis test). Despite no subjects having hypoglycemia lasting more than 151 min in the low A1C group, several subjects in the intermediate and high A1C groups had hypoglycemia lasting longer than 151 min (Fig. 1). In contrast, there was a significant difference in the total duration of hyperglycemia among the groups, with the low A1C group having a median duration of hyperglycemia of 50 min (25–75th percentile, 0–550 min) compared with 302.5 min (220–500 min) in the intermediate A1C group and 660 min (185–830 min) in the high A1C group (P = 0.0224 by Kruskal–Wallis test).
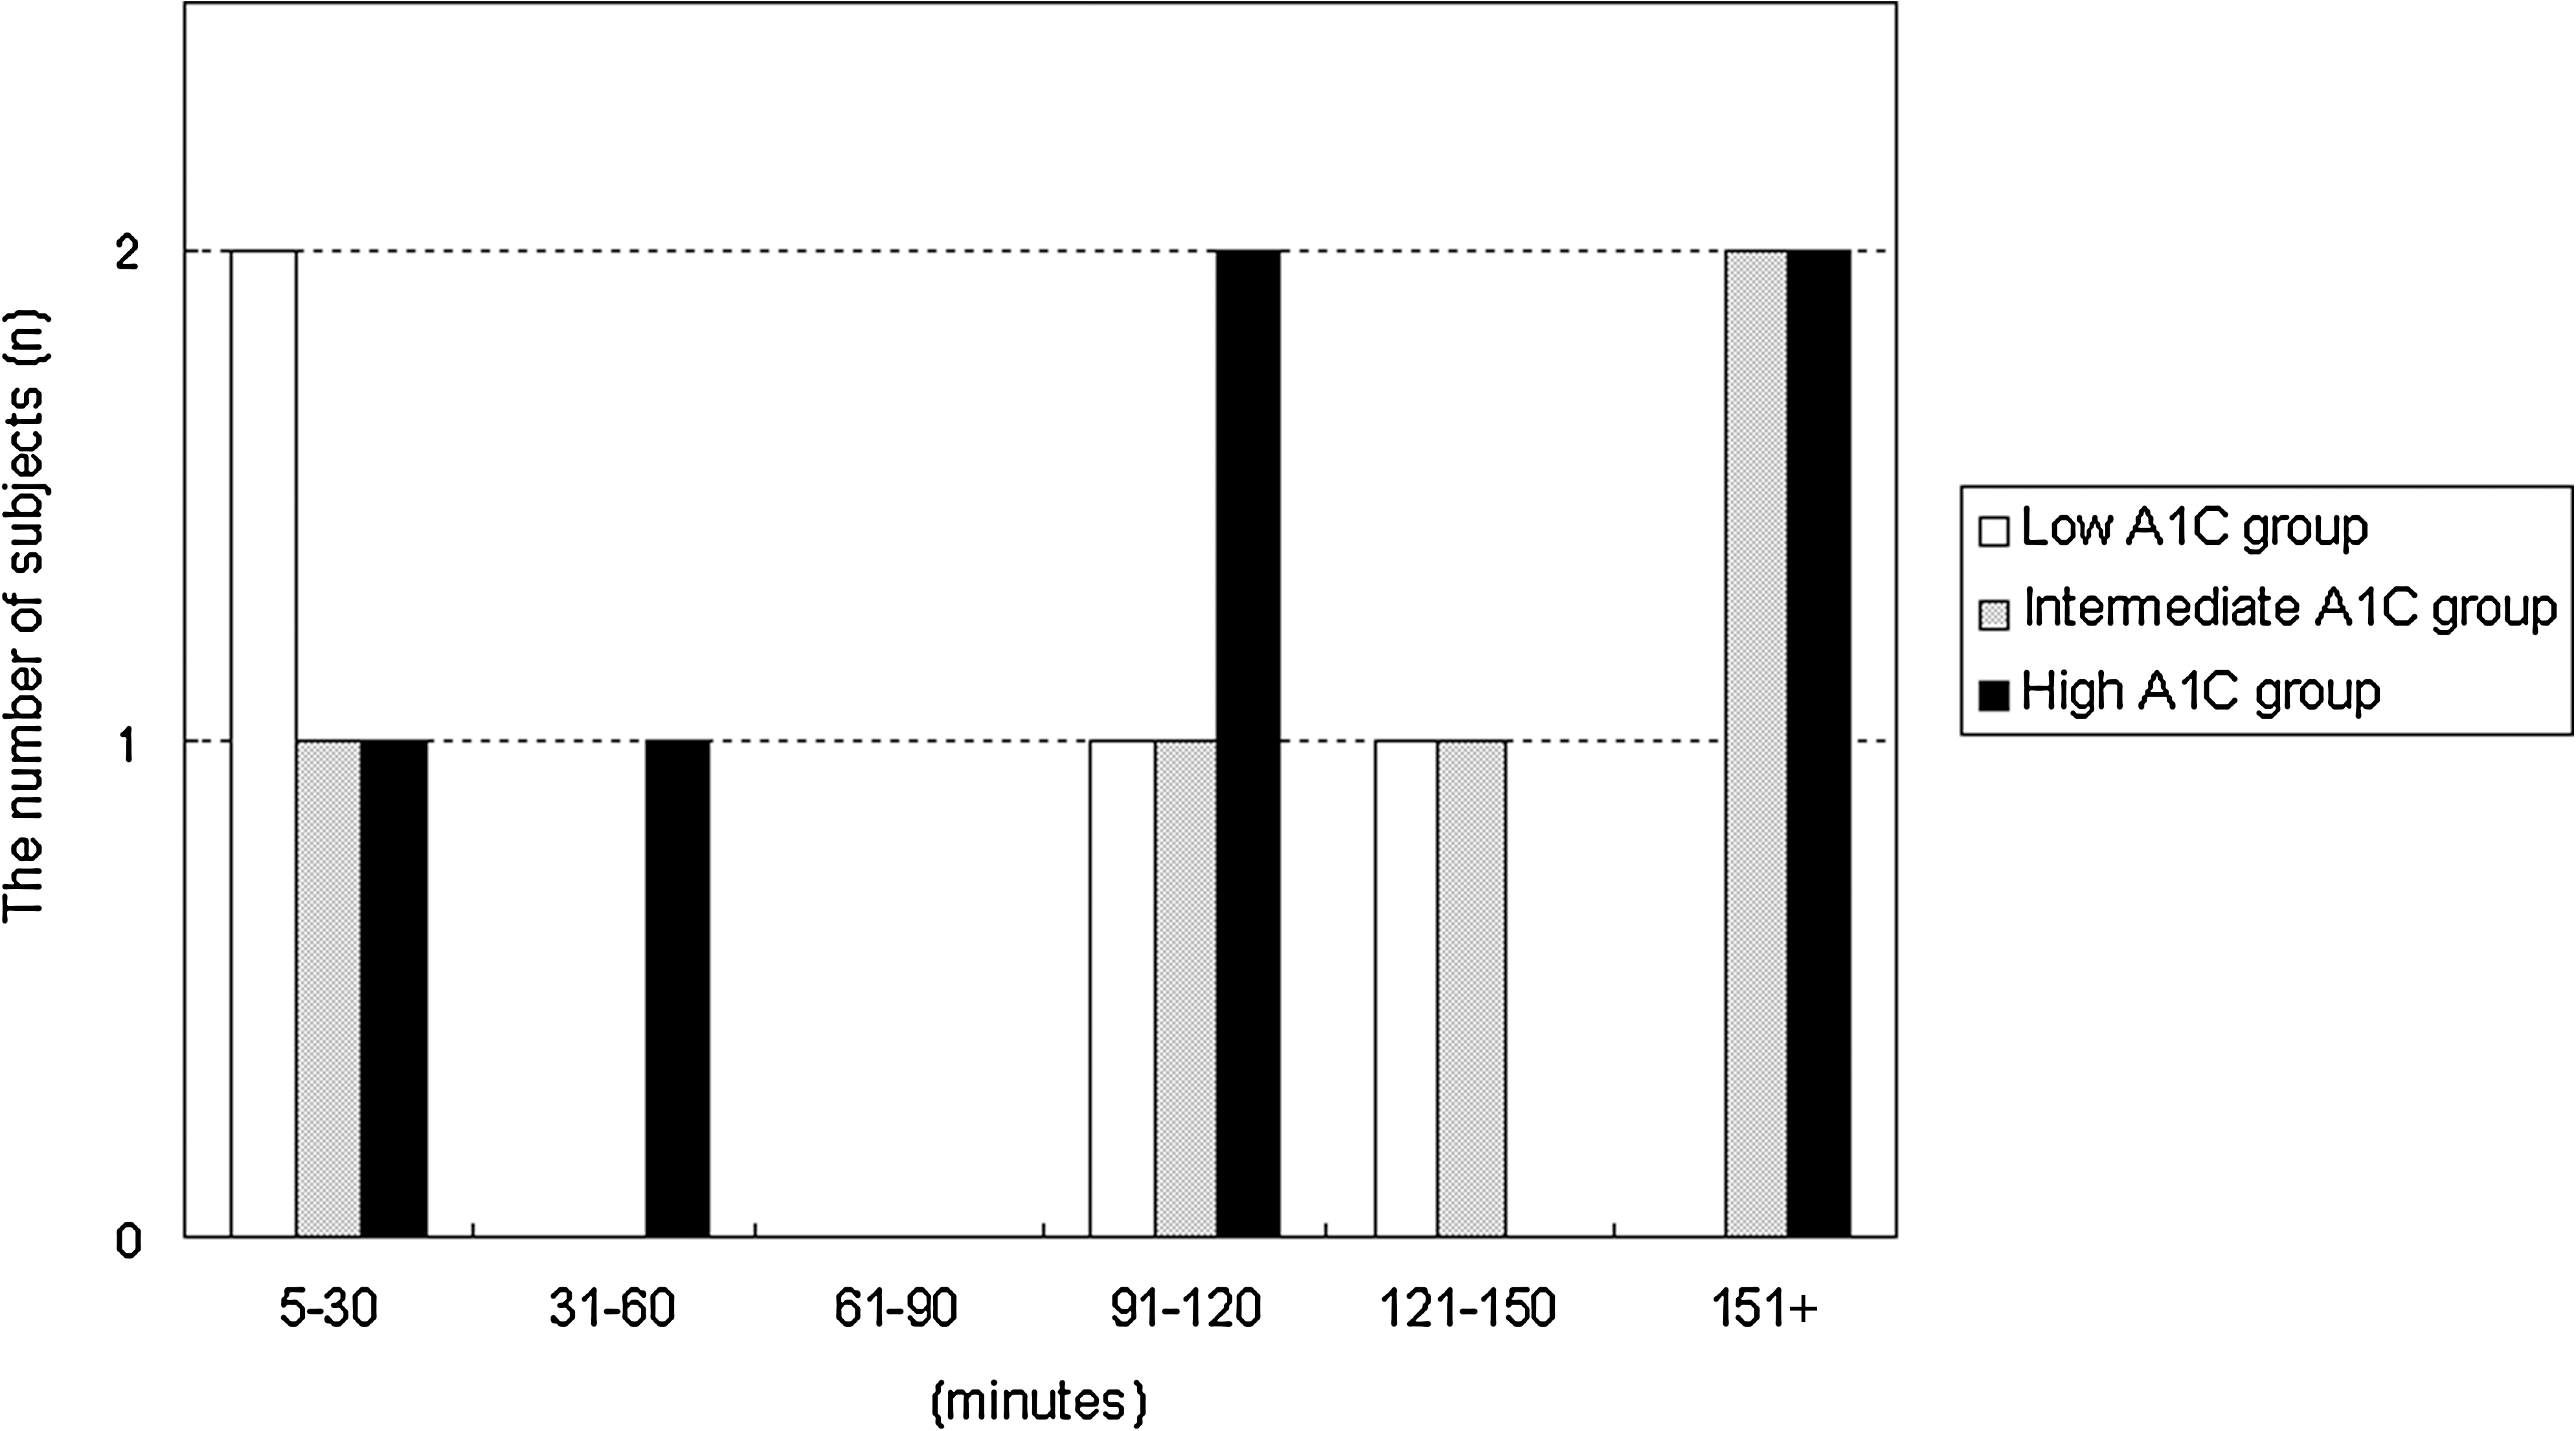
Total duration of hypoglycemia during the 24-h period in the low, intermediate, and high A1C groups. The low A1C group was defined as 6.0–7.2%, the intermediate A1C group as 7.3–8.6%, and the high A1C group as 8.7–10.9%.
Discussion
A1C is the gold standard for measuring glycemic control in people with diabetes, but it does not detect glucose variability. Therefore, treatments aimed at lowering A1C levels that result in an increased duration of hypoglycemia are not optimal. Currie et al.
12
reported that both lower and higher A1C values were associated with increased all-cause mortality and cardiac events with a
There is a limitation in detecting hypoglycemia using CGM. When measuring glucose with the CGMS System Gold, there is a 4–10-min difference between blood and interstitial glucose values; 14 it is also reported to be less accurate in measuring glucose during hypoglycemia. 15 In our study, the interstitial glucose values obtained with the CGMS System Gold were calibrated four times daily with self-monitoring of blood glucose values to correlate the data to the blood glucose values, although there still remained several minutes' time difference between measured values.
In conclusion, it is important when embarking on diabetes treatment based on A1C values to consider glucose variability. Therefore, more investigations are needed to examine whether “high-quality A1C,” defined as A1C values associated with minimum hypoglycemia and minimum glucose variability, prevents the development or progression of complications in patients with diabetes.
Footnotes
Acknowledgments
We are indebted to all the study participants. The authors also thank Ms. Kimie Shida for her helpful assistance.
Author Disclosure Statement
No competing financial interests exist.