
Abstract
Background:
Obstructive sleep apnea (OSA), a highly prevalent condition, is independently associated with increased risks of developing type 2 diabetes mellitus (T2D) and metabolic syndrome. It is unclear, however, if the severity of OSA has any impact on glycemic control among patients with T2D. We therefore aimed to determine the independent association between OSA severity and glycosylated hemoglobin (HbA1c) in patients with T2D.
Methods:
This was an observational cross-sectional study of 52 consecutive patients attending the diabetes obesity clinic between January 2008 to February 2010 with risk factors for sleep apnea and who underwent polysomnography study. Clinical, demographic, and lifestyle data were recorded using a questionnaire.
Results:
Prevalence of OSA in this clinical cohort was 58%. After adjusting for age, gender, body mass index, duration of diabetes, and insulin dose, increased severity of OSA was associated with increased HbA1c levels (P<0.014 for linear trend). A plateau effect between HbA1c and OSA severity was, however, noted from moderate to severe OSA levels. The adjusted mean values of HbA1c in each OSA category were 8.62% for none, 9.36% for mild, 10.61% for moderate, and 9.91% for severe. No significant associations were noted between liver transaminase level with OSA severity (P=0.324), between body mass index with OSA severity (P=0.278), or between HbA1c levels with the Epworth Score (a measure of daytime sleepiness) (P=0.46).
Conclusions:
Increased severity of OSA is independently associated with worsening glycemic control following adjustment of various confounders, including insulin dosage. We would hypothesize therefore that identification and treating OSA among patients with T2D may confer benefits in improving glycemic control.
Introduction
Although available data suggest that OSA is independently associated with altered glucose metabolism, it remains unclear whether OSA severity has any impact on glycemic control in patients with T2D. Given the difficulties in managing hyperglycemia in obese patients with T2D, understanding the association between OSA severity and glycemic control may be important when determining pharmacological and non-pharmacological strategies to achieve glycemic targets among obese patients with T2D. Furthermore, several observational studies have reported that continuous positive airway pressure (CPAP) therapy improved glycosylated hemoglobin (HbA1c), 12 postprandial glucose levels, 13 and insulin resistance 14,15 in patients with T2D, while increased sleep duration may also improve glycemic control. 16 Furthermore, CPAP therapy has been demonstrated to improve daytime sleepiness 17 and cognitive function, 18 both of which may indirectly improve glycemic control because of improvement in lifestyle choices. In this study, we investigated the independent association between OSA severity and glycemic control, measured by HbA1c levels, following adjustment for various relevant confounders.
Subjects and Methods
This was an observational cross-sectional study of consecutive patients with T2D attending the diabetes obesity clinic at the Sherwood Forest Hospitals Foundation Trust between January 2008 to February 2010 who are at risk of OSA based on an Epworth Score (a measure of daytime sleepiness) of >9 or the presence of obesity (body mass index [BMI] of >30 kg/m2) and who underwent a sleep study assessment. Clinical, demographic, and lifestyle data were recorded using a closed-questionnaire as part of the routine clinic visit assessment using a standard clinic protocol. Excess daytime sleepiness (EDS) was assessed by the Epworth Sleepiness Scale, a validated questionnaire containing eight items that measure a subject's expectation of dozing in eight hypothetical situations—widely used within routine clinical practice. A score of >10 is indicative of EDS and high risk of OSA. Oxygen desaturation index (ODI) was defined as the total number of desaturations of >4% per total sleep time (in hours). OSA severity categories were defined according to ODI cutoffs as follows: no OSA, ODI <5; mild OSA, ODI 5–10; moderate OSA, ODI 10–15; and severe OSA, ODI >15.
Sleep study assessment
All patients underwent a standard sleep study based on routine clinic indication, using the minimal patient contact sleep diagnosis system (VISI-3, Stowood Scientific Instruments Ltd., Oxford, UK), which included the following parameters: digital video/audio, calibrated sound level measurement, electrocardiography, R-R timing, pulse transit time, airflow, respiratory effort, body position, and movement. Oxyhemoglobin saturation was measured by pulse oximetry. A software package was used for downloading, viewing, reporting, and analysis of trend-recording oximeters and capnometers. Continuous nasal airflow delivery was by the Horizon™ nasal CPAP system (Sunrise/DeVilbiss, Carlsbad, CA).
Statistical analysis
Normally distributed data were presented as mean±SEM values, skewed data as the median (ranges), and categorical data as percentages. Categorical data were compared by Pearson's χ 2 test using univariate analysis. Pairwise comparisons of continuous variables in patients with and without OSA were examined by t test and confirmed by the non-parametric Mann–Whitney test. Unadjusted group differences across OSA severity categories were assessed by analysis of variance. A linear contrast was used to assess trend. Multivariate regression analysis was performed to investigate the independent associations between OSA severity and HbA1c values. Confounding variables that we included in multivariable models as covariates were age, sex, BMI, physical activity levels, duration of diabetes, Epworth Score, diabetes treatment including insulin therapies, and lipid and blood pressure parameters. Data were analyzed using SPSS version 14 software (SPSS Inc., Chicago, IL).
Results
Fifty-two patients were included in this analysis. Patients' demographic characteristics are summarized on Table 1. Patients' ages were between 29 and 77 years. BMI ranged from 30.1 to 52.0 kg/m2. The prevalence of OSA severity defined as no OSA (ODI<5), mild OSA (ODI 5–10), moderate OSA (ODI 10–15), and severe OSA were 42.3% (n=22), 15.4% (n=8), 13.5% (n=7), and 28.8% (n=15), respectively. Patients with or without OSA had similar age (54.4 vs. 53.7 years, P=0.81), BMI (37.0 vs. 35.7 kg/m2, P=0.33), duration of diabetes (9.6 vs. 9.2 years, P=0.84), and HbA1c levels (9.21% vs. 8.89%, P=0.46). Epworth Score (12.2 vs. 9.4, P=0.01), systolic blood pressure (152.6 vs. 138.1 mm Hg, P=0.003), and triglyceride (3.6 vs. 2.5 mmol/L, P=0.04) levels were significantly higher in patients with OSA compared with those without OSA. The findings of increased systolic blood pressure and triglyceride levels in patients with OSA are consistent with the independent association between OSA and metabolic syndrome. 3
Results are expressed in mean±SD values.
BMI, body mass index; BP, blood pressure; CVD, cardiovascular disease; HbA1c, glycosylated hemoglobin; NS, not significant; ODI, oxygen desaturation index.
After adjusting for age, gender, BMI, duration of diabetes, and insulin dose, increased severity of OSA was associated with increased HbA1c levels (P<0.014 for linear trend). A plateau effect was noted between HbA1c and OSA severity from moderate to severe OSA levels. The adjusted mean values of HbA1c in each OSA category were 8.62% for none, 9.36% for mild, 10.61% for moderate, and 9.91% for severe (Fig. 1). No significant associations were noted between liver transaminase level with OSA severity (P=0.324), between BMI with OSA severity (P=0.278), or between HbA1c levels with the Epworth Score (a measure of daytime sleepiness) (P=0.46) after adjusting for age, gender, BMI, duration of diabetes, and insulin dose.
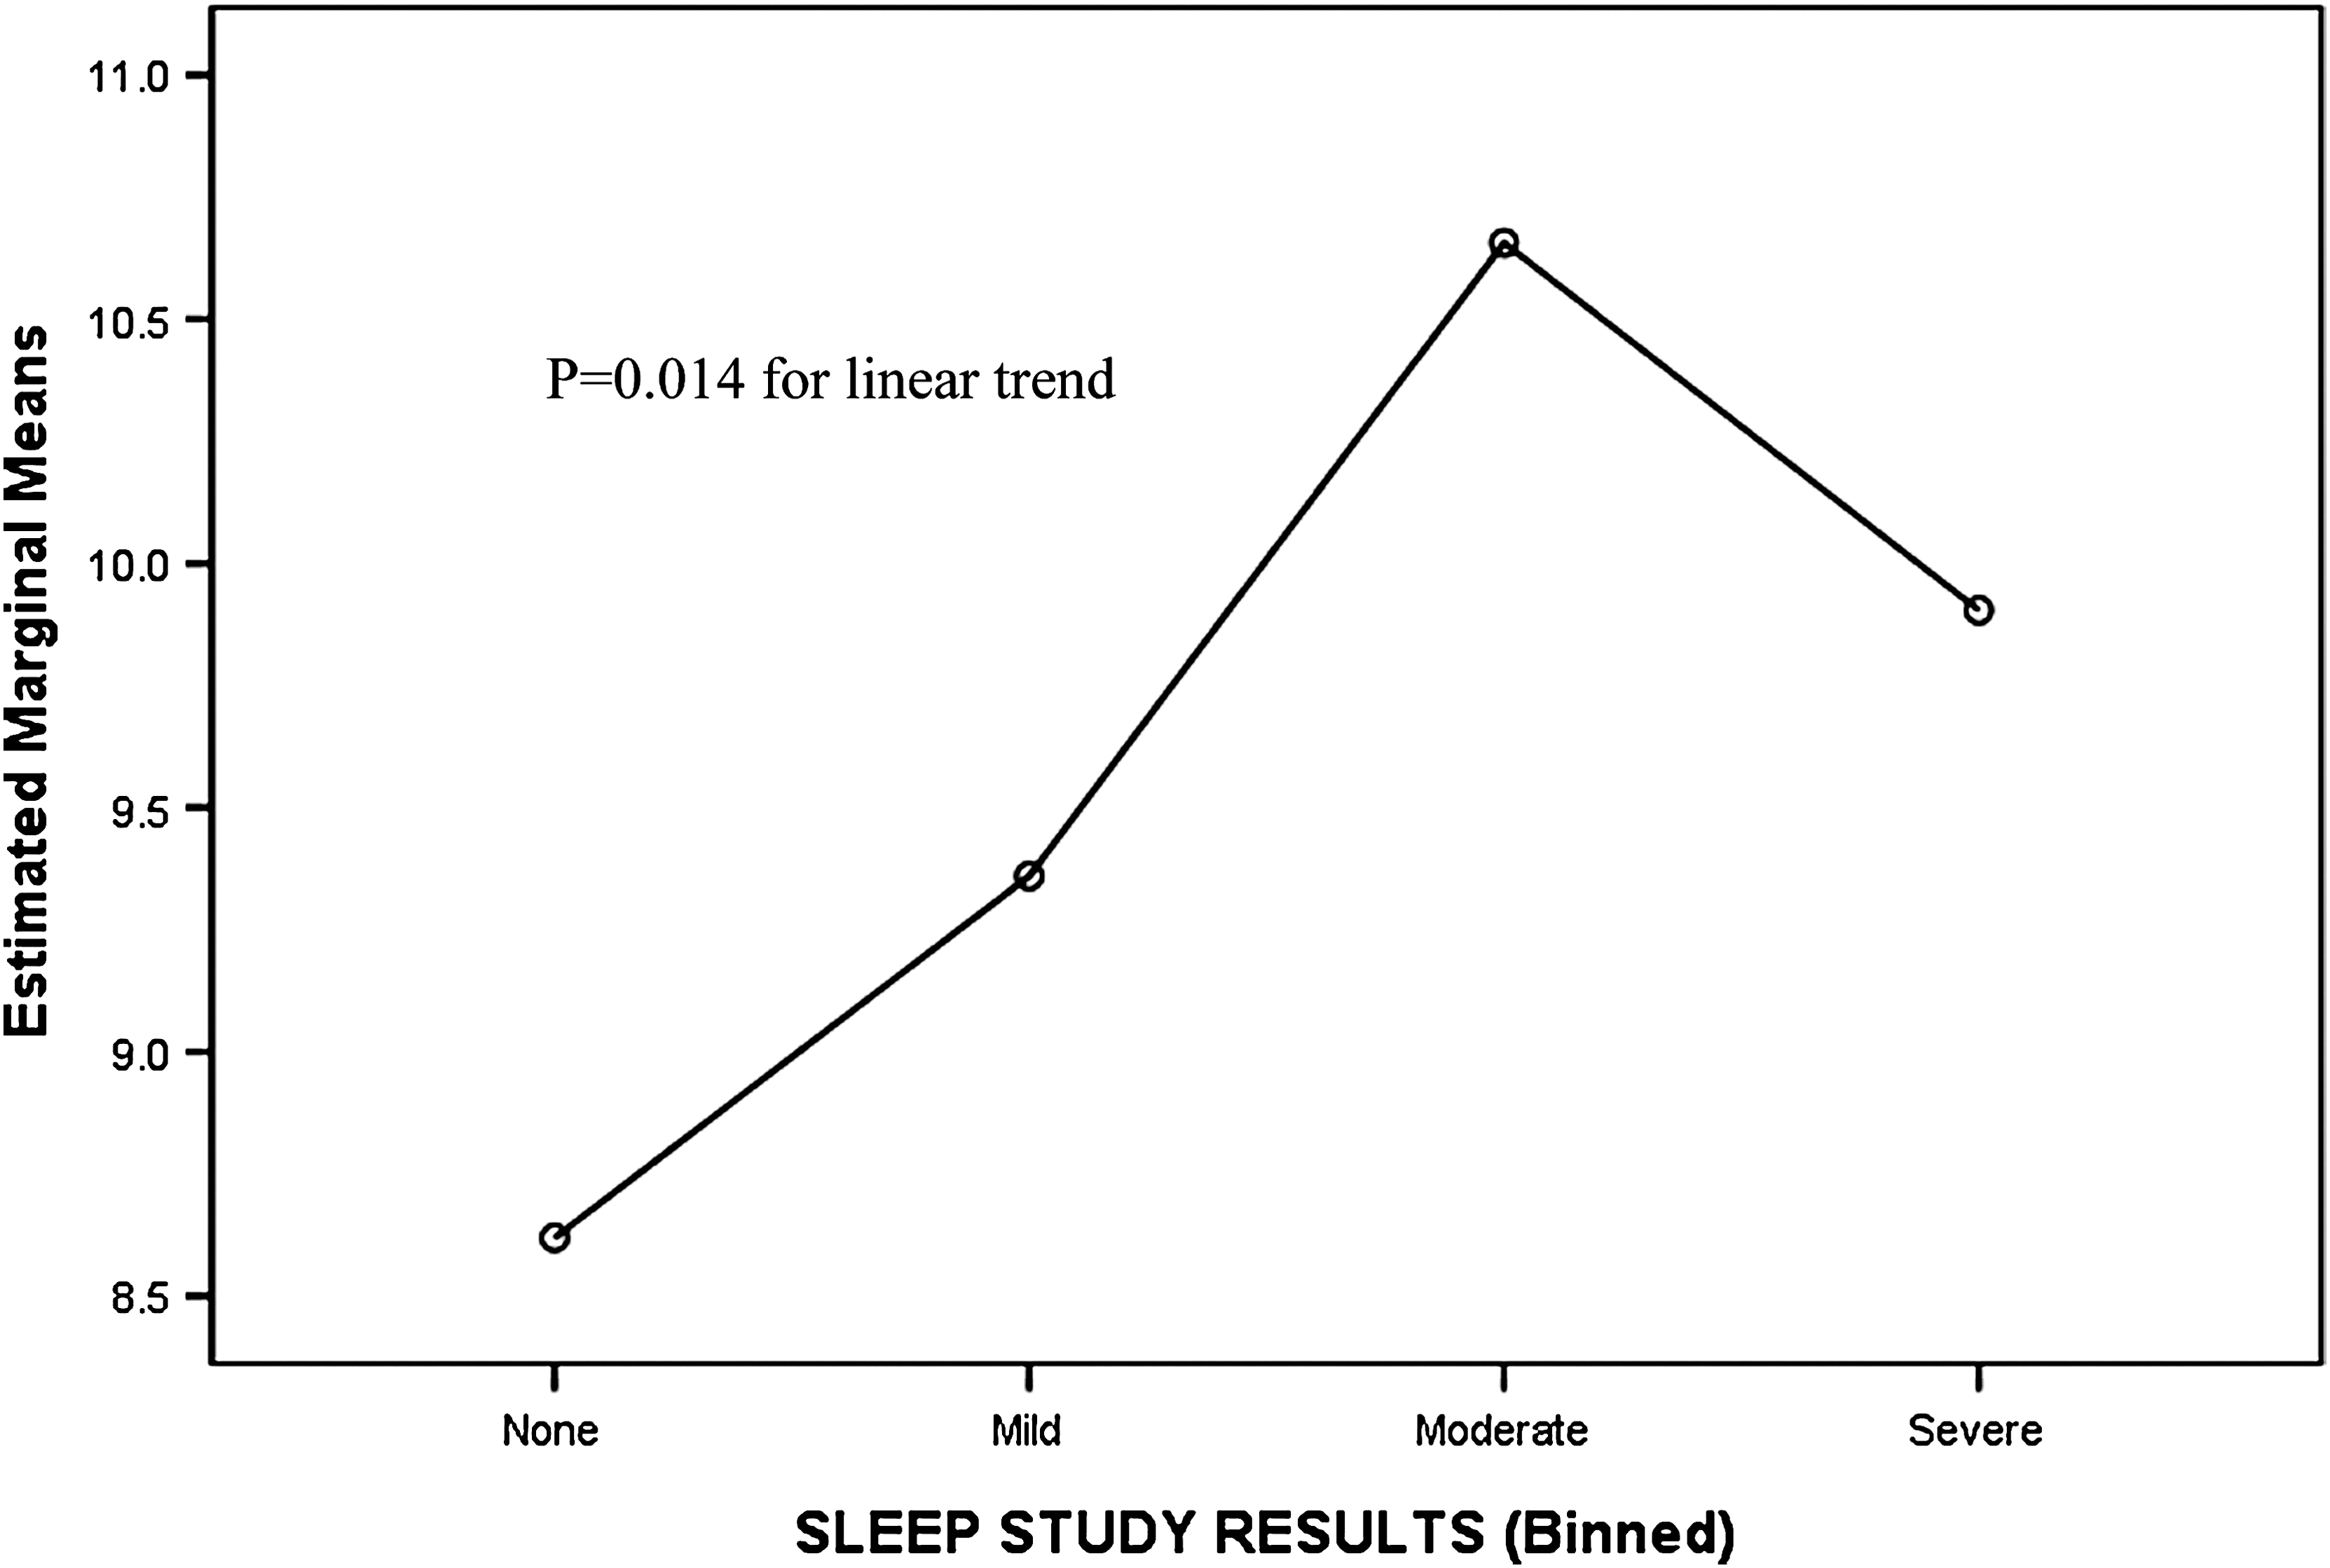
Adjusted mean glycosylated hemoglobin for patients with no, mild, moderate, and severe obstructive sleep apnea, adjusted for age, gender, body mass index, duration of diabetes, physical activity levels, blood pressure, and diabetes treatment (including insulin doses). Covariates appearing in the model are evaluated at the following values: age, 52.69 years; duration of diabetes, 8.76 years; systolic blood pressure, 145.37 mm Hg; diastolic blood pressure, 85.88 mm Hg; insulin, 55.47 IU; body mass index, 36.78874683328461 kg/m2. The x-axis gives the degree of sleep apnea severity, defined as none (oxygen desaturation index<5) (n=22), mild (oxygen desaturation index 5–10) (n=8), moderate (oxygen desaturation index 10–15) (n=7), and severe (oxygen desaturation index>15) (n=15) obstructive sleep apnea. The y-axis gives the mean glycosylated hemoglobin values (in %).
Discussion
This study demonstrated a significant association between OSA severity with HbA1c levels in patients with T2D prior to CPAP therapy after adjustment for various confounders, which include age, sex, BMI, duration of diabetes, Epworth Score, lipid, blood pressure parameters, and diabetes treatment, including insulin therapies. The clear graded increase in HbA1c with OSA severity was evident for mild (ODI 5–10) and moderate (ODI 10–15) OSA severity, and no further rise in HbA1c was observed in patients with severe OSA (ODI >15). In contrast to our previous observation of the association between Epworth Score with HbA1c levels, 19 no significant association was noted between HbA1c levels and the Epworth Score after adjusting for age, gender, BMI, duration of diabetes, and insulin dose in this study. Similarly, we did not observe any significant association between BMI and OSA severity. The observation from this study, however, support findings from a recent study that showed that increased OSA severity is associated with poorer glycemic control in patients with T2D. 20
This present study was not designed to investigate the impact of CPAP therapy and other strategies to reduce OSA severity on glycemic control. It is, however, tempting to speculate that improvements in OSA severity by virtue of reduced sympathetic hyperactivity and adverse neurohormonal activation may play some role in improving glucose control. Furthermore, longer sleep duration has been shown to reduce the risk of developing obesity and diabetes. 21 To date various observational studies have reported reductions in HbA1c levels with CPAP therapy. 12,13 These generally supportive findings, however, were contradicted by the findings of the only randomized controlled trial reported to date, which showed no benefit after 3 months of therapeutic CPAP compared with the sham CPAP control group. 22 This study, however, which only included 19 patients in the therapeutic CPAP group and 20 in the sham CPAP group, had power to detect only a 0.8% difference in HbA1c assuming 20 individuals were allocated to each treatment group. The negative findings from that study may also have arisen, at least in part, from low compliance in the active treatment group, with mean use of only 3.3 h/night overall and use for 1 h or less by 26% of participants. Evidence suggests that the symptoms of EDS is normalized only after around 4 h of CPAP treatment per night. Thus cardiovascular and metabolic benefits may require longer duration of CPAP therapy. Further well-powered and strictly adherent studies are required to determine whether CPAP therapy improves glycemic control in patients with T2D.
To date, only two previous studies have examined the association between OSA severity and HbA1c levels. Our observation support findings from a study by Aronsohn et al., 20 which showed that increasing severity of OSA is associated with poorer glucose control independent of obesity and other relevant confounders. In contrast to the linear trend between OSA severity and HbA1c level reported by Aronsohn et al., 20 no further rise in HbA1c level was seen as OSA severity increased from moderate to severe. The “plateau” effect observed here may suggest that among patients with severe OSA, the mechanism linking OSA severity with HbA1c level is likely to be multifactorial, involving not only intermittent hypoxia, sleep fragmentation, and sympathetic hyperactivation but also dysregulation of neurohormonal, metabolic, and inflammatory pathways that regulates energy expenditure, appetite, metabolic rate, and vascular risks. The multifactorial association mentioned here is particularly relevant in view of the higher BMI and HbA1c levels among patients analyzed in this study compared with the study by Aronsohn et al. 20 (37.0 vs. 35.3 kg/m2 and 9.2% vs. 7.8%, respectively). Acute improvement in insulin sensitivity, for example, has been observed in less obese patients compared with obese individuals, suggesting perhaps in obese individuals 23 insulin sensitivity is driven by factors other than disturbances in sleep parameters per se. In contrast to observations by Aronsohn et al. 20 as well as from this study, Einhorn et al., 24 however, did not observe significant association between HbA1c and OSA severity in their study. This is likely to be due to the short duration of polysomnography recording in that study compared with the overnight recordings (>5 h) in our study. The mean HbA1c is higher in our study compared with others may reflect the higher prevalence of obesity in our population.
The management of obese individuals with diabetes is challenging and will often require multifactorial intervention above and beyond pharmacological therapies. In view of the rising prevalence of obesity and the significant association between sleep apnea and impaired glucose metabolism, strategies to identify patients with sleep apnea within the routine clinical setting are important. Our data furthermore suggest a significant association between HbA1c levels and OSA severity and form a basis for the need to undertake a well-powered intervention study looking at the impact of CPAP therapy on glycemic control in patients with diabetes and sleep apnea.
Footnotes
Author Disclosure Statement
No competing financial interests exist.