
Abstract
Background:
Monitoring postprandial hyperglycemia is crucial in treating diabetes, although its dynamics make accurate monitoring difficult. We developed a new technology for monitoring postprandial hyperglycemia using interstitial fluid (ISF) extraction technology without blood sampling. The glucose area under the curve (AUC) using this system was measured as accumulated ISF glucose (IG) with simultaneous calibration with sodium ions. The objective of this study was to evaluate this technological concept in healthy individuals.
Methods:
Minimally invasive ISF extraction technology (MIET) comprises two steps: pretreatment with microneedles and ISF accumulation over a specific time by contact with a solvent. The correlation between glucose and sodium ion levels using MIET was evaluated in 12 subjects with stable blood glucose (BG) levels during fasting. BG and IG time courses were evaluated in three subjects to confirm their relationship while BG was fluctuating. Furthermore, the accuracy of glucose AUC measurements by MIET was evaluated several hours after a meal in 30 subjects.
Results:
A high correlation was observed between glucose and sodium ion levels when BG levels were stable (R=0.87), indicating that sodium ion is a good internal standard for calibration. The variation in IG and BG with MIET was similar, indicating that IG is an adequate substitute for BG. Finally, we showed a strong correlation (R=0.92) between IG-AUC and BG-AUC after a meal.
Conclusions:
These findings validate the adequacy of glucose AUC measurements using MIET. Monitoring glucose using MIET without blood sampling may be beneficial to patients with diabetes.
Introduction
Since the DECODE/DECODA study demonstrated the risk of hyperglycemia after a glucose load, 6 increased importance has been given to postprandial hyperglycemia management. The International Diabetes Federation has published guidelines for postprandial hyperglycemia management 7 that recommend that SMBG should be considered because it is currently the most practical method for monitoring postprandial glycemia. However, wide variations in glycemic excursions make accurate postprandial hyperglycemia estimation using SMBG difficult. Furthermore, frequent blood sampling is impractical for daily SMBG. Although recently developed CGM technology provides useful information, it is burdensome and invasive for patients. These repeated adverse experiences cannot be neglected.
Therefore, we have developed a new technology that extracts and accumulates ISF for monitoring postprandial hyperglycemia without blood sampling. Minimally invasive ISF extraction technology (MIET) uses a newly developed microneedle array to pretreat the skin to extract ISF. A reservoir is then placed on the pretreated area to accumulate ISF for a specific period. The ISF extraction level is determined as the glucose area under the curve (AUC) during this time and is measured by analyzing the glucose levels in the reservoir, with simultaneous calibration with sodium ions.
In this study, we evaluated MIET concepts by examining sodium ion calibration, analyzing the relationship between BG and IG when BG was fluctuating, and estimating the accuracy of AUC measurements after a meal in healthy subjects, as a preliminary study before evaluating patients with diabetes.
Subjects and Methods
AUC measurement principle
MIET comprises two steps (Fig. 1). First, a microneedle array is stamped on the forearm skin as a pretreatment to form micropores for enhancing ISF extraction (Fig. 1A). The penetration depth of each microneedle was estimated to be approximately 0.1 mm (data not shown), thus causing no bleeding or pain. Second, a reservoir containing solvent is placed on the pretreated area to accumulate ISF for a specific period (Fig. 1B). The glucose AUC for the collection time was measured by analyzing glucose levels in the reservoir with simultaneous calibration with sodium ions as an internal standard for ISF extraction. No additional force is needed to extract ISF from the skin, except passive diffusion and osmotic pressure.
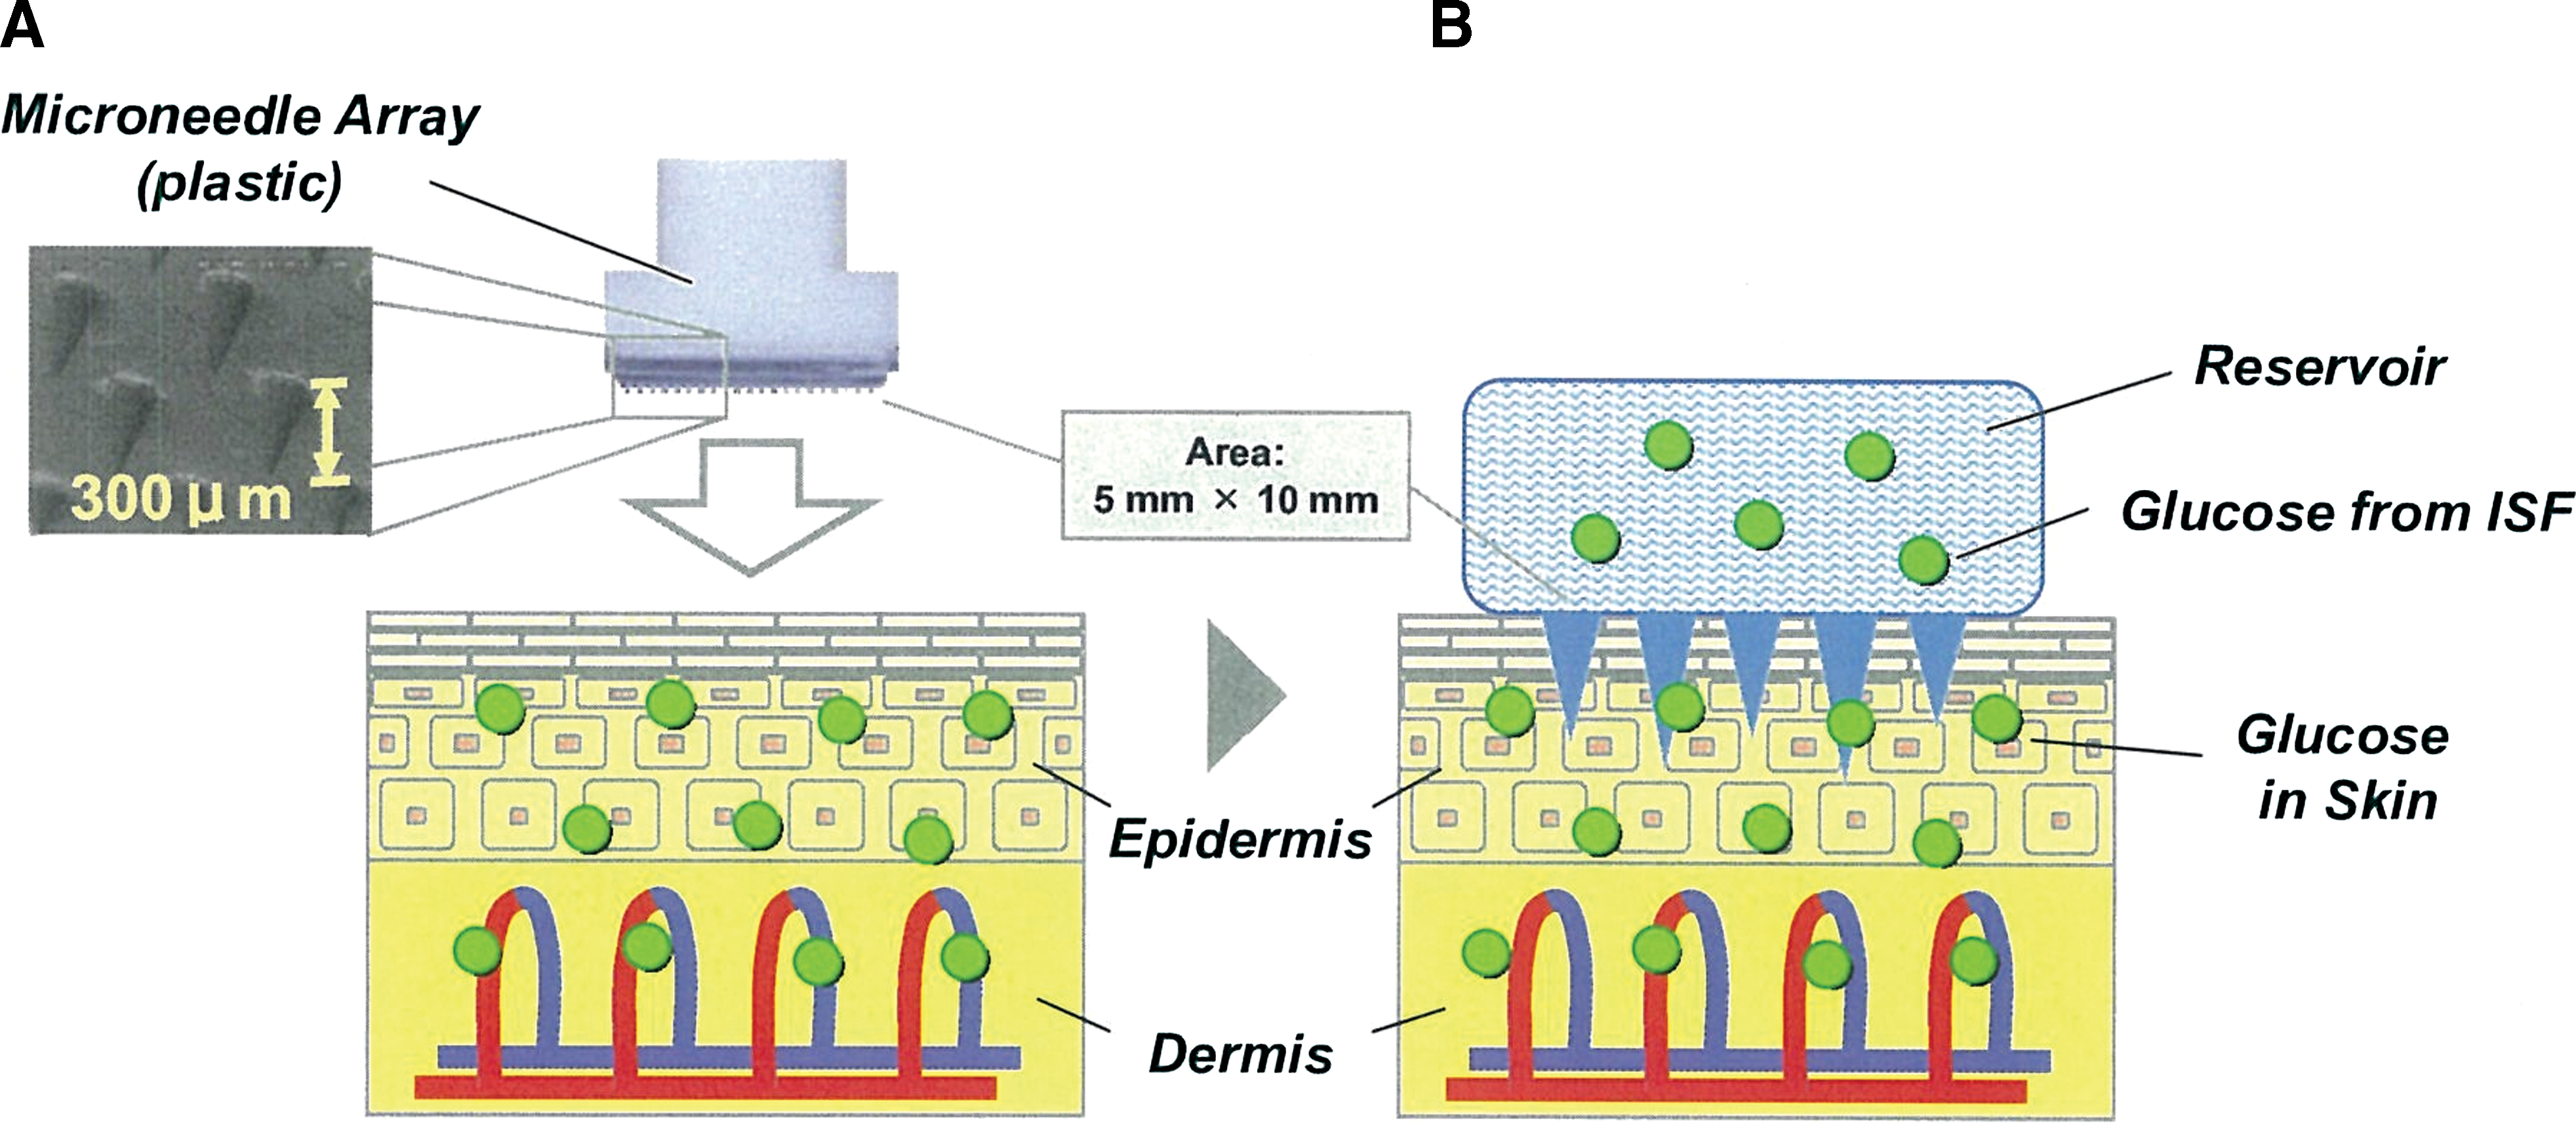
Steps of minimally invasive interstitial fluid (ISF) extraction technology. (
Figure 2 shows the AUC measurement principle using MIET. The rates of glucose extraction through micropores depend on the glucose levels in ISF, assuming ISF extraction rates are stable. If IG levels correspond to BG levels, glucose extraction rates correlate with BG. When BG levels are low at the onset of reservoir attachment, the extraction rates are low (Fig. 2A). If BG levels increase, the extraction rates also increase (Fig. 2B). After a specific period, the extracted glucose levels in the reservoir are theoretically equivalent to BG-AUC (Fig. 2C), unless back-diffusion of the extracted glucose from the reservoir occurs. Appropriate calibration is required because ISF extraction rates change with time, and hence we used sodium ion as the internal standard for this purpose. Furthermore, sodium ions were used to calibrate differences in the initial ISF extraction level, which is dependent on the formation of the skin micropores.
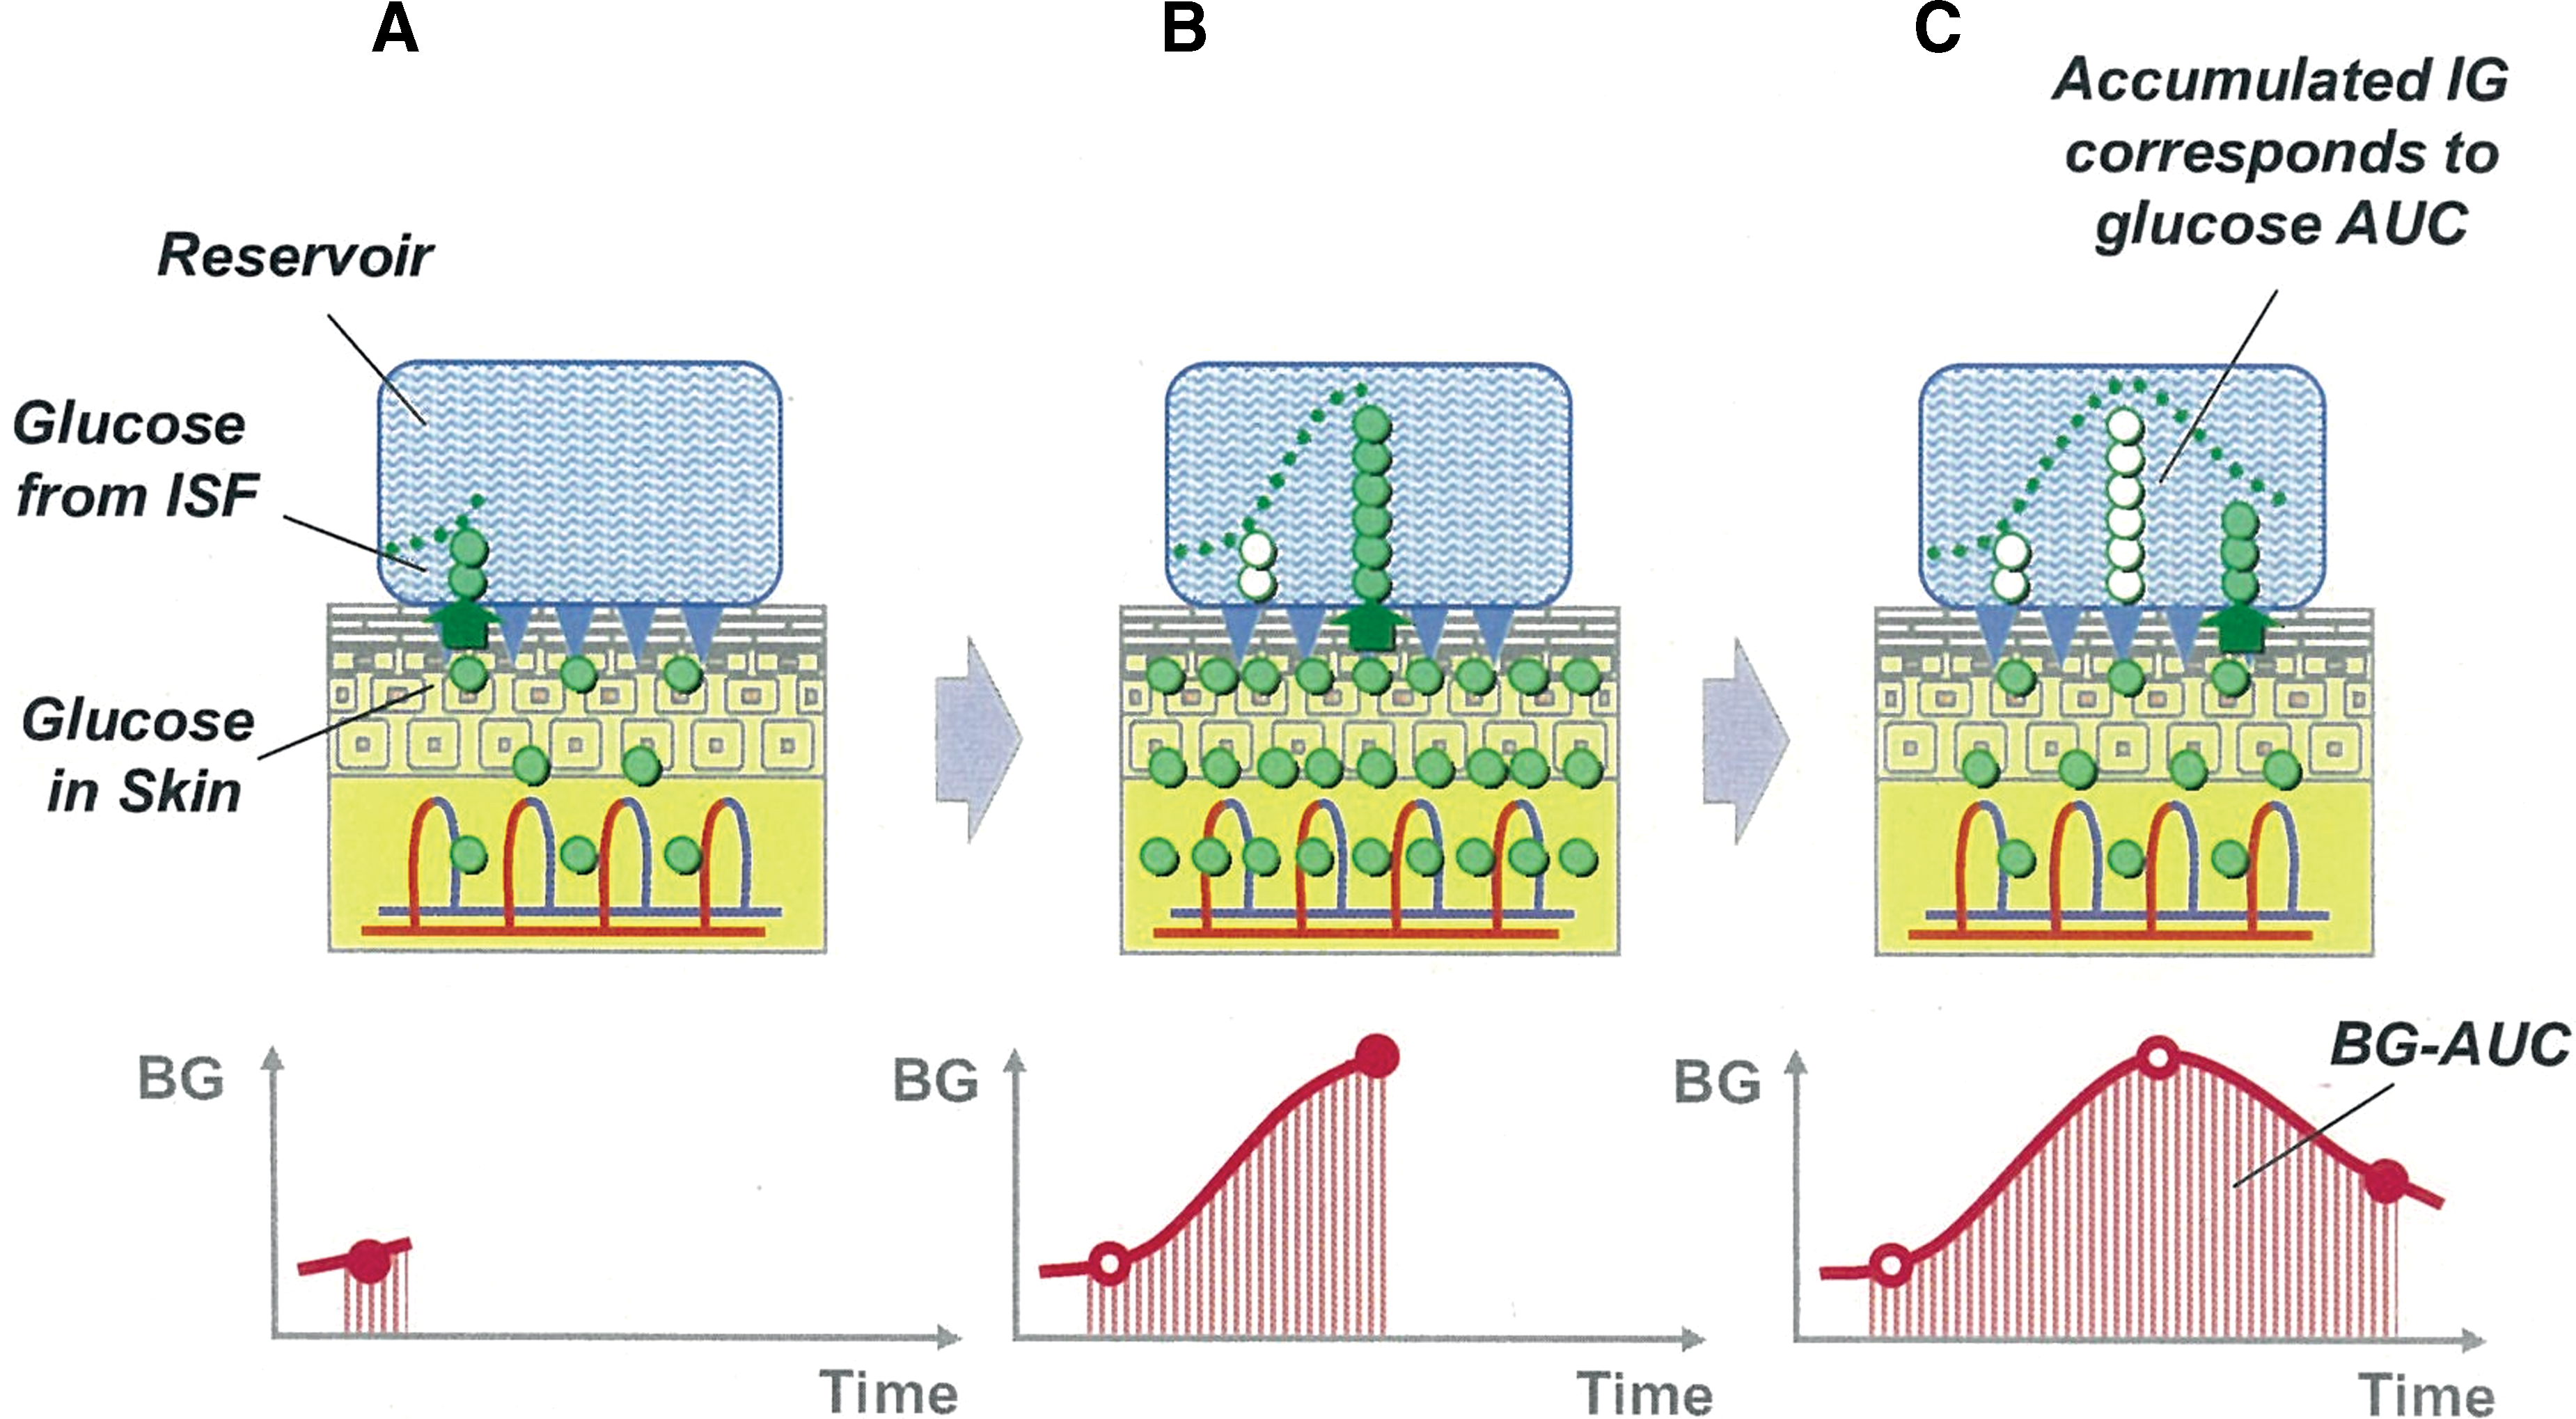
Images of interstitial fluid (ISF) glucose (IG) accumulation. (
The detailed analytical principles of the method are as follows:
M
glu (in nmol) and M
Na (in nmol), which represent the total levels of glucose and sodium ions in the reservoir after a specific period, respectively, are expressed as follows:
where T (in h) represents the extraction period, A (in cm2) is the ISF extraction area, J glu (in nmol/h) and J Na (in nmol/h) are the respective glucose and sodium ion extraction rates, C glu (in nmol/cm3) and C Na (in nmol/cm3) are the respective ISF glucose and sodium ion concentrations, and P glu (in cm/h) and P Na (in cm/h) are the respective glucose and sodium ion permeabilities. In Eq. 2, C Na is a constant value because sodium ion concentrations in ISF are not dependent on time.
We hypothesized that P
glu correlates with P
Na as shown in Eq. 3:
where α and β are the calibration values between glucose and sodium ion permeabilities through the micropores caused by the microneedle array. Equation 3 is substituted into Eq. 1 as follows:
Because it is difficult to monitor the time course of P
Na, therefore the following approximation was adopted using Eq. 2:
where
Using M glu and M Na measured in the reservoir after period T, the glucose AUC is calculated from Eq. 6 using predefined constant values. We defined the glucose AUC calculated using Eq. 6 as IG AUC (IG-AUC).
Apparatus and materials
The microneedle arrays were made of polycarbonate, and the length of each needle was 0.3 mm. Each array had 305 needles and covered approximately 50 mm2. The microneedle applicator for stamping on the skin was a handheld system that used a spring action for stamping. The stamping speed was approximately 6 m/s.
Two types of reservoirs were used to collect ISF: one was a plastic chamber containing 1.2% KCl solution (Wako Pure Chemical Industries, Osaka, Japan), and the other was a hydrogel patch containing a hydrogel and adhesive tape (KP; Nichiban, Tokyo, Japan). The hydrogel contained polyvinyl alcohol with 2% KCl solvent.
The glucose analysis reagent comprised four enzymes and a dye in phosphate buffer solution. Each 0.1 mL of phosphate buffer solution contained 2.6 U of glucose oxidase, 0.023 U of mutarotase, 0.25 U of peroxidase, 0.49 U of ascorbic acid oxidase (all obtained from Wako Pure Chemical Industries), and 0.016 mL of Amplex red solution (Molecular Probes, Eugene, OR).
Evaluation procedure for sodium ion calibration
The correlation between glucose and sodium ion levels was evaluated in 16 healthy volunteers (20–50 years old) with stable BG levels. All tests were performed in a fasting state, and BG levels were confirmed by SMBG at the forearm (Freestyle Freedom® [Abbott Diabetes Care, Alameda, CA], obtained from Nipro, Osaka).
To extract ISF, the forearm skin was first wiped with an antiseptic (Alwety one, Osaki Medical, Nagoya, Japan), and the microneedle array was stamped using an applicator. A plastic chamber for ISF accumulation was then attached to the pretreated area and filled with KCl solvent. Solvents were changed thoroughly every 10 min for 120 min.
Evaluation procedure for BG and IG time courses
BG and IG time courses were evaluated in three healthy volunteers (20–40 years old). IG-AUCs were measured simultaneously for 1, 2, and 3 h. All tests were initiated in a fasting glucose state and confirmed by SMBG at the forearm.
After the forearm skin was wiped with the antiseptic, the microneedle array was stamped at nine sites using the applicator, and plastic chambers for ISF accumulation were attached to three microneedle array-pretreated sites. Hydrogel patches were attached simultaneously to six sites. Subjects ate a meal 45 min after pretreatment. KCl solvents in the plastic chambers were changed thoroughly every 15 min for 180 min. Capillary BG levels were measured every 15 min for 180 min by SMBG at the forearm. Two hydrogel patches were removed every hour for 3 h to estimate IG-AUCs.
Evaluation of correlation between BG-AUC and IG-AUC after a meal
The correlation between BG-AUC and IG-AUC was evaluated in 30 healthy volunteers (20–50 years old). After the forearm skin was wiped with the antiseptic, the microneedle array was stamped at four sites using an applicator, and the hydrogel patches were attached to all pretreated sites. The volunteers then ate a meal. Capillary BG levels were measured every 30 min for 180 min by SMBG at the forearm. After 2 and 3 h, two hydrogel patches were removed, respectively, and their contents were analyzed. The SMBG data were analyzed using trapezoidal approximation to calculate the reference BG-AUC.
Analysis of glucose and sodium ion levels
Hydrogels were immersed overnight in 5 mL of pure water to extract glucose and sodium ions. To measure glucose, 0.1 mL of sample solution was mixed with 0.1 mL of glucose analysis reagent and incubated for 60 min, and the fluorescence intensity of Amplex Red was measured using a fluorescence plate reader (GENious, TECAN, Tokyo). Sodium ion levels were analyzed using a DX-500 ion chromatography system (Dionex, Bannockburn, IL).
Ethical considerations
The ethics committee of Sysmex Corp. (Kobe, Japan) approved all protocols. All healthy volunteers were recruited by Sysmex Corp. Written informed consent was obtained from all subjects.
Results
Correlation between glucose and sodium ion permeability
We first examined the validity of glucose calibration using sodium ions by analyzing the correlation between glucose and sodium ion permeabilities. Figure 3A shows representative time courses of glucose and sodium ion permeabilities at the pretreatment skin sites from different subjects (sites A and B) with stable BG levels. Both glucose and sodium ion levels were high at site A and low at site B. Time courses of glucose and sodium ion permeabilities corresponded well at each site, indicating that when glucose levels are stable, glucose extraction rates can be estimated from sodium extraction rates.
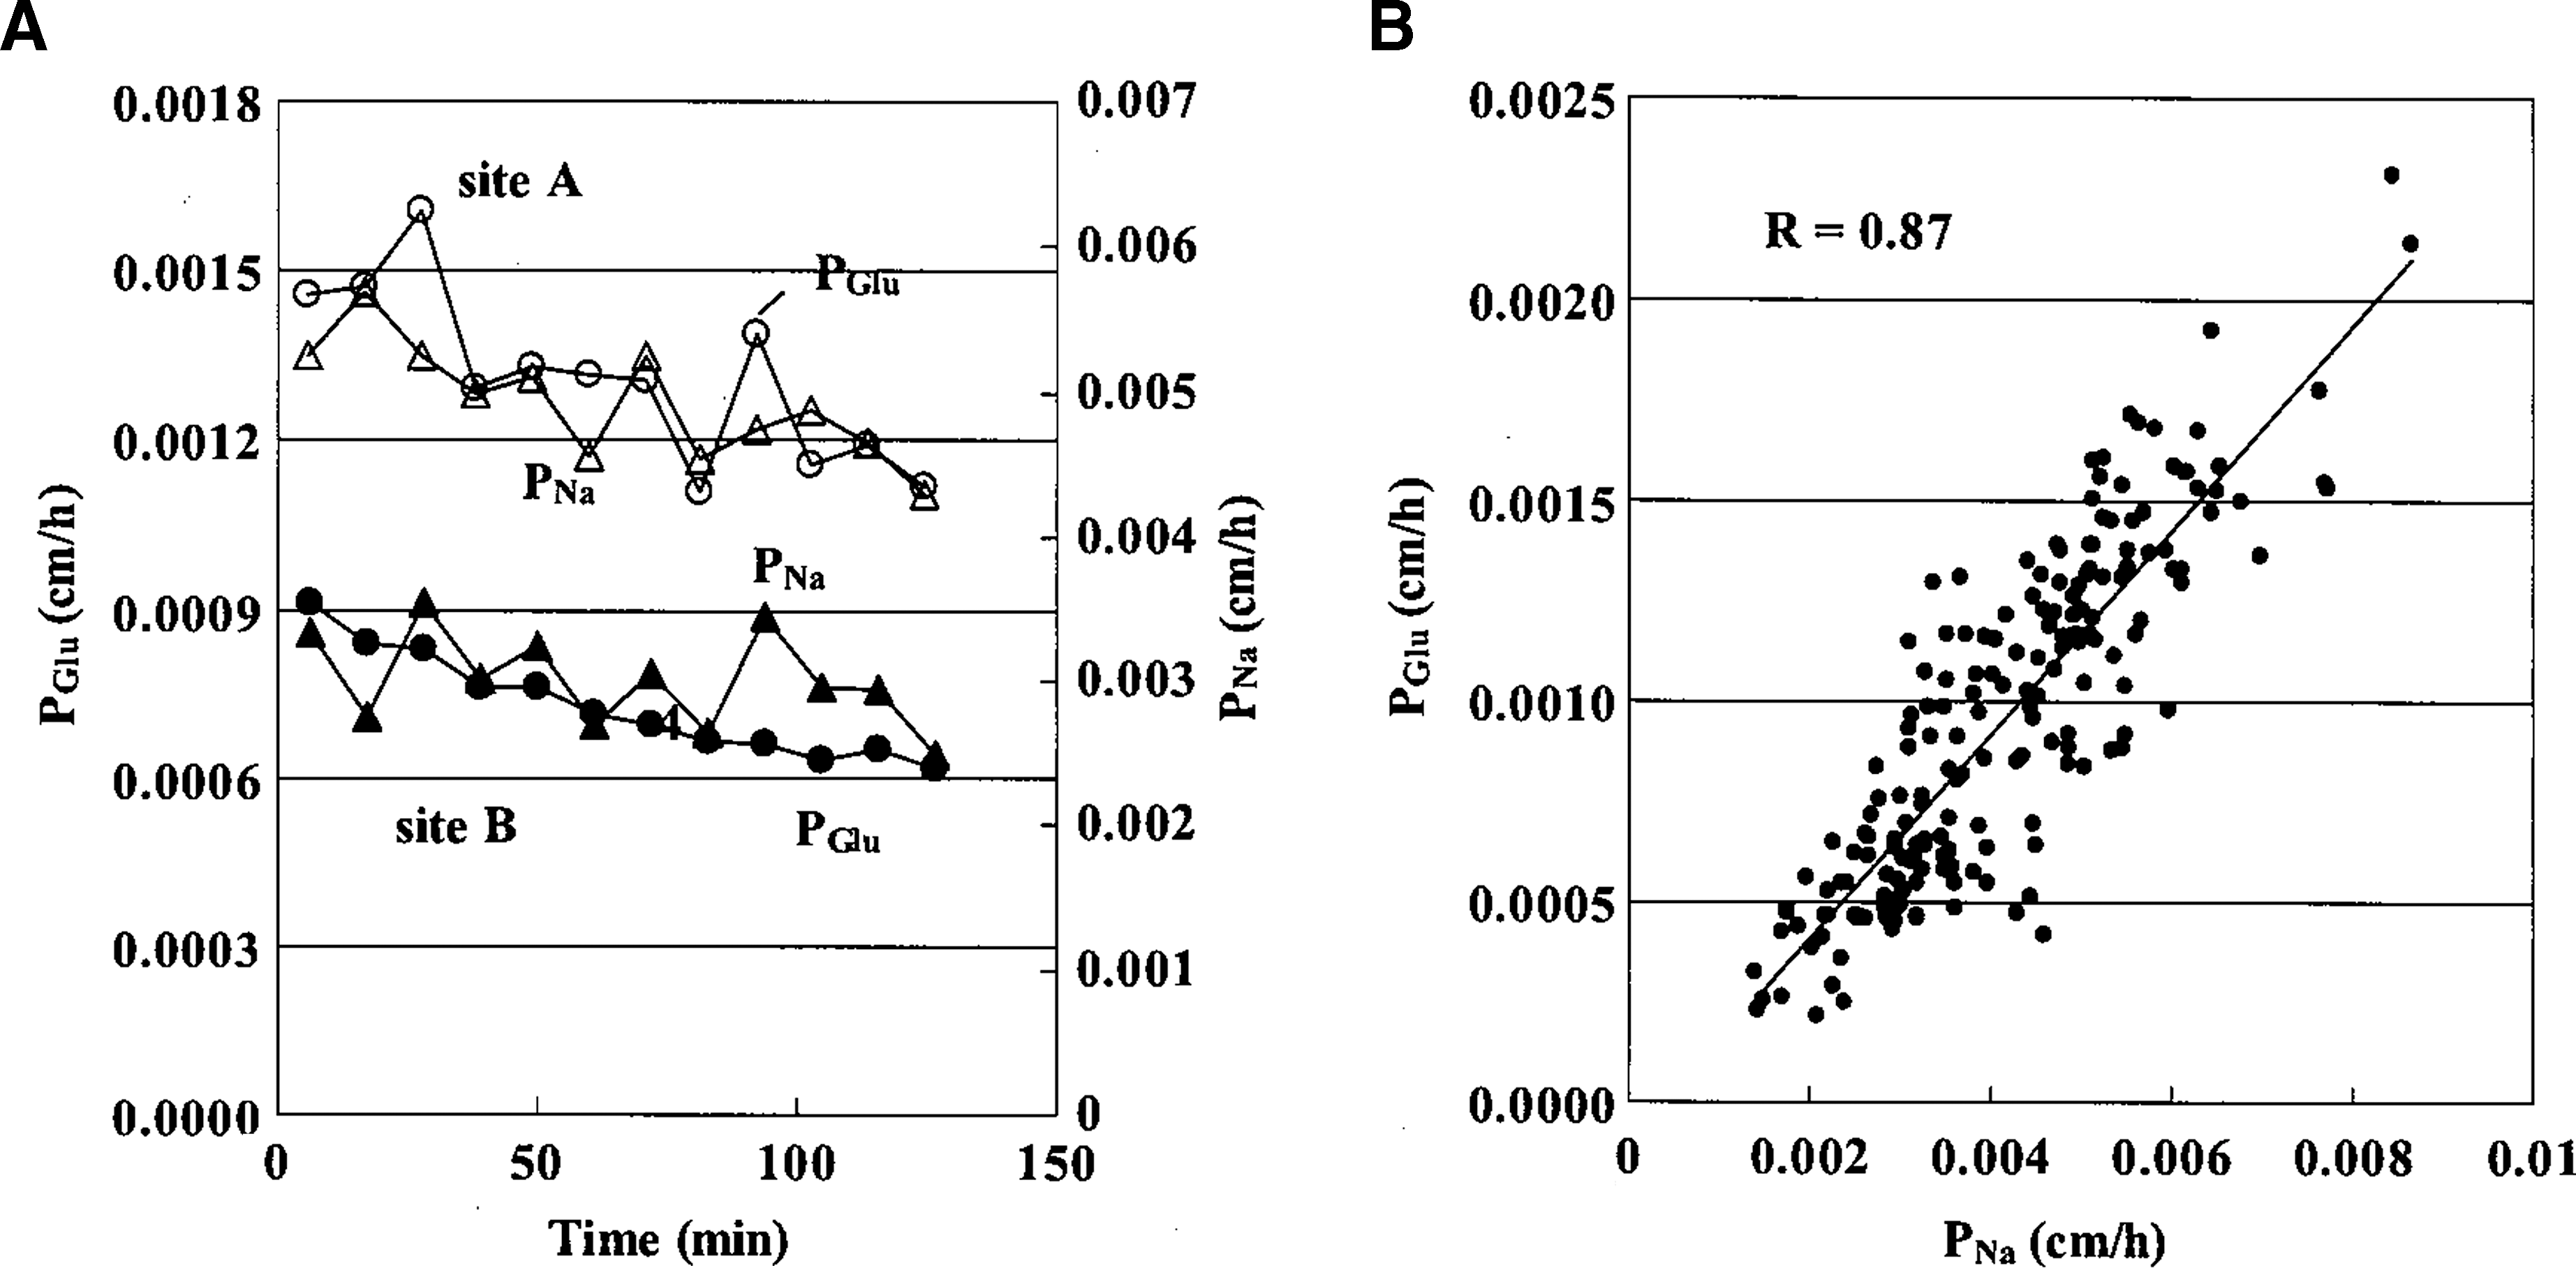
Calibration with sodium ions. (
Figure 3B shows the correlation between glucose and sodium ion permeabilities in 16 healthy subjects (four points were excluded because of the measurement error). The high correlation (R=0.87) confirmed the adequacy of Eq. 3 (i.e., calibration with sodium ions).
IG and BG time courses
IG and BG time courses were analyzed to investigate whether IG variation was coupled with BG variation. Figure 4 shows representative IG and BG time courses before and after a meal. IG levels calibrated with sodium ions are shown as AUC for every 15 min because IG represents AUC for extraction time. We observed that IG was closely correlated with BG within the limited range of glucose variations in healthy volunteers.
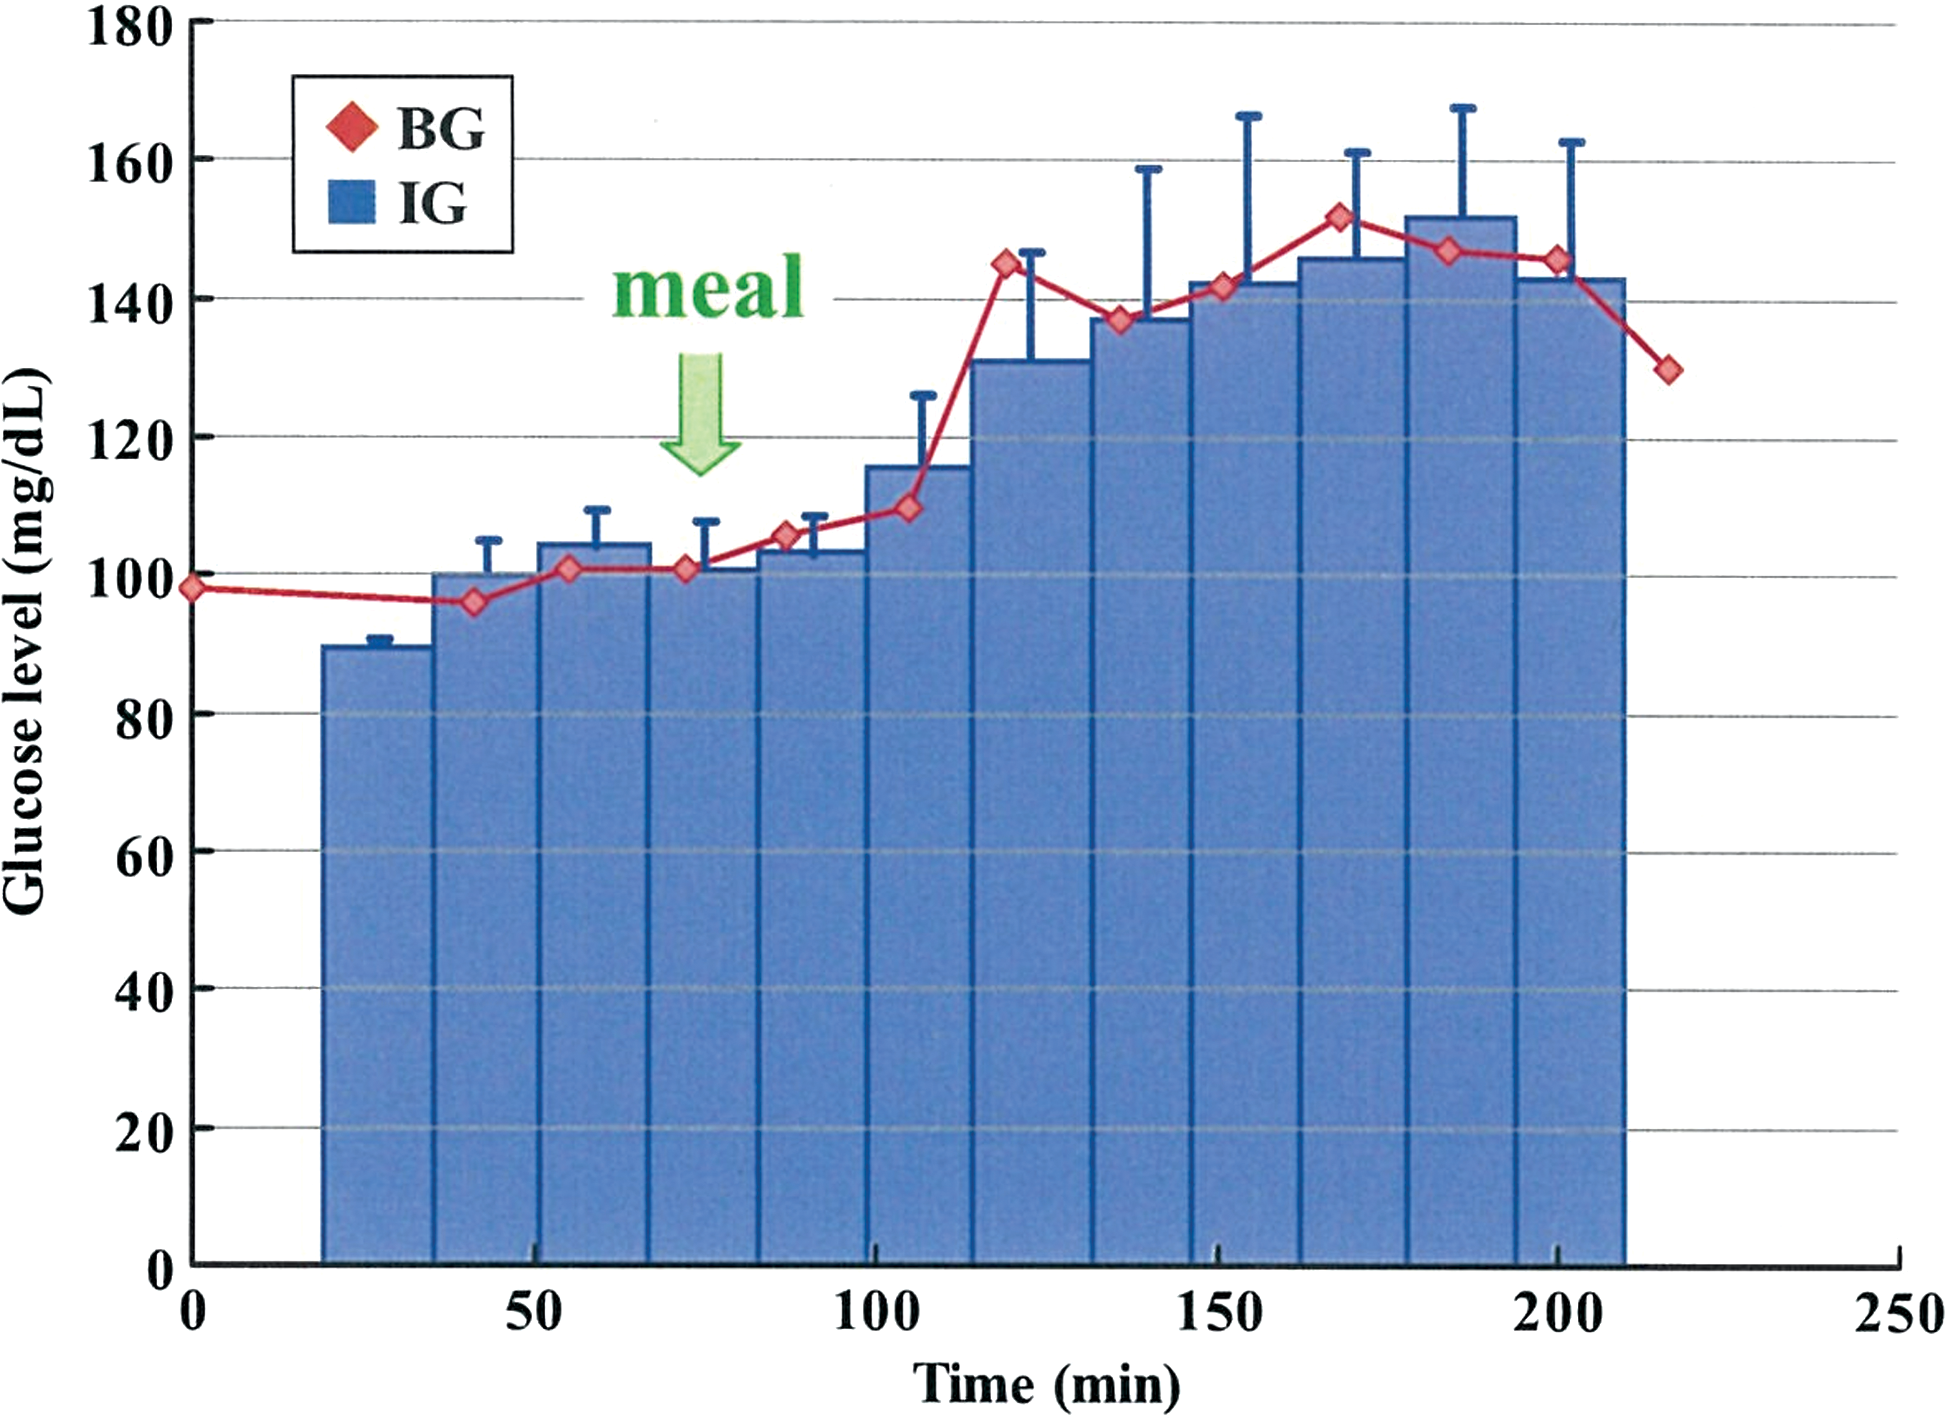
Representative blood glucose (BG) and interstitial glucose (IG) time courses every 15 min before and after a meal. The IG profile is the area of the sampling interval. Error bars represent the SDs of three simultaneous measurements. Color images available online at
AUC measurement with accumulated ISF
MIET uses a reservoir containing solvent to accumulate the extracted IG for a specific period. IG-AUC is then estimated from the accumulated IG in the reservoir. The accuracy of IG-AUC was examined by comparing AUC calculated from multiple measurements of IG or BG. Figure 5 shows the correlation between IG-AUCs at 1, 2, and 3 h and AUCs calculated using multiple IG or BG measurements from three healthy subjects. The multiplied IG and BG measurements were performed every 15 min. IG-AUCs showed a good correlation with AUCs calculated using IG and BG. These findings suggest that IG-AUC can be measured using this system for 1–3 h without considering any diffusion of glucose or sodium ions from the reservoir back into the skin.

Correlation between area under the curve (AUC) for interstitial fluid glucose (IG) at 1, 2, and 3 h and AUCs calculated using multiple IG or blood glucose (BG) measurements from three subjects. Color images available online at
Evaluation of AUC prediction accuracy after a meal
To confirm the previous correlation between IG-AUC and BG-AUC, additional analyses were performed in 30 healthy subjects using AUC for 2- and 3-h accumulation after a meal. A high correlation coefficient was observed (R=0.92; Figure 6A). A Bland–Altman plot showed a mean bias of 0.8 mg·h/dL (SD=35.4), with no correlation between the difference and BG-AUC (Fig. 6B). The mean coefficient of variation between simultaneous measurements was 4.6%. These results indicate that IG-AUC is a good substitute for BG-AUC and is potentially a useful index for postprandial glycemic excursions.

Area under the curve (AUC) for blood glucose (BG) and interstitial fluid glucose (IG) measurement after a meal. (
Discussion
Sodium ion calibration concept
The results shown in Figures 3 and 6 indicated that sodium ion is a good calibration index for IG extraction. Sodium ions can be used for this technology because their level in blood is stable and comparable among individuals. We also confirmed that chlorine ions are useful for calibration (data not shown). Previous studies have reported that sodium ions are not suitable as internal standards for glucose extraction when a current is applied to extract ISF. 8 Because ISF was extracted by passive diffusion and osmotic flow in our method, extraction mainly depended on the diffusion coefficient of the molecules, and hence sodium ions were used as the internal standard. However, ISF composition extracted by electro-osmotic flow with iontophoresis depends on its charge in addition to the diffusion coefficient, which decreases the correlation between sodium ion and glucose permeabilities. In addition, the loss of permselective properties of the skin pretreated with a microneedle array may improve the correlation between uncharged glucose and charged sodium ions.
In Eq. 5, we approximated that sodium ion time courses were stable to overcome difficulties associated with time course measurements. When ISF extraction rates change rapidly, this approximation may affect AUC measurement accuracy. In this experiment, the average decay in sodium ion levels over a 2-h period was 17%, which did not result in significant problems in AUC measurement. However, further studies involving rapid sodium changes and long-term AUC measurements are needed to clarify this effect.
IG and BG time courses
Kulcu et al. 9 reported differences between IG and BG during rapid changes in BG. In our study, changes in BG levels and rates were small because the measurements were performed on healthy subjects after a meal. Further studies in patients with diabetes are necessary to determine whether differences occur in AUC measurements during rapid changes in BG, such as during a 75-g oral glucose tolerance test.
Microneedle pretreatment for ISF extraction
Several methods have been proposed for ISF extraction from the skin, including iontophoresis, sonophoresis, micropore formation by laser ablation, and a mosquito bite system. 10 However, the only method approved by the Food and Drug Administration is GlucoWatch, manufactured by Cygnus (Redwood City, CA), which is based on iontophoresis. 11 However, this device disappeared some years after its release because the ISF extraction procedure through the stratum corneum used electricity and caused skin damage, pain, and reduced accuracy. 12 To avoid these problems, we used a microneedle array to create micropores in the stratum corneum to facilitate ISF extraction without pain.
Recently, various types of microneedle arrays for stamping have been developed, and some are commercially available. 13,14 However, their main use is in transdermal drug delivery. Some microneedle arrays, including hollow microneedles for direct ISF sampling, are used to pretreat skin before sampling, but there are not sufficient data on their practical application for ISF extraction. 15 The microneedle array and applicator produced by mold injection in our study is the first clinically significant system for ISF extraction.
Clinical significance of glucose AUC monitoring
Numerous systems such as the majority of underdeveloped systems and SMBG measure glucose at a single point. To the best of our knowledge, other than CGM with an inserted sensor, our system is the only method to measure glucose AUC. The glucose AUC has also been used as an index of glycemic excursions after meals in nutrition-related studies 16 because it accurately indicates the complete postprandial increase in BG. However, no epidemiological evidence suggests the clinical usefulness of glucose AUC because of the difficulties in measurement. Our convenient glucose AUC monitoring system allowed glucose AUC to be used as an effective index of postprandial glucose excursions without blood sampling and allowed us to obtain epidemiological evidence for the clinical usefulness of the method.
In summary, the fundamental concepts of our glucose AUC monitoring system, based on MIET, were demonstrated in healthy subjects by comparing BG-AUC with IG-AUC. The limitation of this study was that all tests were performed on a limited number of healthy volunteers as a preliminary step. Further investigations are needed in patients with diabetes to confirm the adequacy of this system.
Footnotes
Acknowledgments
We thank M. Takahashi and S. Hosoya (Sysmex Corp., Japan) for their assistance.
Author Disclosure Statement
T.S., S.O., K.H., Y.A., Y.K., J.K., T.W., Y.M., and K.A. are employees of Sysmex. K.I. and R.K. are employees of Nichiban. H.N. declares no competing financial interests exist.