
Abstract
Background:
OneTouch® Verio™ test strips (LifeScan Inc., Milpitas, CA) are designed to minimize error when used in blood glucose monitoring systems. These strips have a specialized architecture and incorporate a sophisticated waveform and proprietary algorithm.
Materials and Methods:
Performance of OneTouch Verio test strips was assessed in the laboratory in the presence of a wide range of patient, environmental, and pharmacologic factors. A clinical evaluation was conducted in which 296 patients and healthcare professionals (HCPs) performed glucose testing using OneTouch Verio test strips and OneTouch VerioIQ meters.
Results:
In the laboratory study, OneTouch Verio test strip results achieved a high level of performance over a wide range of hematocrit (19–61%), temperature (5–45°C), humidity (10–90% relative humidity), and altitude (0–3,048 m) conditions. Performance was not affected by 22 of 23 chemical compounds. In the clinical study, 100% (31/31) of lay-user test results were within ±10 mg/dL of reference values for blood glucose <75 mg/dL. At blood glucose ≥75 mg/dL, 99.2% (243/245) were within ±15% of reference values. A feature of the VerioIQ meter, PatternAlert™ Technology, was correctly used and positively evaluated by >98% of lay users.
Conclusions:
OneTouch Verio test strips are accurate and precise over a wide range of patient, environmental, and pharmacologic conditions. In addition, lay-users were able to successfully use the OneTouch VerioIQ PatternAlert Technology without HCP training.
Introduction
Clinical and governmental experts have recognized the need for improved glucose meter performance in certain clinical settings and for specific patient subgroups. 3 The novel OneTouch® Verio™ test strip (LifeScan Inc., Milpitas, CA) uses the FAD-dependent glucose dehydrogenase enzyme combined with a complex waveform and proprietary algorithm to provide accurate plasma-equivalent results and minimal interference. 4 The purpose of this report is to assess the performance of the OneTouch Verio test strip in the presence of a range of patient, environmental, and pharmacologic factors and also to assess lay-user accuracy in a clinical study.
Although blood glucose meter result accuracy is important, it is often difficult for many patients and healthcare professionals (HCPs) to translate SMBG data from written logbooks into useful clinical information. 5 Pattern management based on SMBG data may offer patients and HCPs the opportunity to review, adjust, and improve glucose control. 5 Therefore, this report will also assess the OneTouch VerioIQ meter with PatternAlert™ Technology, which is designed to analyze blood glucose readings in the meter's memory and alert the user with a message when a glycemic pattern has been identified. 6
Materials and Methods
OneTouch Verio test strips
The OneTouch Verio test strip uses FAD-dependent glucose dehydrogenase enzyme biochemistry to minimize non-glucose sugar interference. 7 The test strip comprises gold and palladium electrodes that are orientated in a co-facial manner. The electrodes are separated from each other by a thin plastic spacer with a thickness of approximately 95 μm. Because of manufacturing process controls and built-in signal processing compensation mechanisms, the need for user calibration coding is eliminated. The strip requires 0.4 μL of fresh capillary or venous blood and has a 5-s test time. OneTouch Verio test strips may be used in three performance-equivalent BGMSs: OneTouch Verio, OneTouch Verio Pro, and OneTouch VerioIQ (all from LifeScan Inc.). All of these meters incorporate a compensation algorithm that targets hematocrit, temperature, and electroactive interferences to deliver an accurate patient blood glucose reading. 8 In this report, OneTouch VerioIQ meters were used for all assessments.
Precision
The repeatability and intermediate precision studies were designed in accordance with International Organization for Standardization (ISO) document 15197:2003(E). 9 To assess strip-to-strip variation and meter repeatability, venous blood from one donor with a hematocrit value of 44% was adjusted to five glucose levels (40, 100, 130, 200, and 350 mg/dL) and tested on three strip lots on 10 meters per test strip lot. Thus, 10 replicates were tested per meter, per test strip lot, per glucose concentration. To assess intermediate precision, three lots of test strips were tested with OneTouch Verio control solution over a 10-day period at glucose levels of 50, 120, and 350 mg/dL. Statistics were determined using Minitab® version 15 software (Minitab Inc., State College, PA).
Linearity
Blood from nine donors (nominal hematocrit, 37–45%) was adjusted to eight target glucose levels (20, 100, 200, 300, 400, 500, 600, and 700 mg/dL) and tested with three test strip lots on eight meters. Two replicates per meter per lot per blood sample were performed, giving a total number of 3,456 data points.
Hematocrit performance
Three test strip lots were tested on 12 meters at each of the following hematocrit levels: 19%, 30%, 40%, 50%, and 61%. At each hematocrit level each lot was tested with three donor samples, at each of five target glucose levels: 30, 65, 240, 450, and 560 mg/dL. In total, 12 replicates were obtained for each combination of test strip lot/glucose/hematocrit/donor, giving a total number of 2,700 data points.
Interference testing
Per CLSI EP07-A2 recommendations, 10 23 substances were tested using a paired-difference test and/or using a dose–response protocol. The dose–response method tested the system using five incremental concentrations of each chemical compound at two glucose concentrations (65 and 240 mg/dL). Linear regression was used to ascertain the highest concentration of each chemical compound that produced acceptable meter bias.
Effects of temperature and relative humidity
Three test strip lots were tested on six meters at each of seven temperature/relative humidity (RH) conditions: 5°C/20% RH; 10°C/70% RH; 22°C/10% RH; 22°C/50% RH; 22°C/90% RH; 35°C/70% RH; and 45°C/10% RH. On each day of testing, venous blood from three donors was adjusted to 65, 240, and 450 mg/dL. Control solution was tested daily at 22°C/50% RH at target glucose concentrations of 50, 120, and 350 mg/dL.
Effect of altitude
Three test strip lots were tested on 16 meters using blood from three donors at three glucose concentrations (70, 240, and 450 mg/dL) at three altitude levels (914 m [3,000 ft], 1,829 m [6,000 ft], and 3,048 m [10,000 ft]) and at sea level as a control.
Capillary blood clinical accuracy
Accuracy of the meter was evaluated by testing capillary blood from 100 participants with diabetes by trained clinic staff on three test strip lots, in duplicate. The glucose concentrations of the samples were prepared to fit the distribution detailed in ISO 15197:2003(E), Section 7.3. 9 Reference testing was performed with a YSI® 2300 STAT PLUS™ blood glucose analyzer (Yellow Springs Instrument Co. Inc., Yellow Springs, OH).
User performance evaluation
User performance of the meter was assessed by evaluating self-testing by lay users and testing by HCPs following the ISO 15197:2003(E), Section 8 user evaluation procedure. 9 Participants tested with one of three randomly assigned test strip lots, after which the HCP tested with the same test strip lot, followed by YSI sample collection. Single-use, auto-disabling lancing devices were used. System accuracy was compared with the YSI 2300 STAT PLUS blood glucose analyzer according to the ISO system accuracy criterion (within ±15 mg/dL or ±20% of reference at <75 mg/dL and ≥75 mg/dL glucose, respectively) and at a more stringent criterion (within ±12 mg/dL or ±15% of reference at <80 mg/dL and ≥80 mg/dL glucose, respectively). To assess human factors, participants were asked to perform a total of 36 tasks related to basic meter settings, application of blood to the test strip, alternate site testing, testing in low light conditions, correct use of the High/Low pattern tool, result tagging, carry case testing, and meter battery charging. Participants were given instructions for use but no training and were assessed by the HCP on their ability to perform the assessment correctly. User acceptance and ease of use of the PatternAlert Technology were assessed by user acceptance questionnaires. Participants were asked a total of 22 questions, including how easy the meter is to work with (in general and in low light conditions), how easy it is to tag results, how to use the High/Low pattern tool, and whether participants preferred the VerioIQ over their current meter.
Results
Precision
Repeatability (with adjusted capillary blood) and intermediate precision (with control solution) results for one representative strip lot are shown in Table 1.
NA, not applicable.
Linearity
The linear regression results for the three test strip lots combined are shown in Figure 1. Fitted linear regression slope and intercept of the regression were 0.923 and 4.57 mg/dL, respectively, with an r 2 of 0.998. The mean response bias of the system from the regression line was less than ±3 mg/dL or ±3% across the glucose response range (20–600 mg/dL).
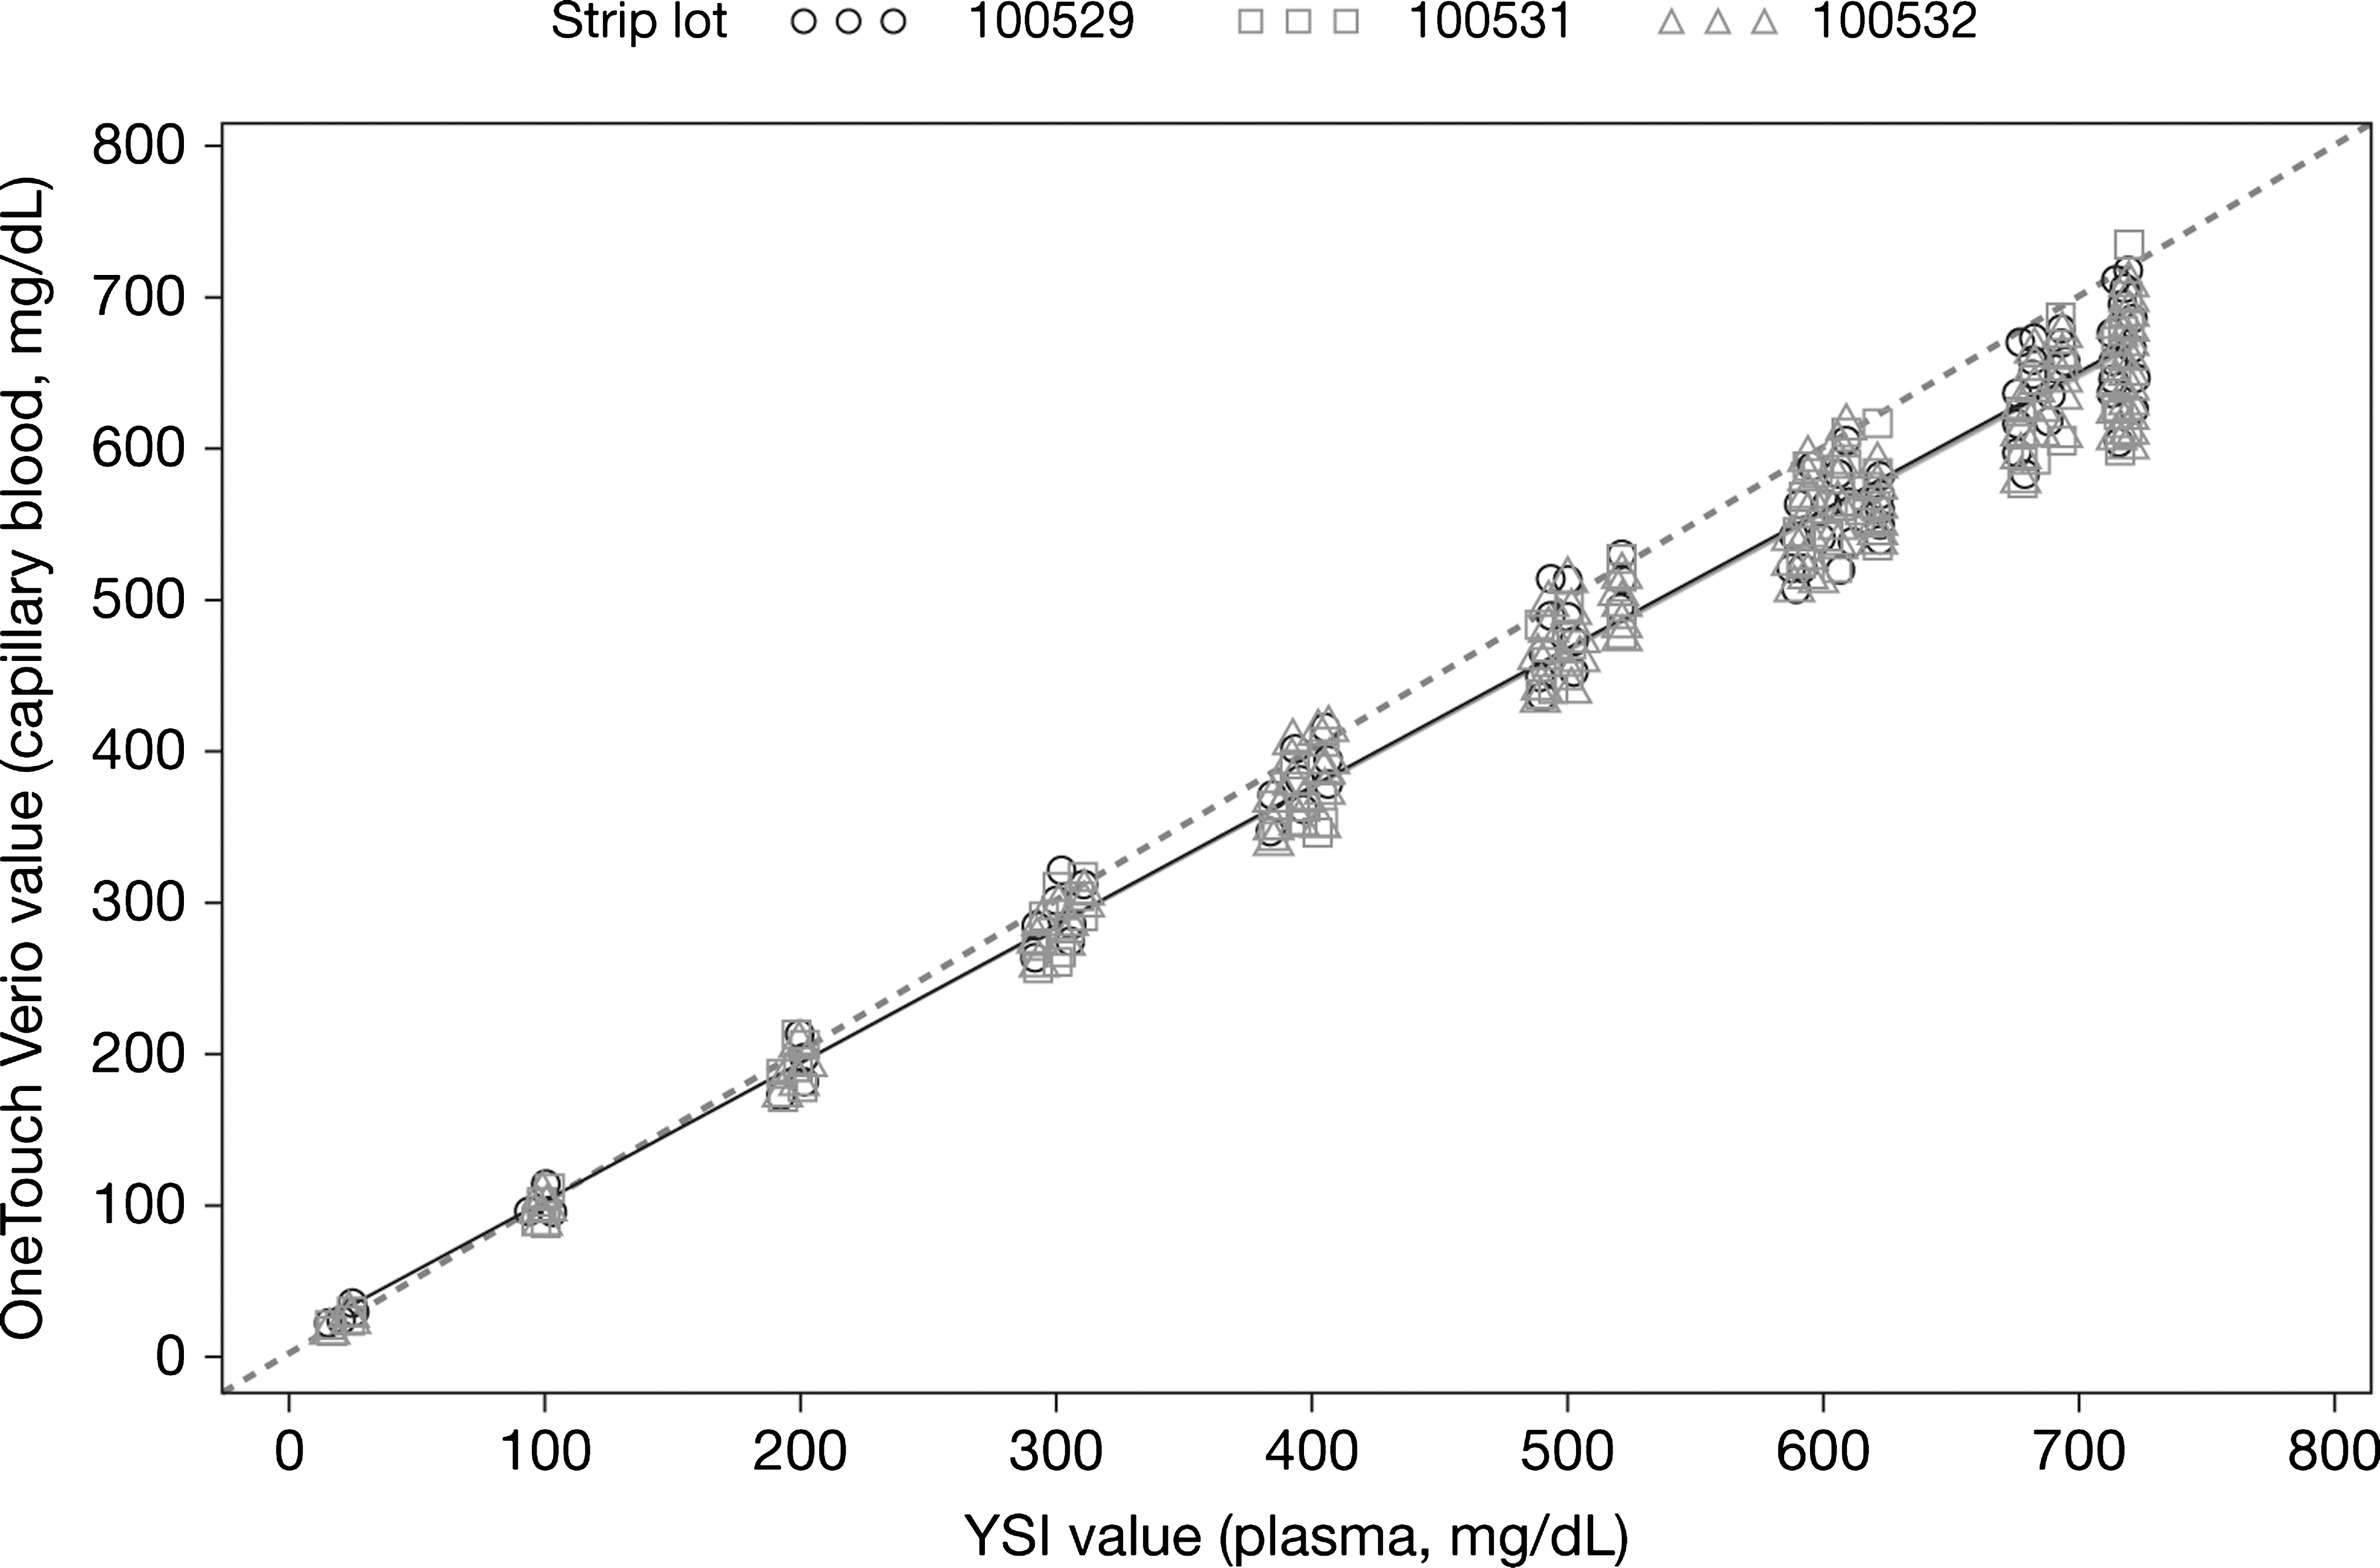
OneTouch Verio test strip response as a function of YSI reference glucose concentration (n=3,456) (i.e., three test strip lots×nine donors×two replicates×eight glucose levels×eight meters).
Hematocrit performance
One hundred percent of measurements were within the ISO accuracy specification for all lots tested at 19%, 30%, 40%, and 50% hematocrit. At a hematocrit of 61%, 96.7–98.9% of readings, depending upon test strip lot, were within the accuracy specification. Combined data for all hematocrit (19–61%) showed that 99.96% of readings met the ISO accuracy specification.
Figure 2 shows that, at 61% hematocrit, a slight positive effect (bias +7.5 mg/dL) occurs at low glucose (65 mg/dL) and a slight negative effect (bias −4.1%) occurs at high glucose (450 mg/dL).

Effect of hematocrit on performance of OneTouch Verio test strips at (
Interference testing
Interfering substances (15 endogenous and eight exogenous) were tested at glucose concentrations of 65 and 240 mg/dL. Performance of the OneTouch Verio test strip was not adversely affected by any substance except
Maximum test/acceptable concentration is either based on maximum concentration tested during paired-difference evaluation or derived from a dose–response evaluation.
See Davies. 11
The reference value was calculated based on the dosing advised by the Mayo Clinic 12 and the conversion specified by CLSI EP07-A2, Section 5.5. 10
Three times extracellular (plasma) glutathione concentration.
See Pastore et al. 13
Effects of temperature and RH
The overall ISO accuracy performance across all sets of temperature/RH conditions was 99.79% (range, 98.15–100%, depending upon test strip lot). For each of the three control solutions tested, the overall ISO accuracy was 99.96% per test strip lot per temperature/RH condition (range, 98.6–100%).
Effect of altitude
The difference in mean bias between sea level and 10,000 ft was up to −0.9 mg/dL at glucose levels <80 mg/dL and up to 3.3% at glucose levels ≥80 mg/dL. Slopes of all bias plots were near 0, indicating that altitude did not have a significant effect on system performance.
Capillary blood clinical accuracy
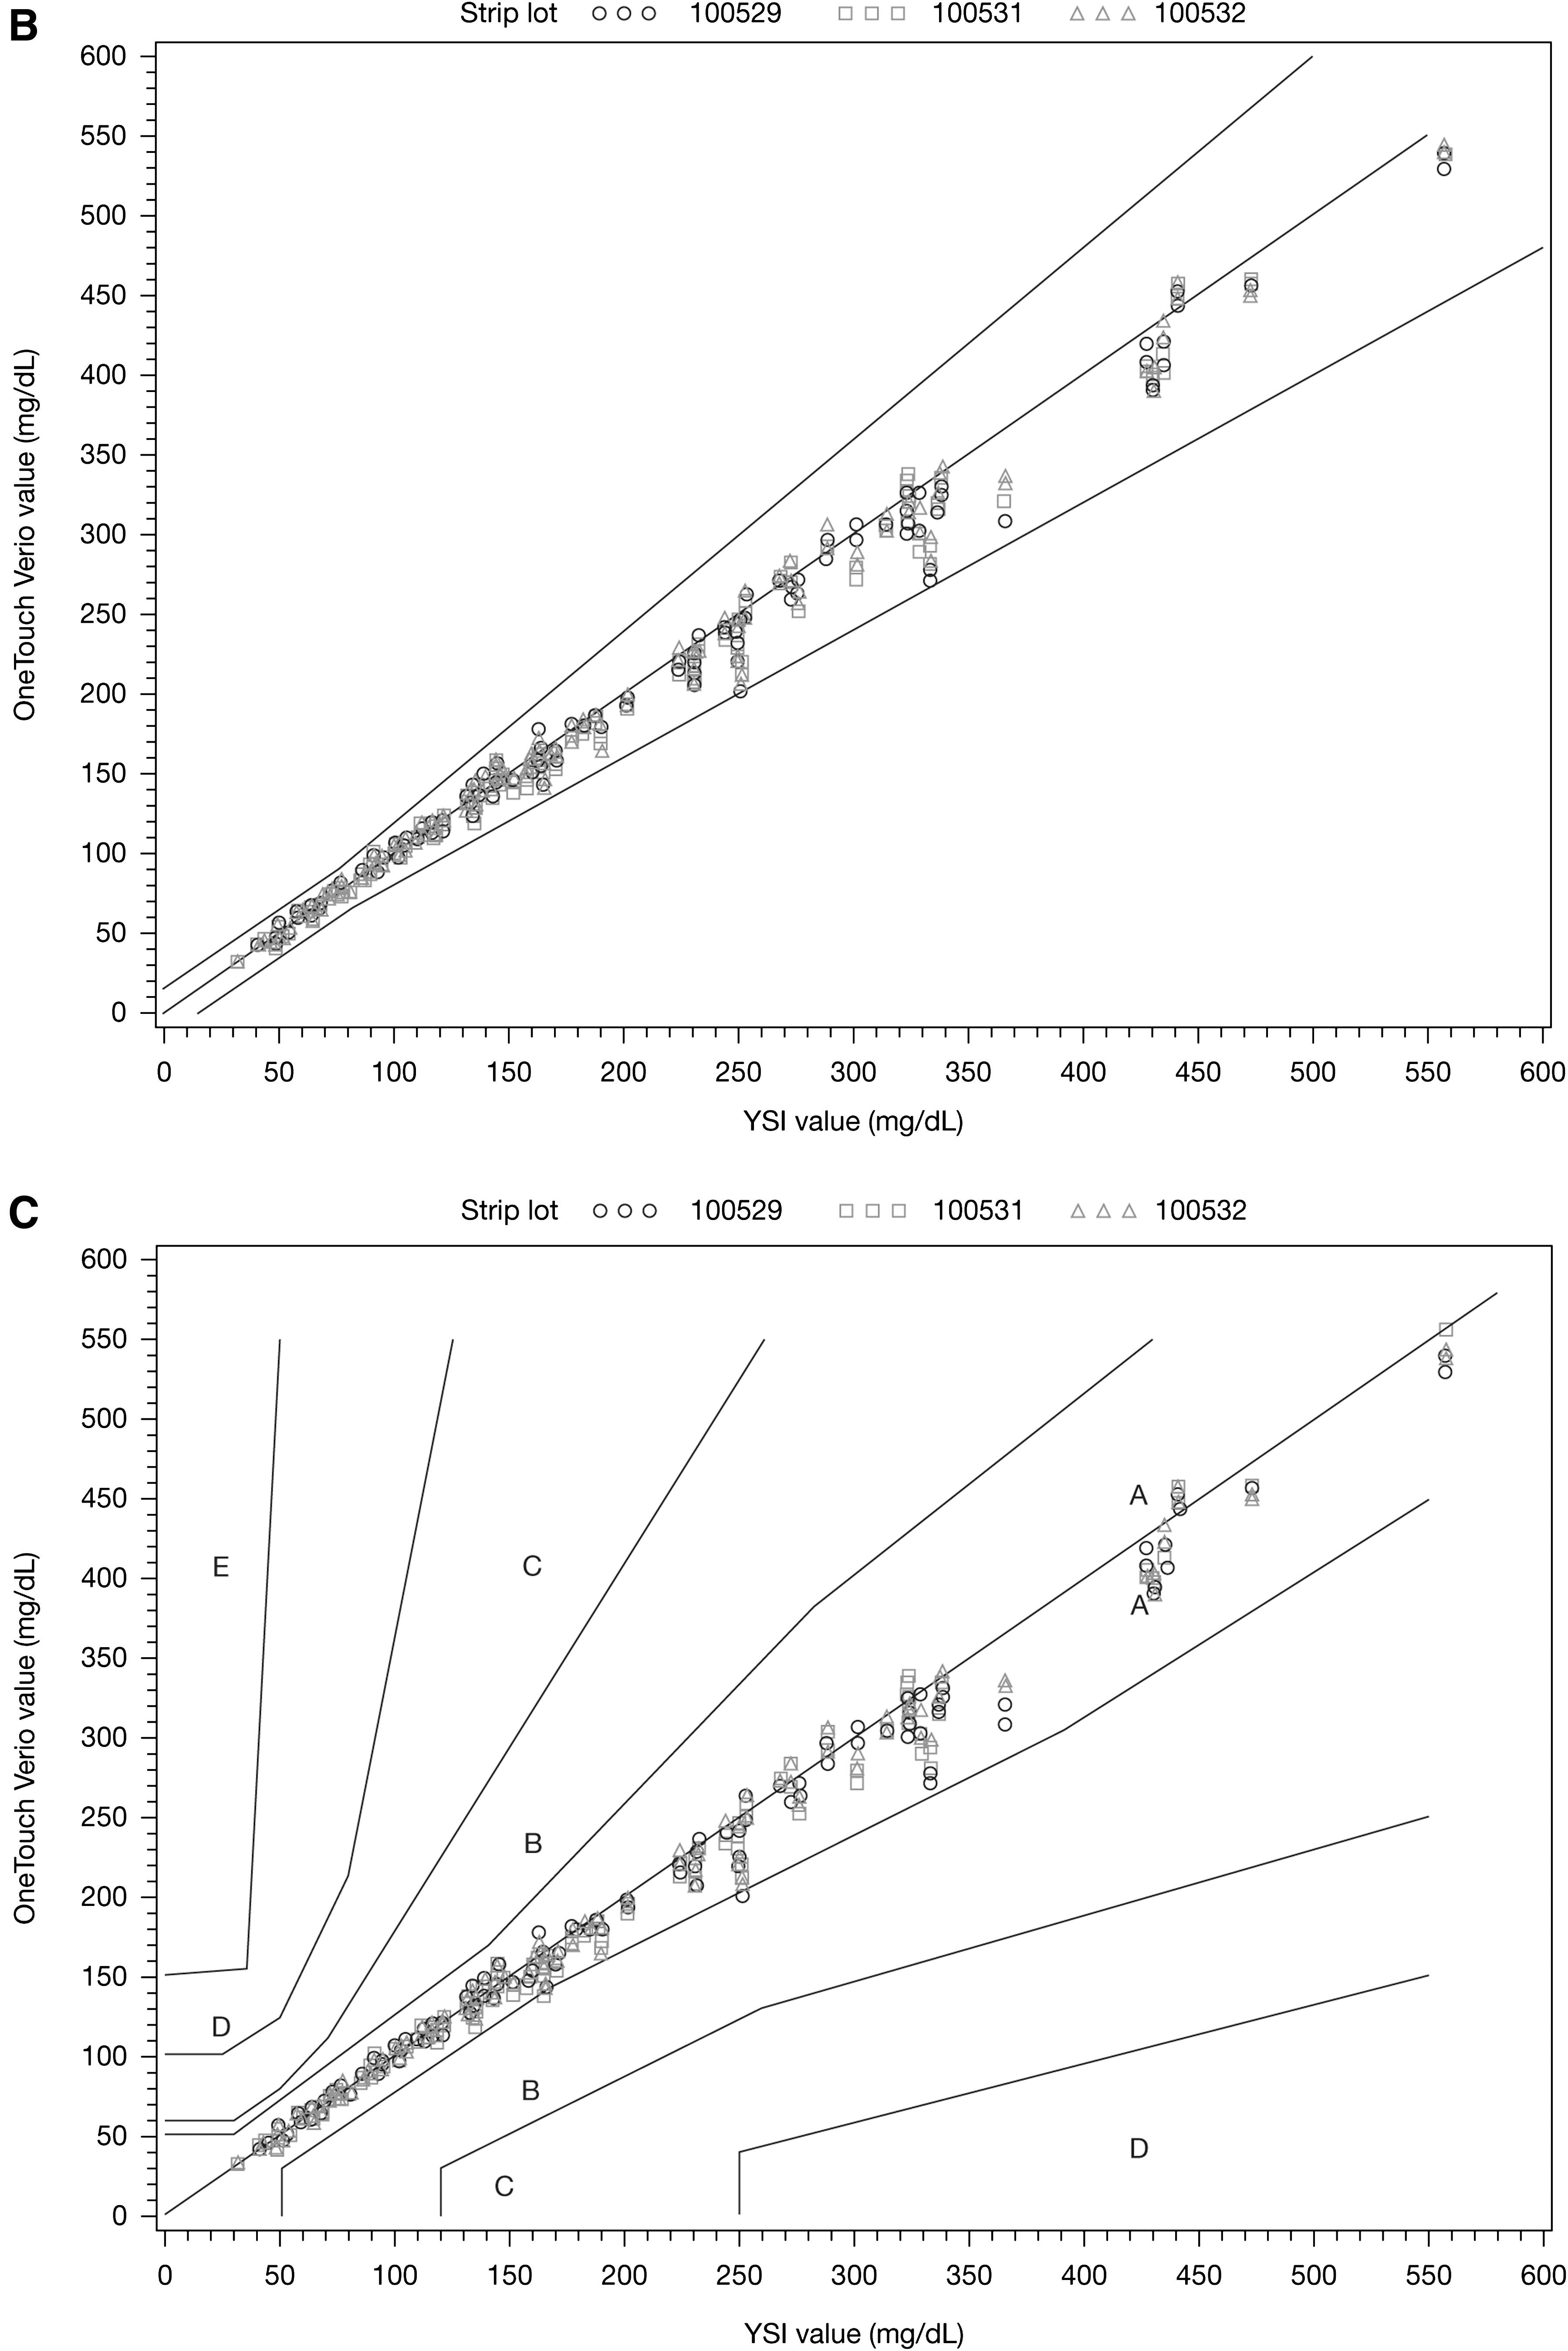
An accuracy (bias) plot, a regression plot, and a consensus error grid for the three test strip lots combined are shown in Figure 3. At blood glucose <75 mg/dL, 100% of test results were within ±10 mg/dL of the reference value compared with 86.3% within ±5 mg/dL. At blood glucose ≥75 mg/dL, 100% of measurements were within 20% of the reference value, whereas 97.8%, 93.4%, and 71.9% were within ±15%, ±10%, and ±5%, respectively. For the three test strip lots combined, 596 (99.3%) of measurements were in Zone A (no effect on clinical action) with the remaining four (0.7%) measurements being in Zone B (little or no effect on clinical outcome).
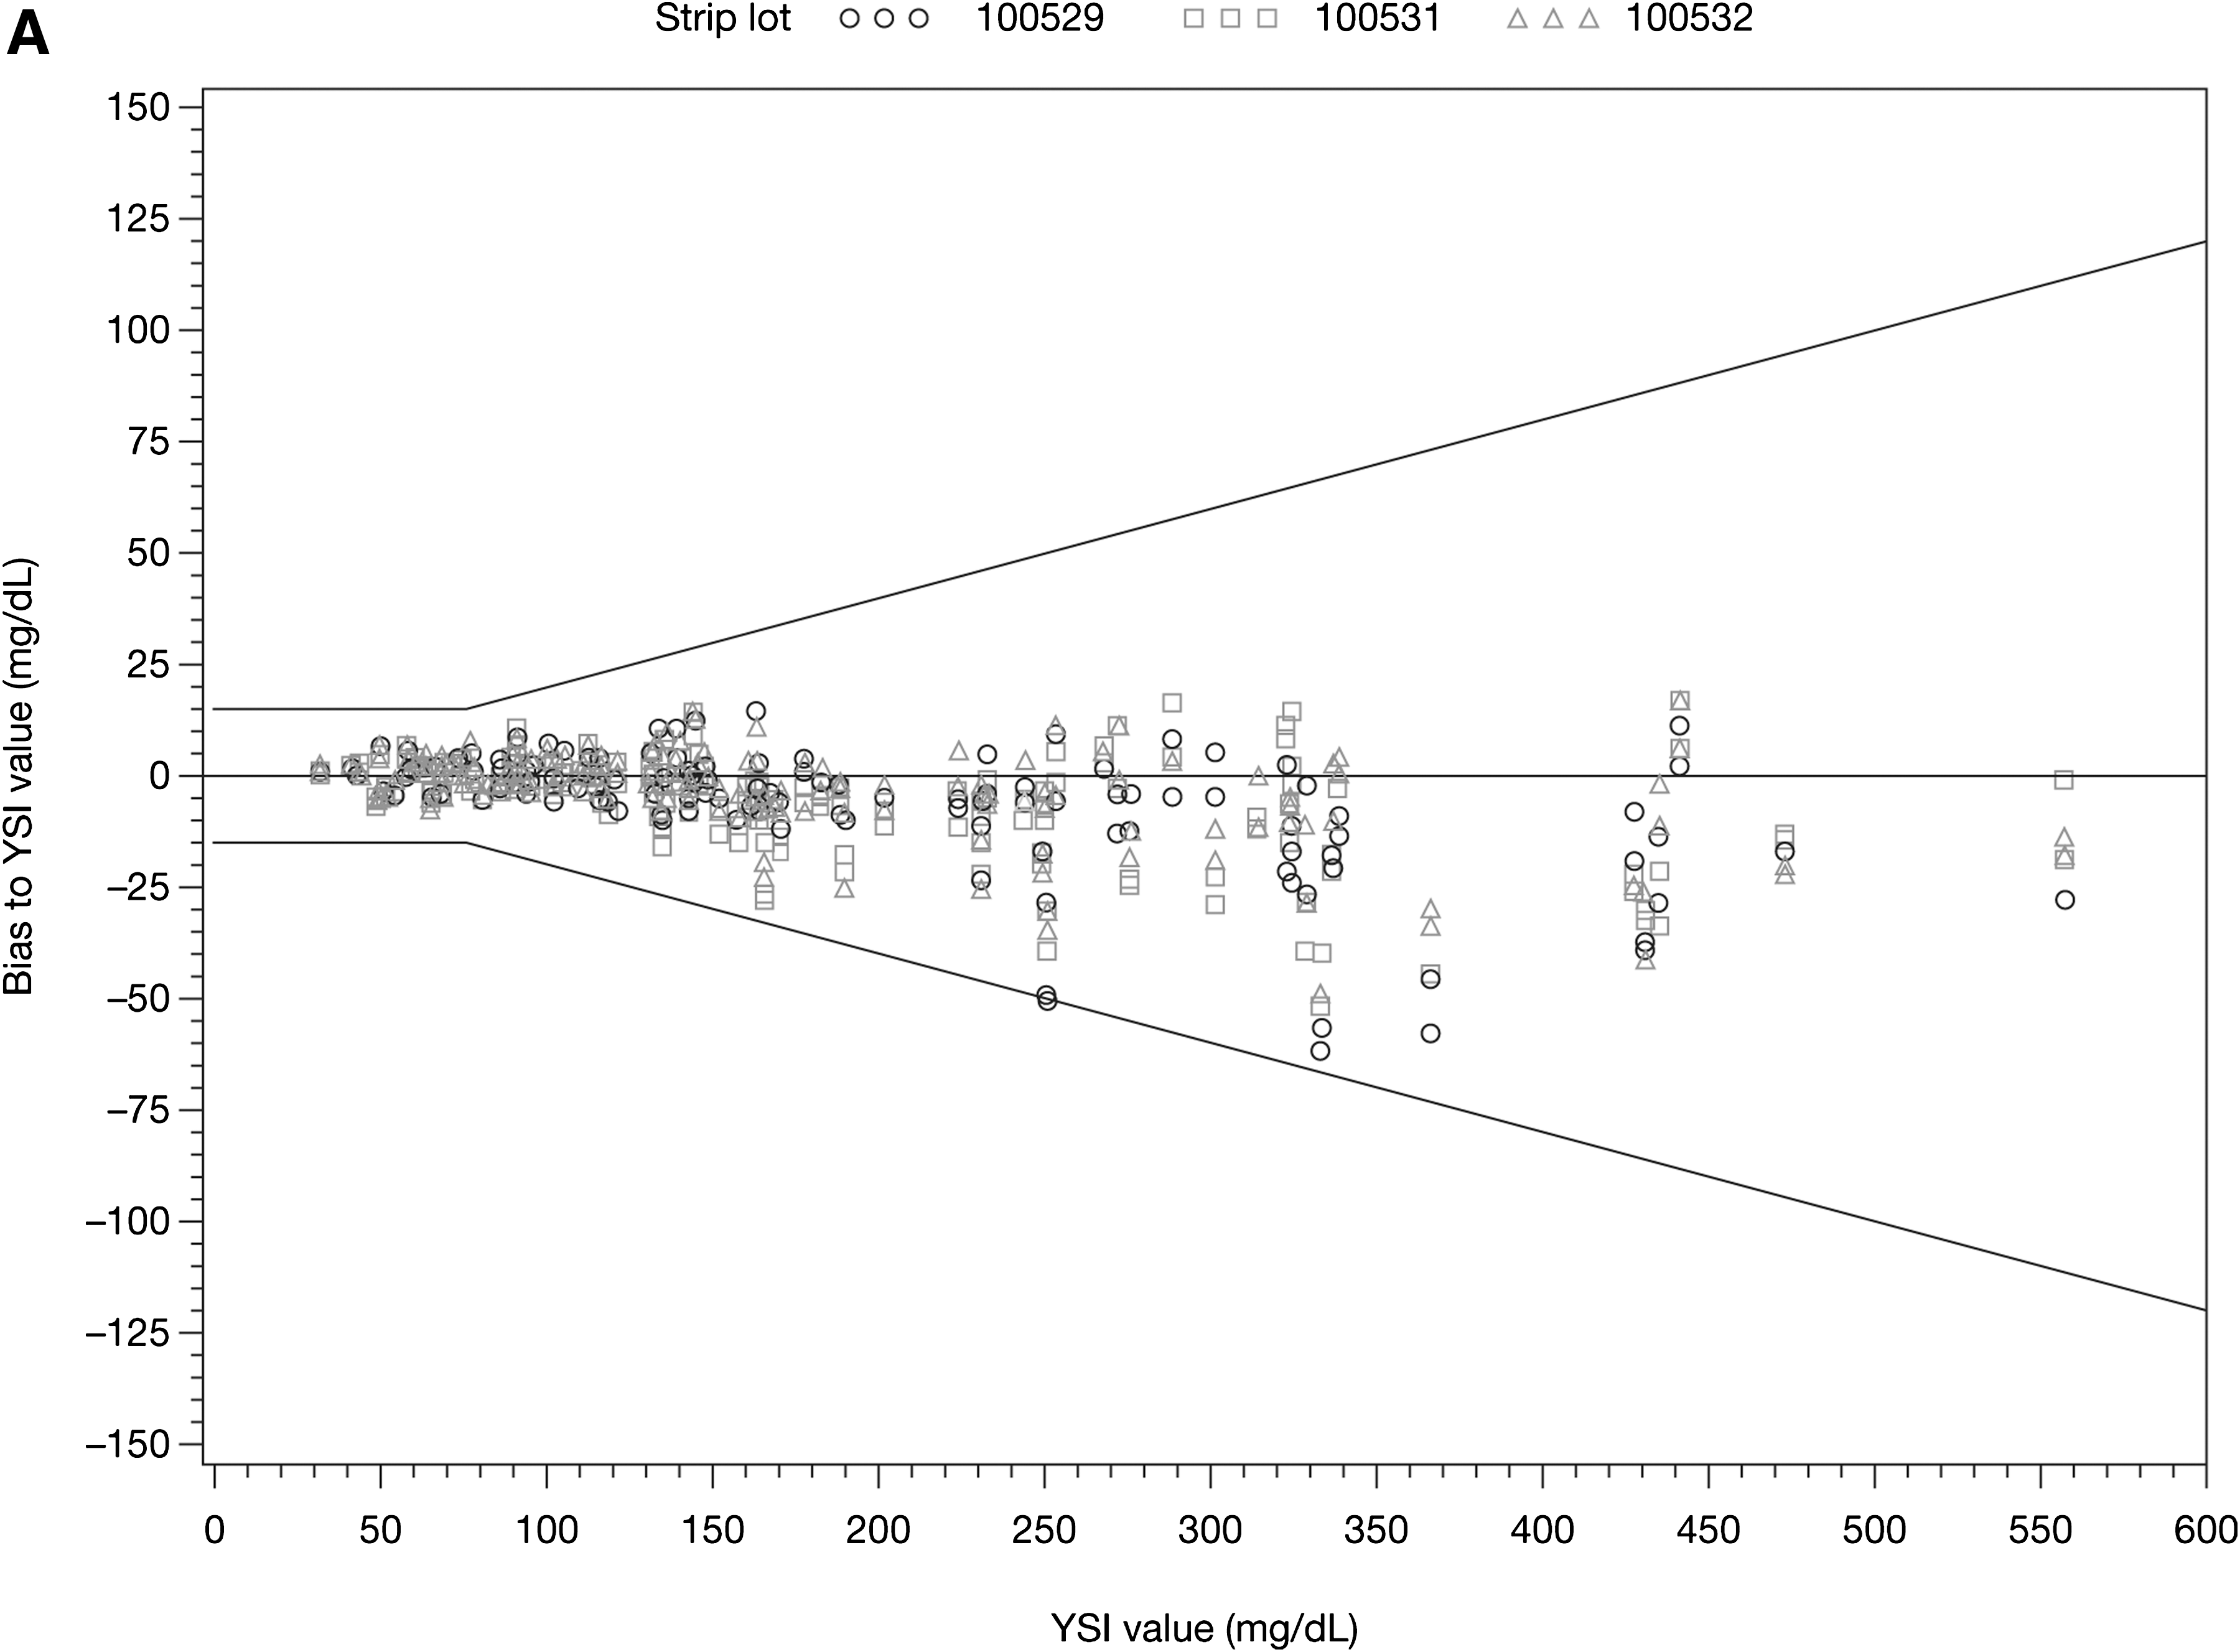
Analytical performance of the OneTouch Verio test strips for three test strip lots (n=600): (
User performance evaluation
In total, 296 lay-users (47% type 1 diabetes, 53% type 2 diabetes; 47.6% female; mean age, 48.9±17.9 years; mean time since diagnosis, 14.9±11.3 years) initially entered in the study. Subsequently, 20 participant samples were excluded for the following causes: blood volume insufficient for YSI (n=10), YSI sample duplicate readings exceeded 4 mg/dL or 4% for run-to-run or probe-to-probe (n=8), sample timing issue (n=1), and failing to obtain subject, HCP, and YSI results from one fingerstick (n=1). Data derived from self-testing and HCP testing of 276 participants were included in the study. In total, 99.6% (275/276) of lay-users and 100% (276/276) of HCPs recorded blood glucose values within the accuracy specifications of ISO 15197:2003(E), Section 7.3. 9 For blood glucose values <75 mg/dL, 100% (31/31) of lay-users and 100% (31/31) of HCPs recorded measurements within ±15 mg/dL. For blood glucose values ≥75 mg/dL, 99.6% (244/245) of lay-users and 100% (245/245) of HCPs recorded measurements within ±20% (Table 3) of YSI values. When the tighter accuracy specification was applied (±12 mg/dL for YSI values <80 mg/dL and ±15% for YSI values ≥80 mg/dL), 99.3% (274/276) of lay-users and 99.6% (275/276) of HCPs recorded blood glucose values within this specification. For blood glucose values <80 mg/dL, 100% (34/34) of lay-users and 100% (34/34) of HCPs recorded results within ±12 mg/dL, whereas 100% (34/34) of lay-users and 94.1% (32/34) of HCPs recorded results within ±10 mg/dL. For blood glucose values ≥80 mg/dL, 99.2% (240/242) of lay-users and 99.6% (241/242) of HCPs recorded measurements within ±15% of reference values, whereas 93.4% (226/242) of lay-users and 93.0% (225/242) of HCPs recorded measurements within ±10%.
HCP, healthcare professional.
The results of a sample of the user assessments are as follows: all participants inserted the test strip correctly into the meter, 98.9% (183/185) of participants applied control solution to the test strip correctly, 99.5% (184/185) of participants were able to turn on the “Alerts” feature on the Tool settings screen, and 95.7% (177/185) of participants were able to correctly identify the number of “High results in the past 30-day period.” In the user acceptance questionnaire, 100% of participants indicated that “it was easy to read my glucose result on the VerioIQ meter,” 97.3% (180/185) of participants thought it was easy to learn how to use the OneTouch VerioIQ meter, and 91.4% (169/185) of participants preferred the OneTouch VerioIQ meter over their current meter.
OneTouch VerioIQ Meter with PatternAlert Technology
In the human factors assessment, three tasks specifically addressed ease of use of the PatternAlert Technology. HCPs reported that lay-users were able to correctly use the OneTouch VerioIQ meter with PatternAlert Technology, with a success rate of >98% (183/185). In the instructions for use and user acceptance questionnaires, a total of 16 questions specifically addressed the PatternAlert Technology. The PatternAlert was considered easy to set up by 99.5% (184/185) of participants, and 97.8% (181/185) of participants considered the messages easy to understand. Additionally, 99.5% (184/185) of participants liked that the PatternAlert automatically identified new patterns, and 98.9% (183/185) found it easier to find patterns using PatternAlert on the OneTouch VerioIQ BGMS than with a paper logbook.
Discussion
OneTouch Verio test strips achieved a high level of performance with regard to repeatability, intermediate precision, and linearity. Moreover, the results from both subjects (99.6% [275/276]) and HCPs (100% [276/276]) exceeded ISO accuracy criteria. At blood glucose ≥75 mg/dL, 99.6% (244/245) of lay-user measurements were within 20% of the YSI reference value, whereas 99.2% (243/245) of results were within ±15%. At blood glucose <75 mg/dL, 100% (31/31) of lay-user data met performance criteria of ±10 mg/dL (Table 3), which is tighter than current ISO requirements (±15 mg/dL). This level of accuracy is especially relevant for those subjects who use SMBG data to calculate insulin dosages. 14 A recent in silico analysis indicated that improved meter performance could decrease the frequency of hypoglycemic incidents due to insulin misdosing and could increase detection of hypoglycemia. 15 In addition to calculating insulin dosing, SMBG data are now also being used to calibrate continuous glucose monitoring devices, which highlights the need for meters with improved performance.
Physiological and environmental factors can negatively affect BGMS accuracy.
2
In laboratory testing, the OneTouch Verio system delivered a high level of performance over a wide range of hematocrit (19–61%), temperature (5–45°C), humidity (10–90% RH), and altitude (0–3,048 m [0–10,000 ft]) conditions. The OneTouch Verio tests strips were not significantly affected by 22 of 23 known BGMS-interfering substances (including maltose) at high endogenous or high therapeutic levels. The only interferent that did affect readings was
Structured testing and well-organized SMBG data may facilitate timely and effective treatment decisions to improve glycemic control. 18 Tools that assist in a structured testing approach, such as algorithms that can detect blood glucose patterns over a defined period, and that can predict glucose excursions may assist individuals in their diabetes management. The OneTouch VerioIQ meter with PatternAlert Technology has been designed to detect glycemic patterns. In a retrospective analysis of data from two different trials, the same PatternAlert-based algorithm identified patterns of low blood glucose 24 h before an episode of severe hypoglycemia in 32.3% of the cases. 6 This suggests that this algorithm has the potential to help patients identify the possibility of hypoglycemia and subsequently avoid it. Based on the human factors assessment, HCPs assessed that >98% of lay-users were able to use this feature correctly, and, when asked in the user acceptance questionnaire, 98.9% of lay-users found it easier to find patterns with the PatternAlert on the OneTouch VerioIQ BGMS than with a paper logbook. This indicates that this tool may add value to SMBG. Further studies will be needed to evaluate how this tool may prospectively decrease glycemic excursions.
In conclusion, OneTouch Verio test strips are precise and accurate over a wide range of patient, environmental, and pharmacologic conditions. Furthermore, the OneTouch VerioIQ BGMS, with its PatternAlert feature that monitors patterns of glucose fluctuations, may facilitate glucose pattern management.
Footnotes
Acknowledgments
The authors received technical assistance from Marco Cardosi and Ian Taylor, who also reviewed the manuscript. The authors received editorial assistance from Excerpta Medica. This study was funded by LifeScan, Inc.
Author Disclosure Statement
T.B. has received consulting honoraria from Roche and research support from Bayer, BD, Dexcom, LifeScan Inc., Medtronic, and Roche. P.D.R. has served as a consultant and advisory board member for Eli Lilly and Co., has received research grants from Andromeda Biotech, AstraZeneca, DexCom, Eisai Company Ltd., GlaxoSmithKline, LifeScan Inc., Merck and Company, Novo Nordisk AS, Novartis, Pfizer Inc., Roche, sanofi-aventis, and Tolerx Inc., and has received speaker fees from Abbott Laboratories, AstraZeneca, Boehringer Ingelheim GmbH, Bristol-Myers Squibb, Eli Lilly and Co., GlaxoSmithKline, Merck and Company, Novo Nordisk AS, sanofi-aventis, and Santarus. A.C. declares no competing financial interests. G.T. and S.S. are employees of LifeScan Scotland Ltd. L.J. and J.M. are employees of LifeScan, Inc. L.J., J.M., and S.S. are shareholders of Johnson & Johnson.