
Abstract
The power of continuous glucose monitoring system (CGMS) technology to profile glycemic patterns throughout a 24-h period has benefited the care of individuals with diabetes mellitus for over 10 years. Recently, this technology has been utilized to better understand glucose patterns in pregnancy, especially as they relate to abnormal fetal growth given that adiposity at birth is associated with increased risks for childhood obesity and metabolic syndrome. However, the lack of a standardized approach to defining glucose measures associated with maternal outcomes and fetal growth has greatly limited comparison and pooling of CGMS data among pregnancy trials, hindering our ability to take advantage of the enormous amount of data available to explore these relationships. The purpose of this article is to offer a methodical approach to the identification and extraction of CGMS-derived glucose variables for the characterization of glycemic profiles in pregnant women, particularly focusing on women with gestational diabetes or obesity who are at risk for abnormal fetal growth. A review of the properties of CGMS data and examples of how CGMS data in pregnancy have been reported to date are included. We further define several pregnancy-relevant, CGMS-derived glucose variables and directly apply them to unpublished data to illustrate how these measures might be utilized. This approach offers one possible standardized method to define and analyze these time-sensitive glucose measures to facilitate comparisons among studies and to increase our understanding of how glycemic profiles contribute to excess infant adiposity in pregnant women with and without diabetes.
Introduction
Research investigators have adopted CGMS as a method to characterize populations without type 1 or type 2 diabetes but who are at high risk for metabolic diseases. If the CGMS device is worn for 72 h, over 800 glucose measurements are possible through sampling of interstitial glucose every 5 min. Although increasing numbers of investigators are using this technology in pregnancy, the literature lacks a uniform approach to the use of CGMS in pregnant women who are at risk for delivering offspring with abnormal fetal growth. Preliminary data in our studies of pregnant women demonstrate strong correlations between CGMS-derived glucose variables and infant outcomes, particularly neonatal adiposity, 7 –9 indicating that CGMS may be a promising methodology for the study of glucose-driven neonatal outcomes. However, there is a lack of any standardization in defining specific CGMS variables (i.e., fasting, nocturnal, postprandial glucose) clinically important for pregnant women. In addition, data management procedures are poorly described at best in most published reports, which severely limits the ability to compare or pool data between studies or directly apply the findings to clinical practice.
Recommendations have been made to suggest approaches to analysis and interpretation of the enormous data output generated by CGMS, 11 –13 especially those with type 1 diabetes. 14,15 However, these approaches and the glycemic measures utilized are not specifically tailored to exploring variables of high clinical relevance in pregnancy associated with abnormal fetal growth (e.g. fasting, 1- and 2-h postprandial glucose). Space constraints within published articles make it impossible for authors to fully describe how CGMS variables were defined and handled, making comparison, replication, and interpretation of data among studies in pregnant women extremely difficult. For example, the seemingly simple but extremely clinically important question of what defines a fasting glucose in pregnant women (utilizing CGMS) in a free-living environment has become subject to interpretation. Should it be defined by the number of hours after a bedtime snack, at a certain time period during the morning, or the value immediately before breakfast independent of the actual time spent fasting? Should a single value be used, or should several values be averaged over a period of time since measures every 5 min are available? Within hundreds of glucose concentrations per monitoring period, per day, and per research participant, CGMS can provide an unwieldy volume of data. From these data, important variables specific to the population of interest must be extracted, while incongruous/missing data are dealt with in a consistent and methodical manner.
The purpose of this article is to offer a methodical approach to the identification and extraction of CGMS-derived glucose variables for the characterization of glycemic profiles in pregnant women, particularly focusing on women at risk for abnormal fetal growth. After review of the properties of CGMS data and examples of how data in pregnancy have been reported to date, we propose and define several pregnancy-relevant, CGMS-derived glucose variables that may be be considered with a systematic approach to their identification. These CGMS-derived glucose variables were used to examine the correlation of fetal growth patterns in our published study. 7 For this article, we include some of our unpublished data to specifically exemplify how these CGMS measures might be adapted to illustrate their potential application. This approach offers one possible standard methodology to define time-sensitive glucose measures and analyze variables of interest that other investigators may find clinically useful and may facilitate comparisons among studies.
Properties of Interstitial Glucose Measured by CGMS
Properties of CGMS glucose concentrations are unlike other measures of blood glucose (BG). The gold standard for the measurement of glucose is within plasma using a high-precision enzymatic laboratory method (glucose oxidase, glucose dehydrogenase, or hexokinase). 16 Since 1987, however, glucometers have been standardized to report plasma-adjusted values within ±15% 17,18 and are recognized as the standard for adjustment of insulin therapy and monitoring treatment adherence in diabetes. 19 Because it is calibrated to capillary glucose by glucometer (meter glucose), 20 interstitial glucose as measured by CGMS (CGMS glucose) is highly correlated with meter glucose (r=0.91–0.92). 21,22 However, an important difference between the two glucose measures is that CGMS glucose is an in vivo, indirect measure of glucose. Meter glucose is an in vitro, direct test of plasma glucose. Thus, in vivo CGMS glucose is calibrated to an in vitro meter glucose measure. Clarke and Kovatchev 13 described that CGMS glucose is further different from meter glucose because of the inherent differences in their properties. Fluctuating in vivo CGMS glucose concentrations reflect a continuous process in time. Because the process is continuous, consecutive glucose measures are highly associated. Each CGMS glucose concentration is determined by the one before it, and the chronological time series represents the rate and direction of the change in glucose. The subcutaneous sensor samples interstitial fluid, collects information continuously, and then derives an average glucose value every 5 min. Thus, each CGMS glucose value represents an average of measures and information during the preceding 5 min. Individual CGMS glucose measures, therefore, should not be considered alone. In vitro meter glucose, on the other hand, is a purely isolated measure of an independent concentration of capillary BG, unaffected by previous measures. CGMS glucose measures are further dependent on the physiological diffusion of blood into capillaries and separation to interstitial fluid, which creates a measurement time delay. 20,23 The time delay, in combination with the time-dependent properties of CGMS glucose, makes accuracy evaluation challenging. Although software specific to CGMS attempts to correct for the time delay, in vitro meter glucose remains the standard for evaluation of CGMS precision clinically. 20 Therefore, the continuous and interdependent structure of CGMS patterns, along with the in vivo nature of the measures, are important considerations when working with these data.
Lack of Uniformity in Reporting of CGMS Data in Pregnancy
The pregnancy literature suffers from the absence of a uniform methodology for an approach to using and reporting CGMS data in pregnancy, even within similar study populations. Although some researchers have attempted to identify their variable selection criteria in limited manuscript space, either the outlined procedures are briefly defined such that replication is impossible, or the chronological properties of CGMS measures are not clearly distinguished. For example, some studies report the “mean glucose” via CGMS but do not identify the time frame from which the mean was derived. 10,24 –28 Thus, it is unclear if the “mean glucose” comprises one 24-h period (approximately 288 CGMS glucose measures) or is a 24-h average across several days. It is further unclear what time frame comprises the “mean glucose” (i.e., Does it begin at midnight? Does it begin when the patient goes to sleep? Is it simply an average of all sensor data across the monitoring period?). Some studies have defined the mean nocturnal glucose as those values between 2300 and 0600 h 10 or 2330 and 0630 h, 7 in contrast with others 27 who have reported the same variable in name but without definition of the nocturnal period. However, if a pregnant woman has a midnight snack (which is common), the values surrounding the snack might be included in the “nocturnal” period, when the woman is neither fasting nor asleep.
Other CGMS variables are often not clearly described in the literature that may have significant clinical relevance. Studies have reported mean pre- and postprandial CGMS glucose variables 29 and glucose area under the curve (AUC) 27 without explicit explanation as to how the variables were defined or calculated. Another frequently reported CGMS glucose variable with important clinical relevance to pregnancy and fetal growth is the fasting glucose. With the exception of our publication, 7 other studies have not clearly defined the fasting glucose in terms of timing, or if it was one isolated value versus the mean of more than one CGMS glucose value. 10,25 Ben Haroush et al. 26 provided a helpful graphic representation of how they determined the pre- and postprandial peak and nadir glucose measures from CGMS, but it appears that in this study and in one other 10 one isolated CGMS glucose value was used for each variable. This practice, as discussed, overlooks the dependence on the rate and direction of change in measures, which is an intrinsic property of CGMS data. Duration of glycemia above and below specific thresholds has further been reported. 25,27,30 Space constraints may prevent investigators from being able to report their definition of glycemic measures in sufficient detail. We attempted to identify our data procedures in a recent publication, 7 but space constraints precluded the type of detail that would allow for replication, and definitions of CGMS variables were relegated to a figure legend. The lack of a uniform definition and approach to CGMS data in pregnancy significantly compromises our ability to compare data among studies or gain a clearer understanding of glycemic patterns in normal and metabolically high-risk pregnant populations.
Selection of CGMS Glucose Variables in Pregnancy
Glucose variables derived from CGMS data should optimally be specific to the population of interest. For example, in adolescents with type 1 diabetes, a frequent variable of interest is to report the duration of hypo- or hyperglycemia above defined thresholds within a 24-h period. 31 In this population, glucose at specific time periods might be less informative because of wide variation in sleep–wake patterns, meal intake patterns, and/or physical activity. In nonpregnant individuals with type 1 diabetes, especially young children, a threshold for hyperglycemia might be >200 mg/dL. 13 However, in pregnant women a mean glucose level of >130 mg/dL is highly predictive of fetal macrosomia. 32 Thus the threshold for “hyperglycemia” in a pregnant mother is actually lower than outside of pregnancy. Even within pregnant women, glycemic variability is higher in those who are obese versus normal weight 7 and in those with preexisting versus gestational diabetes. 26
The goal for the management of diabetes in pregnancy is to achieve tight glycemic control in the first trimester in order to prevent major malformations and pregnancy loss; in the second and third trimester tight glycemic control attempts to avoid excess fetal growth, 1 prevent neonatal respiratory distress, and minimize metabolic abnormalities at birth. Optimal ranges of glycemia in pregnancy have been identified as premeal, bedtime, or nocturnal glucose 60–99 mg/dL, 1 1- and 2-h postprandial glucose of <140 mg/dL and <120 mg/dL, respectively, fasting BG ≤95 mg/dL, 33 and 24-h mean BG of 87–104 mg/dL. 34 Postprandial as opposed to preprandial glucose is closely monitored and targeted because of its association with excess fetal growth patterns. 1,2
A list of suggested CGMS-derived glucose variables that are of particular use for the clinical management of pregnant women is presented in Table 1, and we recognize that others may be highly relevant for specific studies. The properties of CGMS glucose concentrations, dependence on the previous glucose, the lag time inherent in the measures, and the clinically relevant timing of glucose measures were considered in determining these definitions. None of the variables is defined as an isolated CGMS glucose measure, given the properties of CGMS. Time frames were determined based on typical patient life-styles to define daytime (0630–2330 h) and nocturnal (2330–0630 h) periods. However, if a patient or subject does not assume these typical life-style patterns (e.g., eating past 2300 h or staying up through the night), it is critical for the investigator to identify and account for this deviation. To determine pre- and 1-h and 2-h postmeal glucose variables, the use of three consecutive values within a single day was chosen. Three values, 5 min apart, is likely to capture glucose variability or lack thereof during that vicinity of time. 13 The use of six consecutive values within a single day for determination of fasting glucose was chosen in an effort to understand fasting conditions for a period of time when glucose is minimally fluctuating. 35 The mean values of daytime glucose, which reflect primarily the fed state in pregnant women, nocturnal glucose, which reflects maternal hepatic gluconeogenesis and fetoplacental demands, and mean 24-h glucose may also be highly clinically relevant to pregnancy and fetal growth.
Each variable is determined from a single 24-h period of continuous glucose monitoring system (CGMS) data. Identical variables can then be averaged across several days according to the research study design.
If the timing of CGMS glucose measures does not correspond to exact 5-min clock times (i.e., 0600, 0605, 0610 h), then the closest value to 0600 h can be used for the first consecutive measure. Moreover, if the 7-h fasting period extends past 0600 h, the first consecutive measure should be 7 hours after the patient reports eating. Times are 24-h clock time. Meal start time was defined as the start of meal consumption as recorded by the research participant.
AUC, glucose area under the curve; BG, blood glucose; FBG, fasting blood glucose; PP, postprandial.
Use of Glucose AUC
The power of CGMS technology data is in part due to its ability to define specific glycemic patterns of variable duration that would otherwise be impossible to discern using self-monitoring of BG. In pregnancy, the profound effect of maternal glucose on the fetus has long been appreciated. 36 The placenta allows for facilitated transfer of maternal glucose in a gradient fashion: higher maternal glucose causes more glucose transport to the placenta, and subsequently the fetus secretes insulin to utilize the glucose load, which is a potent growth factor. 37 Thus, in pregnant women, the pattern of glycemia visible by CGMS represents total potential fetal glucose exposure. For this reason, we use the calculation of total glucose AUC using the trapezoid method, as opposed to the incremental AUC, for descriptions of maternal glycemia (Table 1). To describe glycemia in pregnancy, use of the incremental AUC (requiring adjustment for the baseline glucose) becomes problematic because it is possible to calculate a negative AUC if post-baseline values are lower than baseline. Thus, if only areas above the baseline value are included in the calculation, important information about glucose availability to the fetus could be lost. 38 Potteiger et al. 38 described that the method used to calculate AUC can affect data interpretation within intervention trials. Therefore, careful consideration of differences in AUC calculations is advised outside of descriptive study designs. The glucose AUC can be further used to characterize the 2-h postprandial AUC for each meal, which incorporates all of the postprandial values in the first 2 h after ingestion. If a higher fat diet is consumed, it may be more relevant to include a 3- or 4-h postprandial AUC to account for the delayed glucose absorption. The AUC is also useful to characterize daytime and nocturnal AUC. Postprandial and diurnal glucose metabolism can be examined independently for its impact on fetal growth.
Analytic Approach to CGMS Data
In an effort to improve consistency in the interpretation and extraction of the glucose variables seen in Table 1, we have adopted rigorous procedures for handling our CGMS data.
Interpretation and identification of variables
First, data from each 72-h CGMS monitoring period are exported from product-specific software to Microsoft (Redmond, WA) Excel®. Although the device-specific software summarizes glucose variables for clinical use, these variables do not necessarily represent those specific to a research context. Exporting the data gives the option for use of a printed record from the entire monitoring period. The data are manually inspected for (1) the expected rise/fall after a meal (appropriate directionality), (2) values that are ≥2 SD from the immediate previous value, (3) relative correspondence with the meter glucose value used for calibration, and (4) the relationship between the glucose value and the signal (ISig) from the CGMS sensor (Medtronic MiniMed, Northridge, CA). 39 Inconsistent data that do not meet these criteria are not used in the calculations. We exclude data that do not correspond to the meter preprandial or steady-state glucose value within 20 mg/dL within that timing vicinity or if they are outliers (defined as ≥2 SD from the immediate surrounding values). The variables outlined in Table 1 are then identified and marked using the patient's log, upon which meal start times, meter glucose values, and all events (including changes in physical activity) are noted. For quality control, we utilize a second investigator who subsequently performs the same procedure so that discrepancies are discussed and resolved.
Missing data
If data are missing because of sensor failure, calibration error, or suspected inaccuracy, this time period is not available for analysis. Only if the subject is receiving an identical diet in both calories and macronutrient composition and physical activity is highly controlled on a previous or subsequent day could the missing data be potentially replaced (with time-corresponding data). If small numbers of values are missing during a time of glycemic stability devoid of changes in caloric consumption or activity, the values immediately surrounding the missing period could be used as has been customary in seminal highly controlled studies. 40,41 It is highly recommended that an a priori approach to missing or incongruous data be outlined in detail before any data extraction begins. The individual accuracy of sensors may also be assessed using the mean absolute difference (MAD) (calculated as MAD [mg/dL]=CGMS glucose÷meter glucose) or the mean absolute relative difference (MARD) (calculated as MARD [%]=[MAD÷meter BG]×100). 42 However, use of MAD and MARD are only as accurate as the in vitro meter BG.
Extraction and analysis
Once the data have been interpreted and the variables have been identified, they are extracted from the exported format into a separate worksheet, such as in Microsoft Excel. In this worksheet, the variables are pooled, and mean, AUC, and calculated values are computed. From Excel, data can be transferred to a statistical analysis program of choice. Because of the highly interdependent nature of CGMS values, others caution that traditional statistics may be inappropriate and suggest that mathematical modeling techniques are more suitable. 23
Average across a 72-h period
The goal is to use the mean of two or three consecutive variables across 2–3 days in the final analysis. For example, the mean of 2-h breakfast AUC calculations from 2 consecutive days serve as the overall average 2-h breakfast AUC. There should be three nocturnal periods in 72 h, so three values are averaged for the variable to be used in the analysis (i.e., lowest nocturnal BG, nocturnal BG). 7
Application of Approach Using Unpublished Data in Pregnant Women at Risk for Excess Fetal Growth
Differences in populations of pregnant women at risk for fetal overgrowth without diabetes
We have utilized some of our original unpublished data to illustrate how these measures can be applied to detect differences in glycemia between groups of pregnant women. Using CGMS, it was possible to graphically portray a significantly higher 24-h mean glucose AUC in obese women, of which a minority were later diagnosed with gestational diabetes mellitus, versus normal-weight pregnant women (Fig. 1A) despite fixed diets. Figure 1B provides a more detailed, graphical view of the 24-h mean glucose AUC as distinct patterns between the obese and normal-weight women at 15–16 versus 27–28 weeks of gestation using CGMS® System Gold™ (Medtronic Minimed). In this study, both groups of women were placed on eucaloric diets with a macronutrient content of 50% carbohydrate, 35% fat, and 15% protein. All food was provided. Almost all measures of glycemia within a 24-h period were higher in obese compared with normal-weight women despite a fixed diet in which total calories and macronutrient composition were precisely matched. These general observations are supported by a previous study we published and by others 7,10 in less controlled settings.

Infant adiposity through a CGMS lens
We have observed strong positive associations between our identified CGMS glucose variables and neonatal adiposity across normal-weight and obese women without gestational diabetes. 7,8 As shown in Figure 2 in this unpublished cohort of obese and normal-weight pregnant women in which dual-energy X-ray absorptiometry at 2 weeks of birth was used to measure infant adiposity, these associations were strongest at 27–28 weeks of gestation, compared with gestational week 15–16. In particular, the 1- and 2-h mean postprandial breakfast glucose responses at 27–28 weeks of gestation (including 2-h AUC) were associated with neonatal adiposity at 2 weeks of life across measurement methods (dual-energy X-ray absorptiometry, skinfold calipers; r value range, 0.699–0.867; P<0.02 for all correlations) (Fig. 2). In 2001, Sivan et al. 43 reported that the response to breakfast in pregnant women with gestational diabetes resulted in 2.5-fold higher glucose concentrations. Our observations are consistent with the published literature where postprandial meter glucose was correlated with infant size at birth. 44,45 Thus, across pregnant women, CGMS technology has revealed important differences and associations between maternal glycemia and neonatal adiposity using these data approaches in controlled 8 and less controlled 7 settings.
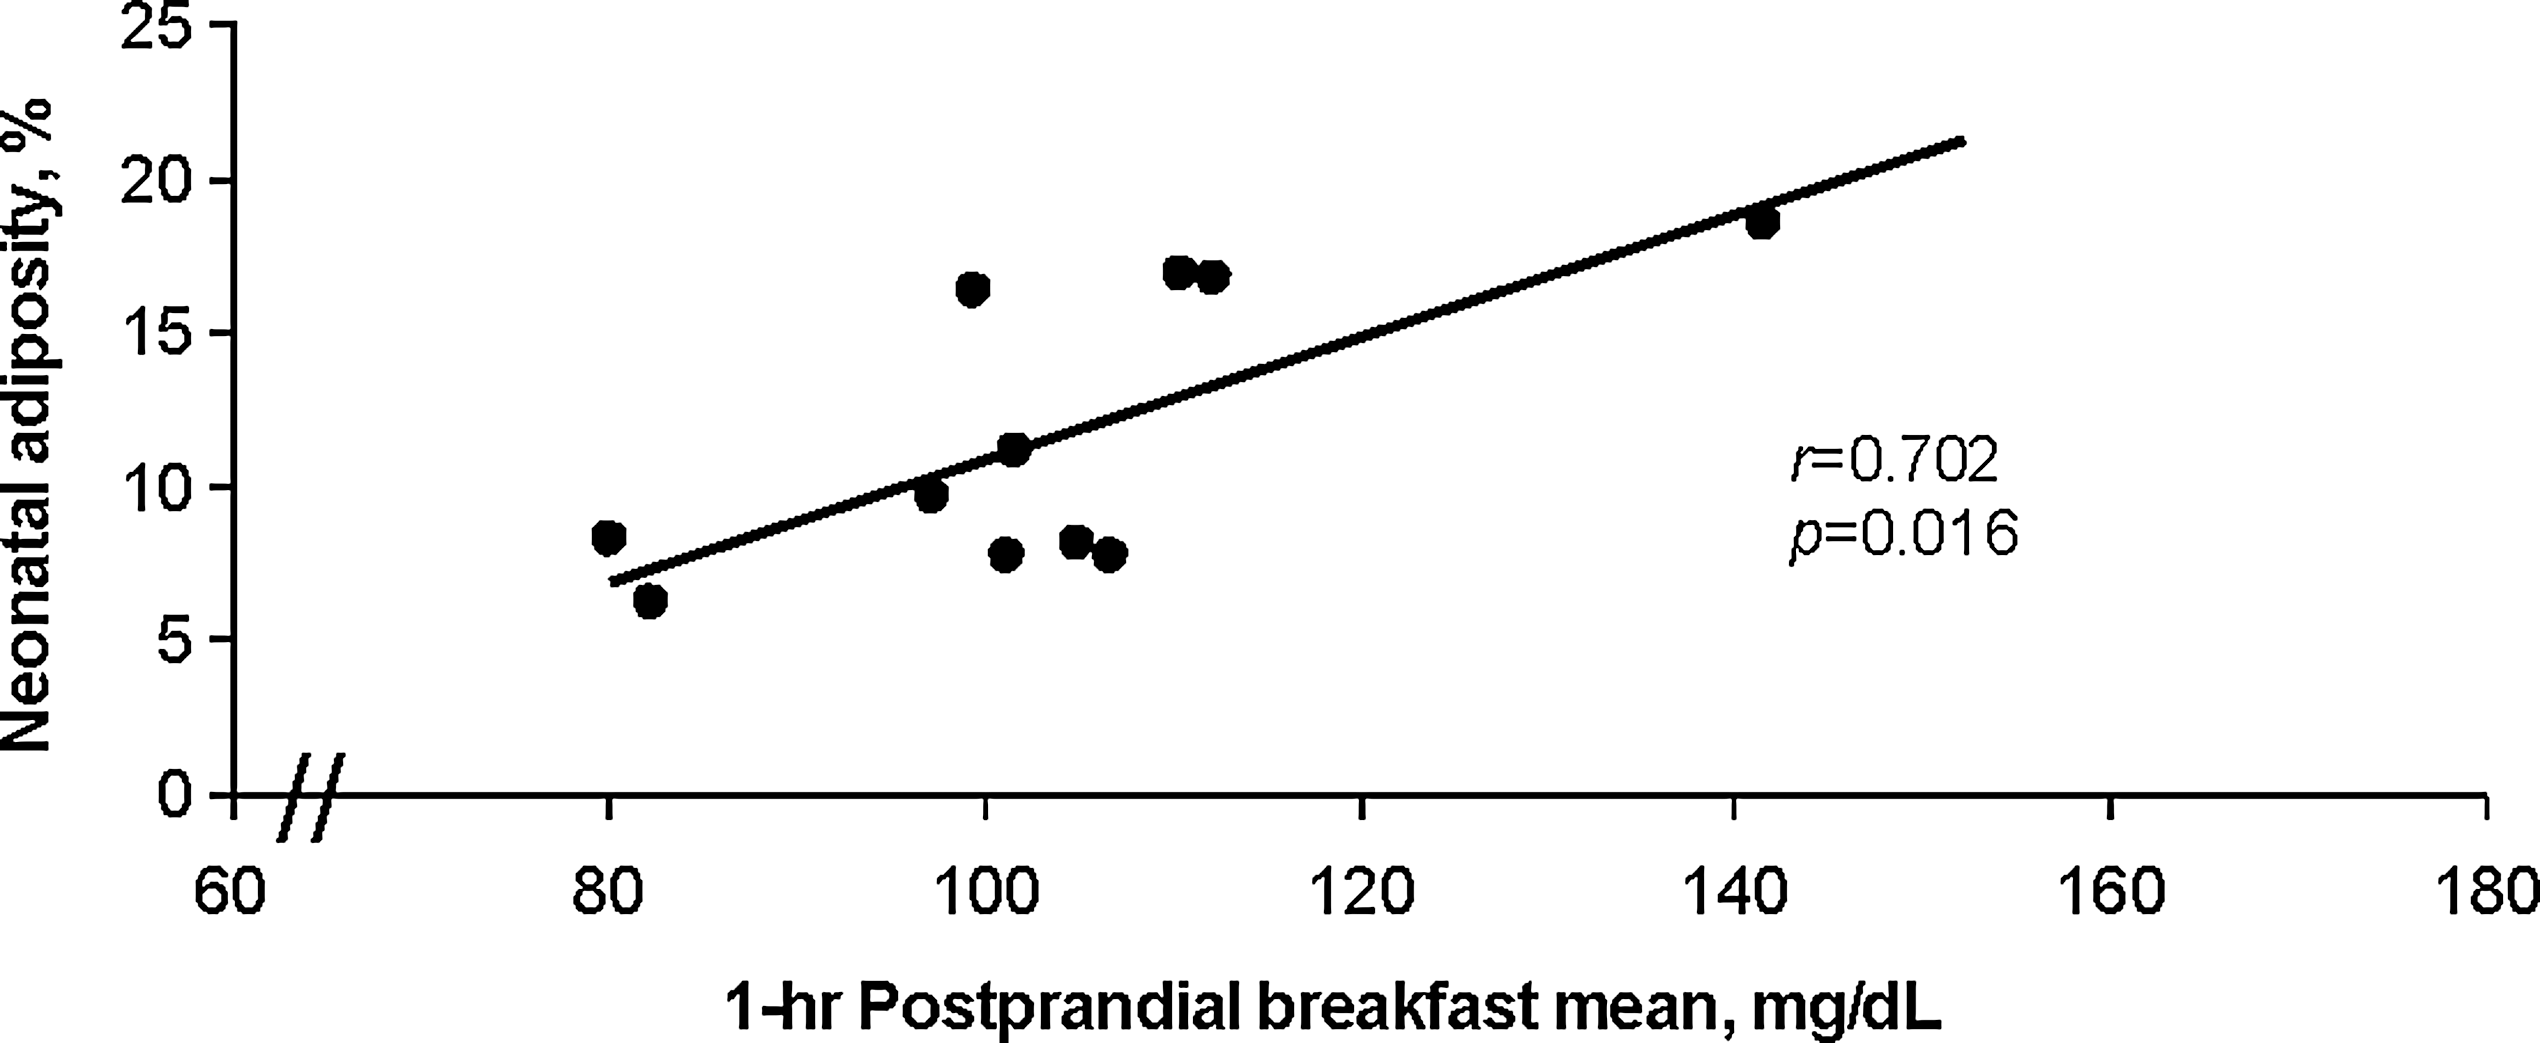
Across normal-weight and obese pregnant women, 1-h postprandial blood glucose level by continuous glucose monitoring system (at 27–28 weeks of gestation) is highly associated with infant's percentage body fat as measured by dual-energy X-ray absorptiometry at 2 weeks of life (n=11).
A salient finding in these pilot data was the continuous positive association between postprandial maternal glucose (including 2-h AUC) at gestational week 27–28 and neonatal adiposity across normal-weight and obese women with or without gestational diabetes mellitus. 8,9 Recognizing the elusive nature of fetal fat accretion and the ability to observe full 24-h patterns of glycemia through CGMS, we further dichotomized women in our preliminary data based on the infant adiposity phenotype (total percentage body fat) instead of the maternal phenotype (body mass index). Figure 3 shows that despite being normal weight or obese, the women who had infants with excess adiposity (≥16%; black line) had higher patterns of glycemia over 24 h and particularly after meals. In fact, in the women who had infants with ≥16% body fat (2 NW, 1 OB, 1 GDM), CGMS revealed a higher fasting glucose, followed by an accentuated postprandial breakfast period, with the other meals following precedence. The illustration demonstrates a novel view of maternal glycemia by infant outcome through CGMS technology.

Comparison of 24-h maternal glycemia between women who had infants with either ≥16% body fat (BF) (n=4) versus <16% BF (n=7). Arrows denote postmeal excursions.
Conclusions
The capacity for CGMS to record consecutive measures throughout a 24-h period in fasting and postprandial states at different gestational ages, while manipulating diet and controlling physical activity, is a powerful tool to better understand glycemic patterns in pregnancy in relation to fetal growth. However, the data are only clinically valuable if the conditions under which they are used are clearly described, variables of interest are carefully defined, and methods to deal with incongruous data are established prospectively. Particularly in pregnancy, more uniform variable definition, handling, and reporting of CGMS glucose data are necessary to further scientific investigation and draw meaningful conclusions. There are likely to be other CGMS-derived glucose variables that are clinically relevant to specific outcomes of other studies in pregnant women, and we encourage clear description of them so that a working methodology might become available in the field. Our understanding of the contribution of glycemic patterns to fetal growth, compared with other nutrients, and how diet and physical activity can modify glucose availability to the fetus will surely increase our knowledge of why some pregnant women, with or without diabetes, deliver infants with excess adiposity who are at risk for neonatal hypoglycemia. A request by editorial review committees for researchers to clearly specify the CGMS measures and analytical approaches used will advance the understanding of both investigators and practitioners as to which glycemic patterns in pregnancy optimize both maternal and fetal outcomes.
Footnotes
Acknowledgments
We would like to acknowledge our support from grants RO1DK 078645 and R21 DK 088324 from the National Institutes of Health, as well as the support of Dr. Jacob Friedman. Further support by NIH/NCRR Colorado CTSI grant UL1 TR000154 is also acknowledged.
Author Disclosure Statement
No competing financial interests exist. T.L.H. and L.A.B. contributed equally to writing and editing this manuscript. The approach to CGMS data outlined in this manuscript was conceived by T.L.H. and mentored by L.A.B.