
Abstract
Background:
The mean absolute glucose (MAG) change, originally developed to assess associations between glycemic variability (GV) and intensive care unit mortality, has not yet been validated. We used continuous glucose monitoring (CGM) datasets from patients with diabetes to assess the validity of MAG and to quantify associations with established measures of GV.
Subjects and Methods:
Validation was based on retrospective analysis of 72-h CGM data collected during clinical studies involving 815 outpatients (48 with type 1 diabetes and 767 with type 2 diabetes). Measures of GV included SD around the sensor glucose, interquartile range, mean amplitude of glycemic excursions, and the continuous overlapping net glycemic action indices at 1, 3, and 6 h. MAG was calculated using 5-min, 60-min, and seven-point glucose profile sampling intervals; correlations among the variability measures and effects of sampling frequency were assessed.
Results:
Strong linear correlations between MAG change and classical markers of GV were documented (r=0.587–0.809, P<0.001 for all), whereas correlations with both glycosylated hemoglobin and mean sensor glucose were found to be weak (r=0.246 and r=0.378, respectively). The magnitude of MAG change decreased in a nonlinear fashion (P<0.001), as intervals between glucose measurements increased. MAG change, as calculated from 5-min sensor glucose readings, did reflect relatively small differences in glucose fluctuations associated with glycemic treatment modality.
Conclusions:
MAG change represents a valid GV index if closely spaced sensor glucose measurements are used, but does not provide any advantage over variability indices already used for assessing diabetes control.
Introduction
Novel measures include the mean absolute glucose (MAG) change, which has been introduced by Hermanides et al. 9 for assessment of GV in intensive care. This measure takes into account all glycemic variations over time—even those remaining in the physiological range—and is obtained by calculating the absolute increments and decrements of glucose from peaks to nadirs per hour. Because of this, MAG was even considered to bear the potential of becoming the “gold standard” for assessment of GV. 10 However, as this measure includes minor as well as major glucose swings and time axis as the coordinate, it does not permit assessment of the real magnitude of glycemic excursions but rather their kinetics, as noted by Monnier and Colette. 11 MAG has recently been used to investigate the association between mortality and blood glucose variability in a multicenter cohort study in critically ill patients. 12 Results of this study showed that the overall mortality was significantly associated with SD and MAGE, but not with MAG. Furthermore, reanalysis of data from the Hyperglycemia and Its Effect After Acute Myocardial Infarction on Cardiovascular Outcomes in Patients with Type 2 Diabetes (HEART2D) study by Siegelaar et al. 13 demonstrated that MAG was significantly decreased when targeting postprandial versus fasting/premeal glycemia, whereas reductions in SD and MAGE were not statistically significant. The outcomes of the two latter studies, in addition to the findings by Hermanides et al., 9 suggest that this variability measure may have different inherent properties compared with classical GV indices. Because these publications used either infrequently sampled blood glucose values or measurements from seven-point self-measured blood glucose profiles, the applicability of MAG for CGM data has not yet been established, and correlations with well-established indices of GV are unclear as is the relationship with traditional markers of glycemic control. Thus validation of MAG appears to be warranted before drawing firm conclusions upon its appropriateness for assessing GV under various disease conditions.
The aim of our study is to validate MAG as an index of GV. To overcome problems inherent in the calculation of such an index from irregularly and infrequently sampled glucose profiles, we used datasets from cohorts of type 1 and type 2 diabetes outpatients who had undergone blinded CGM measurements. We then analyze the influence of distinct frequencies of sensor glucose measurements on the magnitude of MAG and relationships with classical intraday variability indices such as SD, interquartile range (IQR), MAGE, and CONGA as well as with measures of average glycemia (i.e., glycosylated hemoglobin [A1C] and mean sensor glucose [Mean SG]).
Research Design and Methods
We performed retrospective analyses of anonymized ambulatory CGM profiles previously collected from outpatients with diabetes mellitus. The CGM datasets were analyzed using MiniMed Solutions software (Medtronic MiniMed, Northridge, CA). Glucose profiles with more than four blood glucose meter calibrations per day and ≥48 h of continuous monitoring per patient (mean duration, 69 h) had been downloaded and used for calculations of GV indices and parameters of average glycemia. Data not meeting strict validity criteria of the manufacturer were excluded.
Collection of CGM data
CGM data collected for outpatients with type 1 as well as type 2 diabetes during the Diabetiva Program, 14,15 an integrated national diabetes care network of general practitioners, diabetes specialists, healthcare providers, and the health insurer BKK Gesundheit, were analyzed. Before inclusion in the Diabetiva Program, all study participants had provided their written informed consent. Ethical approval, however, was not required for this retrospective data analysis.
Calculation of indices
Using the CGM datasets, the following measures of intraday glucose variability were calculated: IQR, MAGE, CONGA, 6 and the overall SD around the sensor glucose (SD). 4 With the exception of MAGE, 16 they were calculated for each day and then averaged over the CGM periods. We calculated CONGA1, CONGA3, and CONGA6 for the three time periods 1 h, 3 h, and 6 h, respectively. MAG was calculated according to the formula MAG=Σ |ΔGlucose|/ΣΔTime, as described by Hermanides et al., 9 and is expressed as mmol/L/h and mg/dL/h where appropriate. However, instead of using blood glucose values infrequently collected from traditional glucose meter or laboratory measurements, we used CGM data throughout to quantify MAG by calculating change of sensor glucose at sampling intervals of 5 min (288 CGM points per 24 h) or 60 min (24 CGM points per 24 h) and according to a seven-point glucose profile (seven CGM points per 24 h). The seven-point testing, including sensor glucose measures during 24 h with no equally spaced observations from fasting, morning postmeal, midday pre- and postmeal, and evening pre- and postmeal until fasting next day, was performed analogous to sampling times given in the reanalysis of the HEART2D study. 13 Postmeal sensor glucose was defined as the value obtained at 2 h after meal intake.
Statistical analyses
Data are presented as mean±SD values unless otherwise specified. The relationships between the MAG change calculated from the CGM data and traditional GV indices were evaluated by Pearson's correlation analysis. Between-treatment group comparisons were performed using one-way analysis of variance. The influence of spacing of glucose measurements on MAG values was tested for statistical significance using the Wilcoxon Signed Rank Test. A P value of <0.05 was considered significant. All statistical analyses were performed using Statistical Package for the Social Sciences software (version 17.0; SPSS, Chicago, IL).
Results
Complete CGM (CGMS® Gold™; Medtronic MiniMed) and clinical datasets from a total of 815 outpatients (551 men and 264 women) with type 1 (n=48) and type 2 (n=767) diabetes were available for assessment of GV and diabetes control. Mean age of the patients was 64.7±10.2 years, diabetes duration was 12.4±9.7 years, body mass index was 30.9±5.6 kg/m2, and intake of carbohydrate was 119±34 g/day. Patients with type 1 diabetes had been treated with intensified conventional insulin therapy. Patients with type 2 diabetes had received diet (n=65), oral antidiabetes drugs (n=273), oral antidiabetes drugs plus insulin (n=210), or insulin alone (n=267) for their glycemic control. Categories of baseline A1C in both patient cohorts were <6.5% (n=243, 30%), 6.5–7.0% (n=193, 24%), 7.0–7.5% (n=166, 21%), 7.5–8.0% (n=92, 11%), and >8.0% (n=121, 15%).
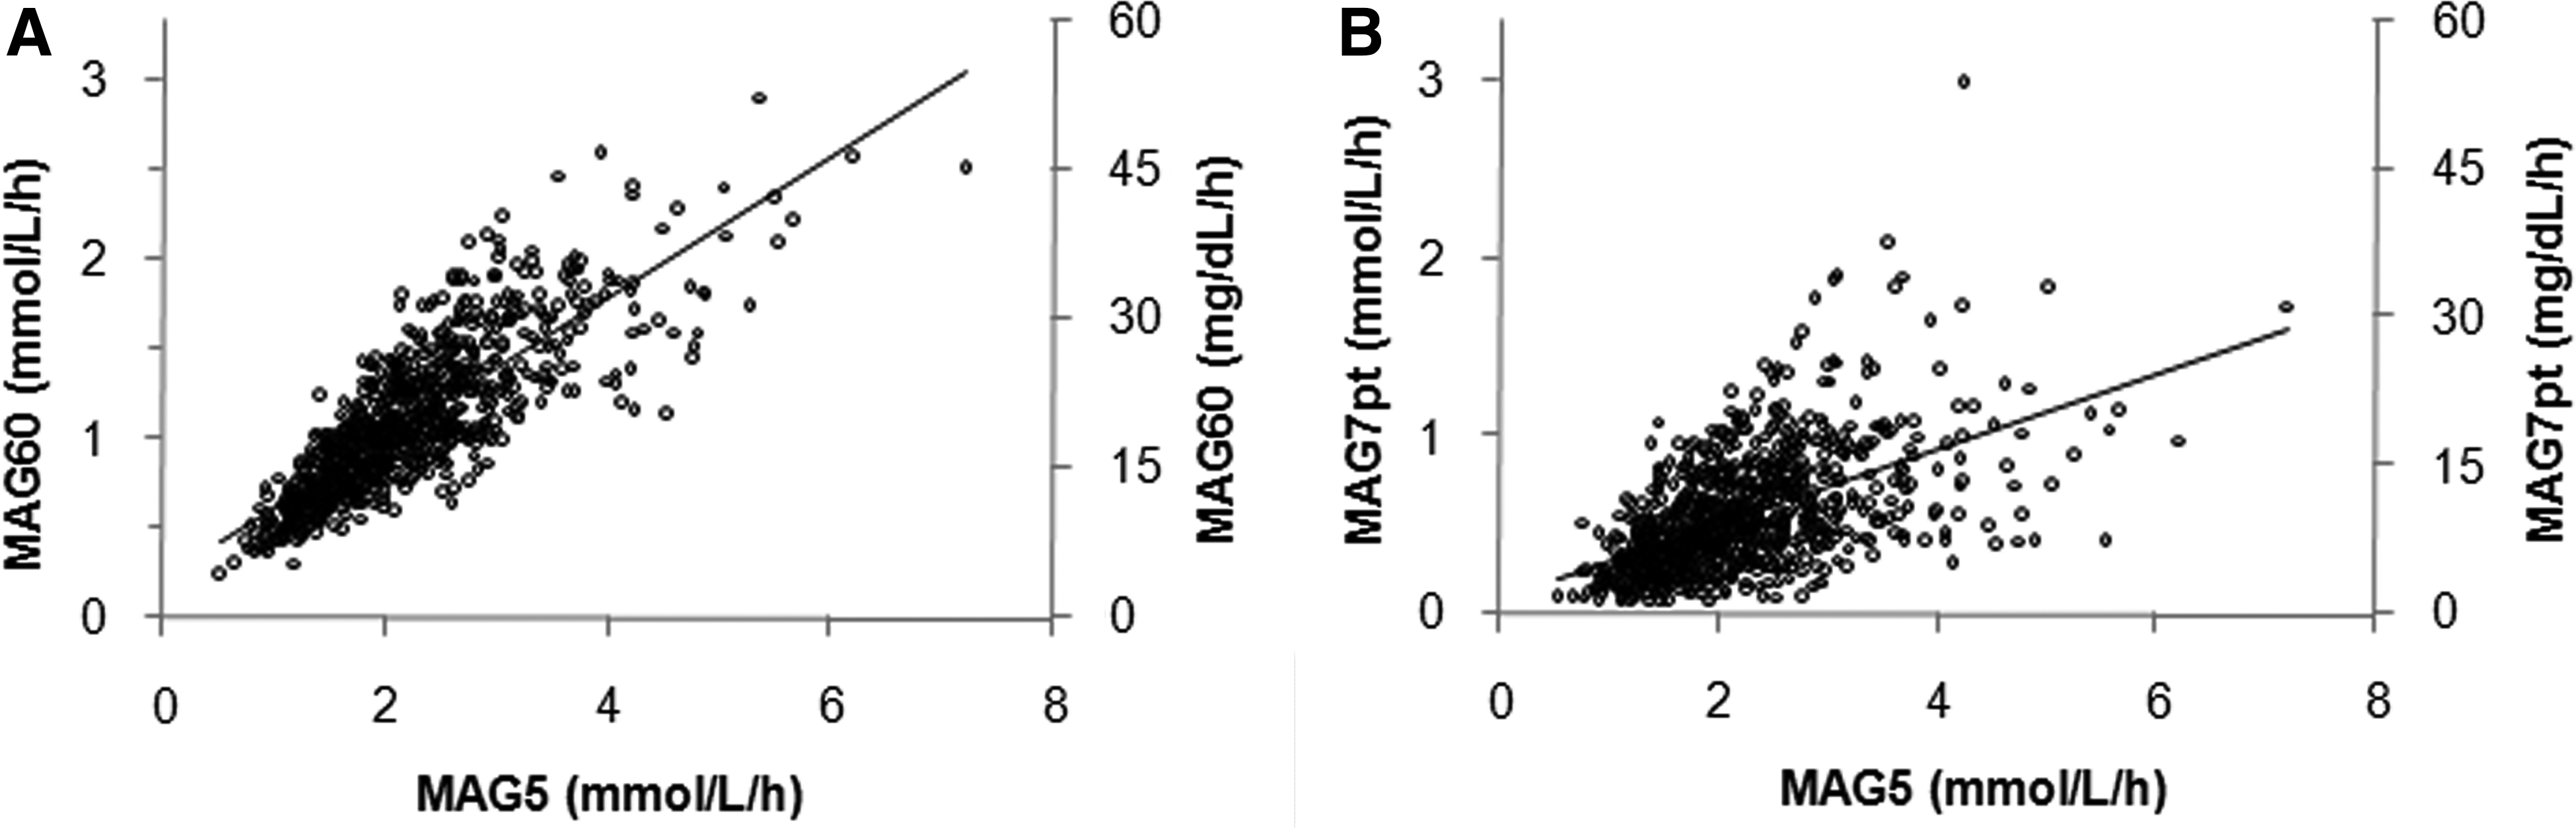
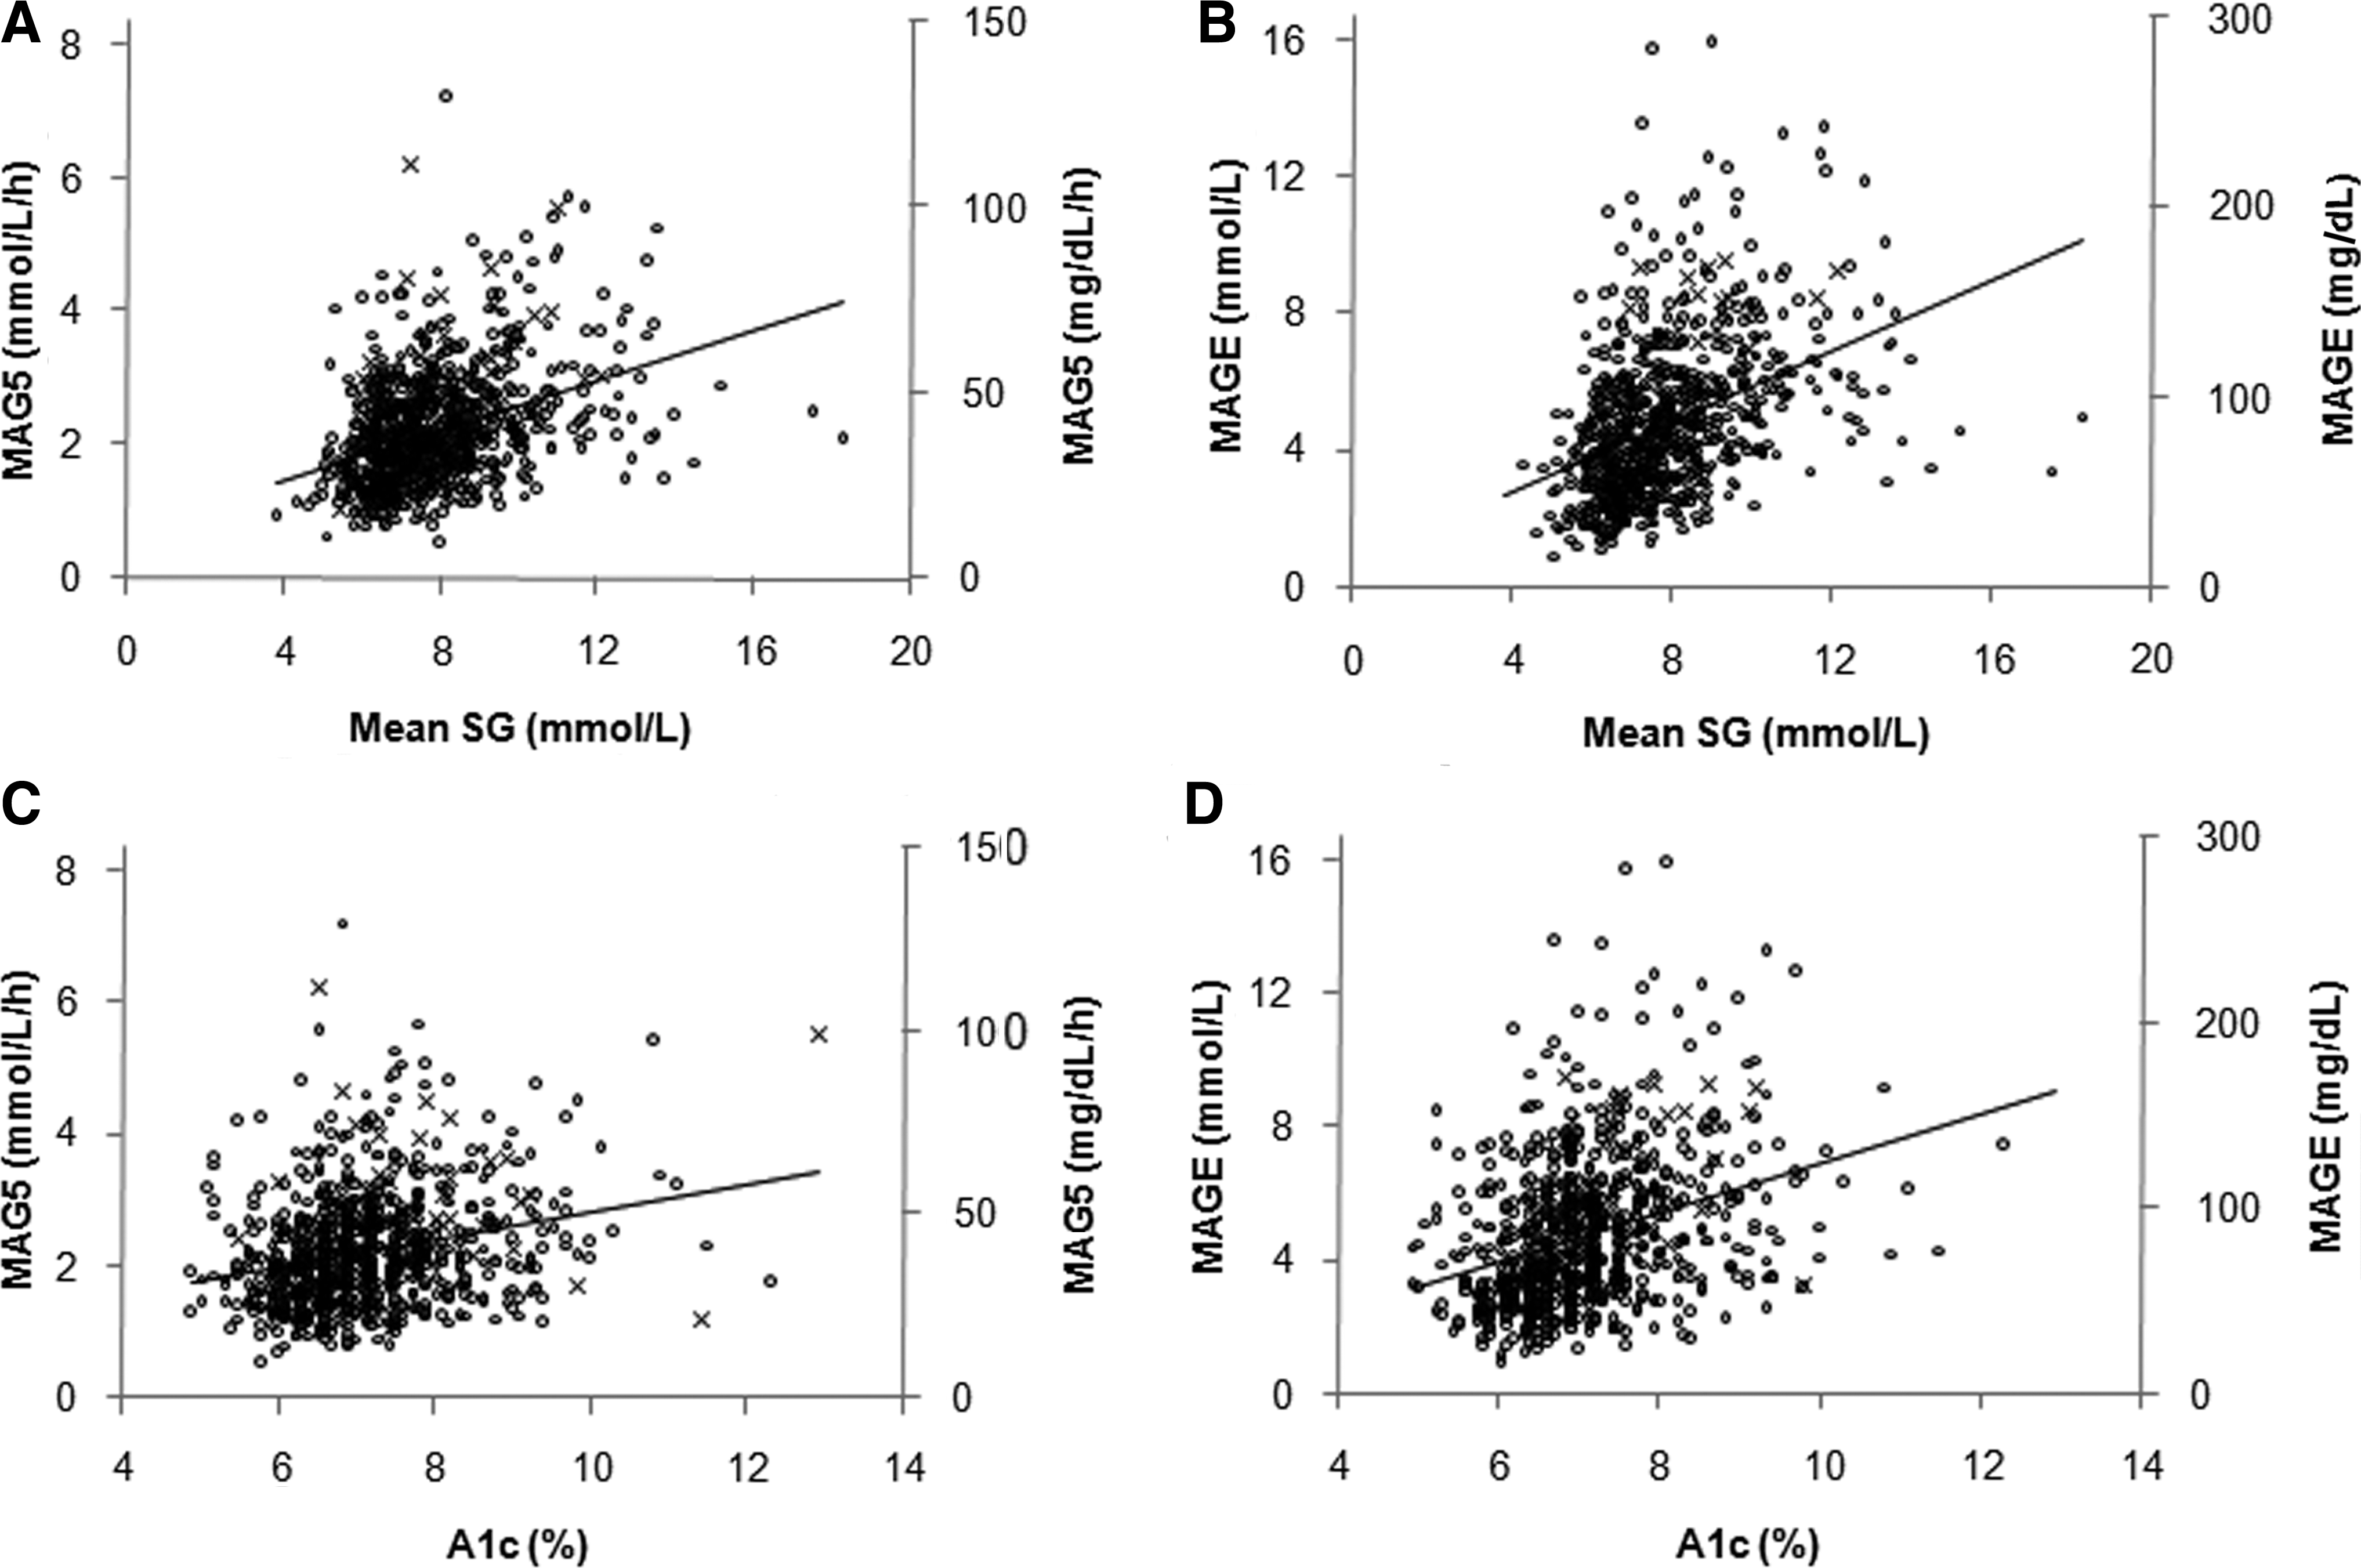
Table 1 shows that MAG calculated from CGM traces according to the 5-min sampling interval directly provided by the CGM system (MAG5) was significantly and highly correlated with widely used indices of intraday GV, although the correlation coefficients were different, with a range of r=0.587–0.809 (P<0.001 for all). The weakest correlation among the variability indices was observed between MAG5 and MAGE (r=0.587), indicating somewhat different information provided by these two indices. Compared with 5-min glucose sampling (MAG5), calculation of MAG from 60-min spaced CGM measurements (MAG60) resulted in higher levels of correlation with all GV indices (r=0.822–0.979). The correlation between MAG60 and MAG5 was strong (r=0.822, P<0.001), whereas computation of MAG from CGM profiles, using seven-point glucose measurement intervals (MAG7pt), gave weaker correlation coefficients with MAG5 and MAG60 (r=0.542 vs. 0.745, respectively; P<0.001). The associations between these variables, as demonstrated in Figure 1, were linear with greater variation at higher MAG values. Figure 1A shows the correlation between MAG60 and MAG5, whereas the weaker correlation between MAG7pt and MAG5 is shown in Figure 1B. The data for correlations between MAG5 and measures of glycemic control, which were only moderate with correlations coefficients of r=0.378 for Mean SG and 0.246 for A1C, are presented graphically in Figure 2A and C. Using the MAGE index yielded somewhat stronger correlations than those observed with MAG5 for both Mean SG (r=0.414, P<0.001) and A1C (r=0.328, P<0.001), as shown in Figure 2B and D. Similar levels of correlation as with MAGE were found between SD and Mean SG (r=0.471) and A1C (r=0.362) (P<0.001 for both) (data not shown). To emphasize further what is shown in Table 1, the graphs in Supplementary Figure S1 (Supplementary Data are available at
Overall relationships of mean absolute glucose (MAG) change using 5-min glucose sampling (MAG5) with measures of glycemic control
The Pearson correlation coefficients (r) are shown. P values (two-sided) are <0.001 for all correlations.
CONGA1, CONGA3, and CONGA6, continuous net glycemic action calculated for time periods of 1 h, 3 h, and 6 h, respectively; IQR, interquartile range; MAG5, MAG60, and MAG7pt, mean absolute glucose change per hour per patient for 5-min, 60- min, and seven-point profile sampling intervals, respectively; MAGE, mean amplitude of glycemic excursions; SD, total SD of all sensor glucose values.
Table 2 shows that the magnitude of MAG was dependent on the interval between consecutive sensor glucose measurements. The mean level of MAG decreased as the interval between the CGM points increased (i.e., the number of glucose data points dropped from 288 to 24 to seven per 24-h period, according to 5-min, 60-min, and seven-point glucose sampling frequency, respectively. For both type 1 and type 2 diabetes patients, MAG values were approximately three- to sixfold lower when calculated from seven-point profiles than from 5-min spaced glucose measurements. Moreover, as the frequency of glucose measurements decreased, the relative error increased across the treatment groups, from approximately 37% for 5-min sampling to 55% for seven-point sampling. The association between the magnitude of MAG and sampling frequency (r=0.763, P<0.001) was nonlinear (see Supplementary Fig. S2). Comparison with well-established indices (Table 2) clearly demonstrated that irrespective of the kind of index used, there is a progressive increase in GV when moving from diet to insulin treatment in the type 2 diabetes groups and finally to type 1 diabetes. The percentage difference in GV between type 2 diabetes patients treated with diet and those receiving insulin was similar for IQR, SD, and MAGE (85%, 78%, and 74%, respectively) but was smaller for CONGA1 (47%) and MAG5 (35%).
Data are mean±SEM values (mmol/L) except for mean absolute glucose (MAG) change, which is in mmol/L/h for the number of patients given in parentheses. Comparison between sampling intervals within treatment groups was done using the Wilcoxon Signed Rank Test (P<0.001 for all comparisons).
CONGA1, continuous net glycemic action calculated for a 1-h time period; IQR, interquartile range; MAGE, mean amplitude of glycemic excursions; OAD, oral antidiabetes drug; SD, total standard deviation of all sensor glucose values.
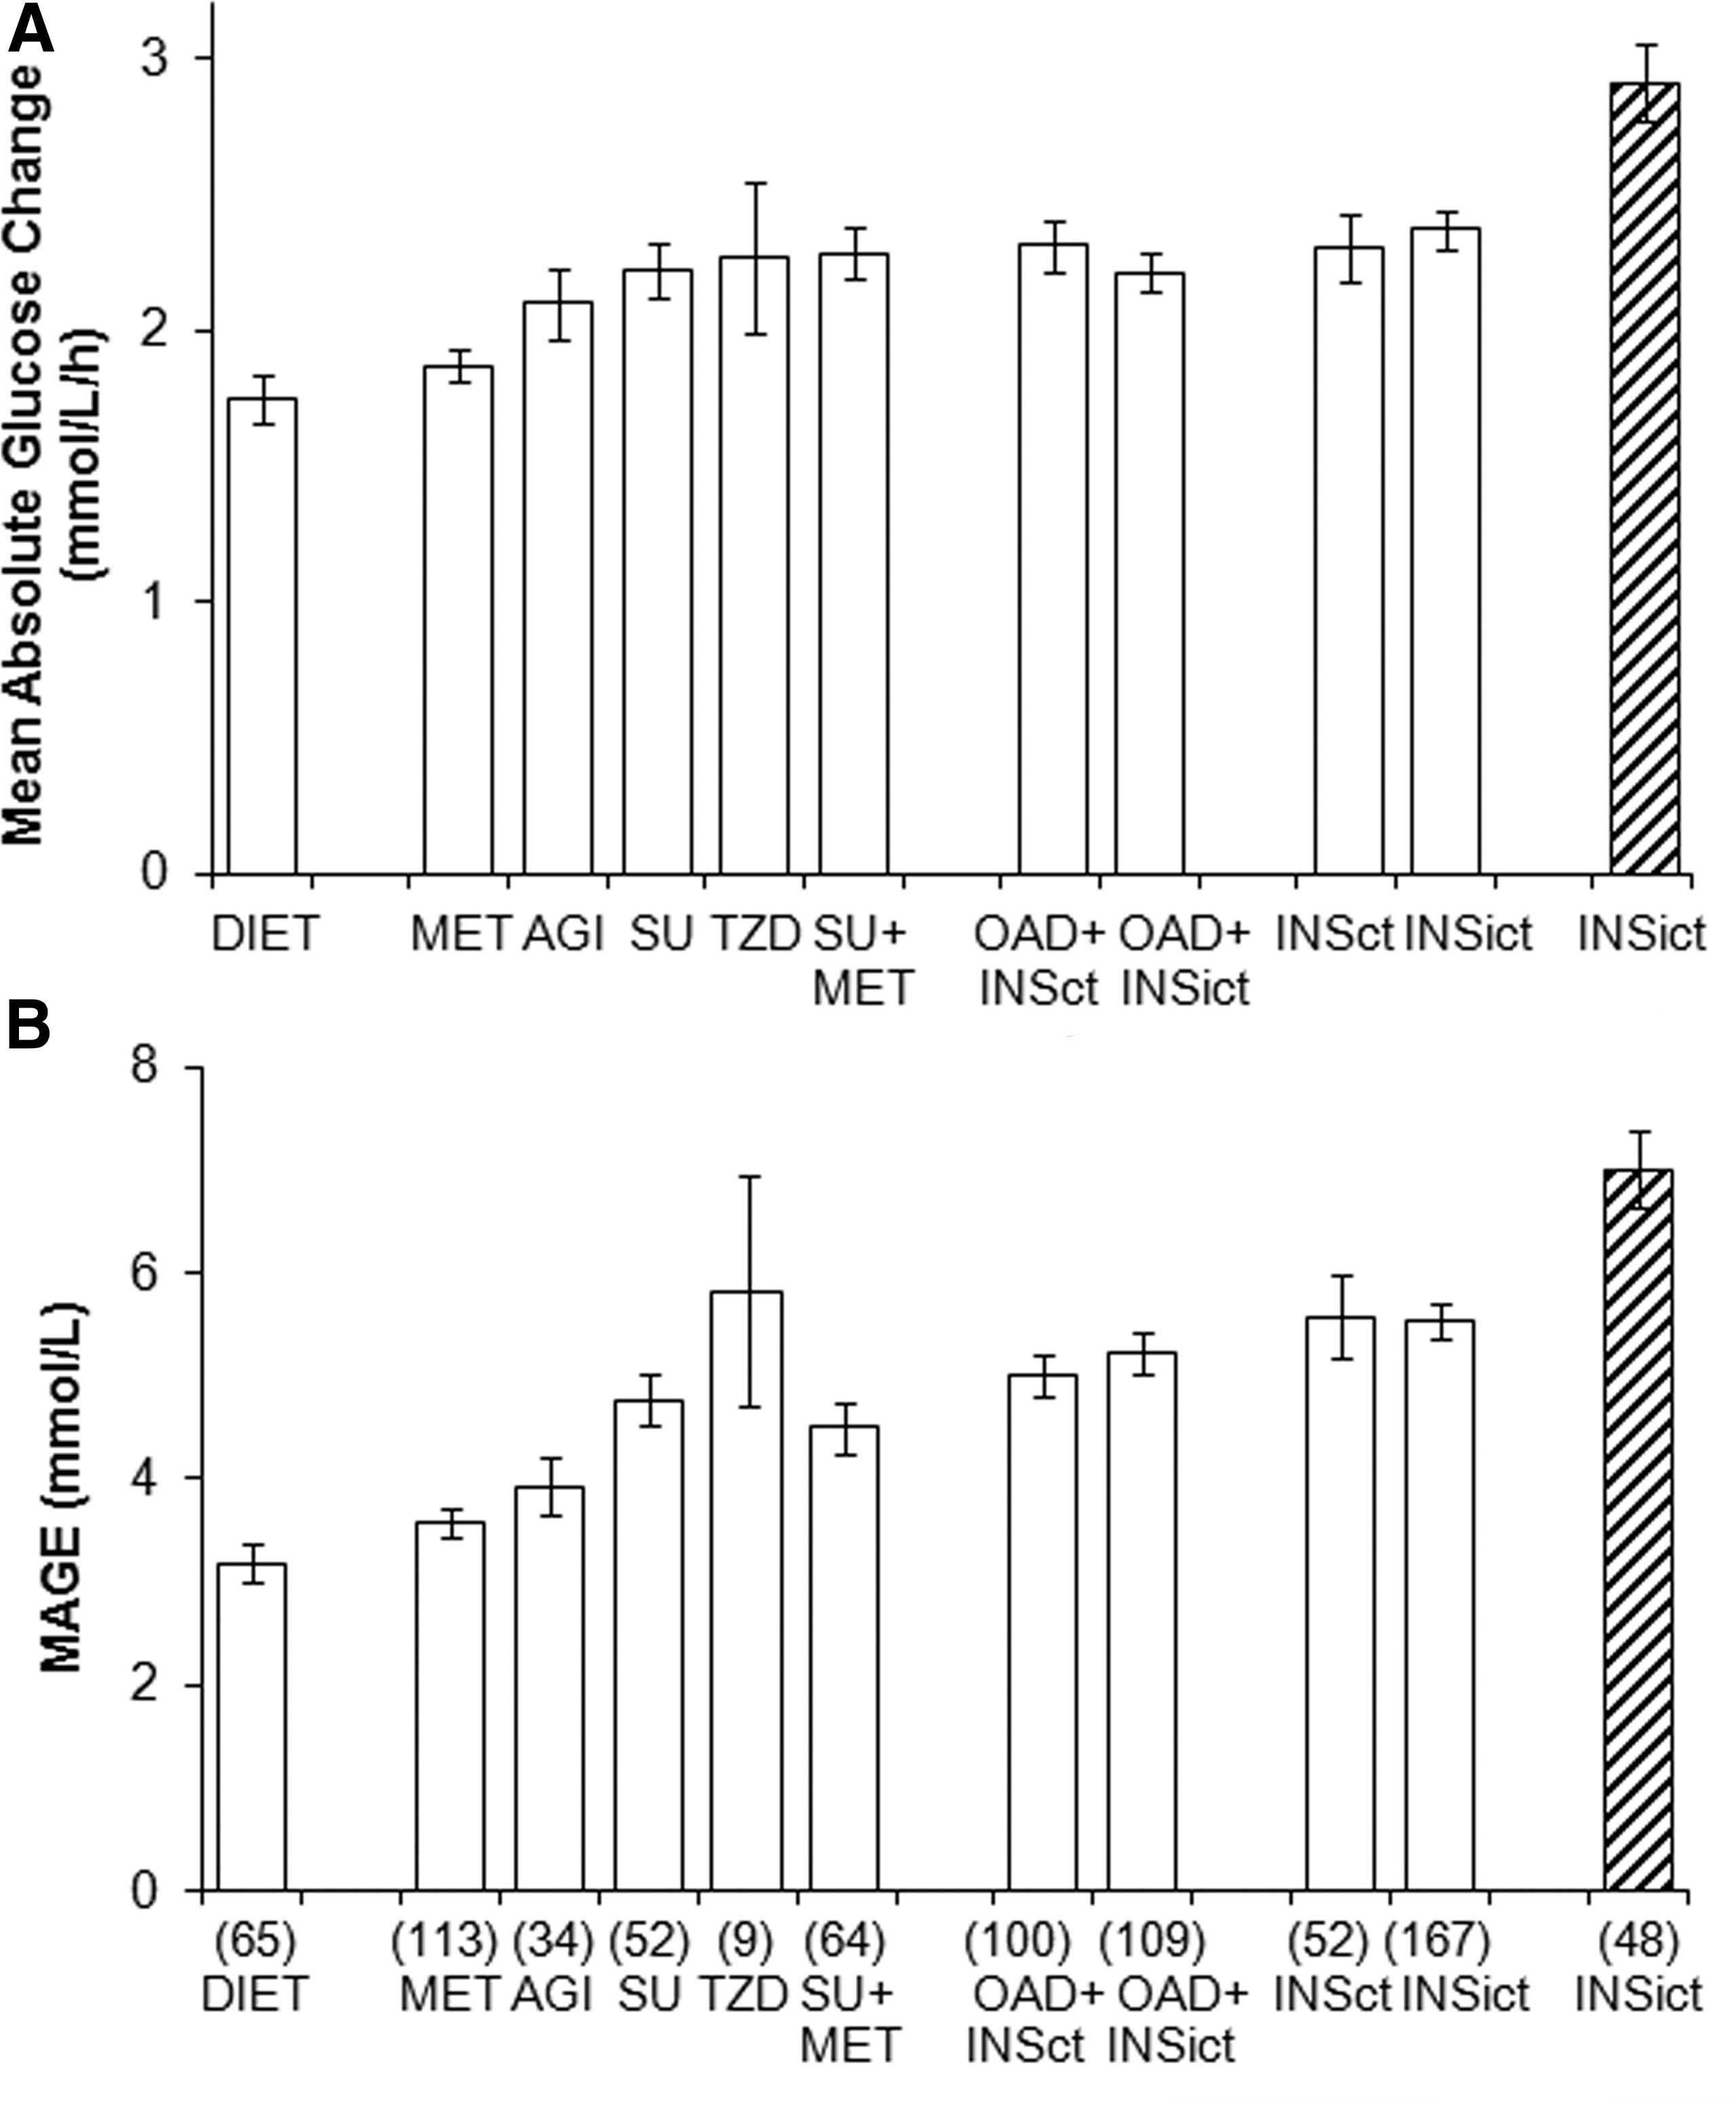
Detailed analysis of the effect of various antihyperglycemic agents revealed that the magnitude of MAG was dependent on the therapy regimen. Figure 3 illustrates results of pharmacological intervention in type 1 and type 2 diabetes. Mean MAG5 values consistently increased from diet to thiazolidinedione and oral antidiabetes drugs combination therapy, reaching levels in patients on oral antidiabetes drugs plus insulin that were similar as those on insulin alone, in order to increase further in patients with type 1 diabetes. The mean values shown in Figure 3A did not greatly differ across the treatment categories. However, using MAGE (Fig. 3B) or SD (data not shown), the changes in GV by various antihyperglycemic treatments could be better distinguished between the patient groups than with MAG5.
Comparison of glucose profiles with increasing time intervals between consecutive observations disclosed that particularly postmeal glycemic excursions were not sufficiently captured (see Supplementary Fig. S3), which explains the lower MAG values found with seven-point testing.
Discussion
MAG change has primarily been used to characterize the association of blood glucose variability with outcome of critically ill patients. 17 Only recently has this index been applied in the reanalysis of the HEART2D study to assess whether decreased GV results in reduction of cardiovascular events in type 2 diabetes patients. 13 With the exception of a recent study by Hill et al., 18 who have reported normative values for MAG derived from CGM tracings in subjects without diabetes, there is no study as yet that calculated MAG from CGM data of patients with diabetes and measured correlations with commonly used indices of GV.
The present study shows that MAG calculated from 5-min and 60-min spaced CGM points or seven-point glucose profiles correlates closely with often used measures of intraday GV, such as SD, IQR, and MAGE. CONGA n , although not widely used to assess GV, demonstrates significant association with MAG as well. However, although IQR, MAGE, and CONGA n are all very highly correlated with SD, the three kinds of MAG are relatively poorly correlated with SD. In addition, the ratio of MAGE to SD that we identified for the present datasets compares well with previously reported values of Rodbard 4 and our laboratory. 16 We anticipated that when using the 60-min or seven-point sampling interval, levels of correlation would have generally decreased compared with 5-min sampling; however, the opposite could be observed. This apparent discrepancy is most likely due to more small, greatly different glucose variations that are captured at 5-min rather than at 60-min or seven-point sampling intervals. A likely explanation is that using more widely spaced observations may produce smoothing of glucose profiles and thus improved correlations between MAG and the other indices. As expected, glycemic effects of various antidiabetes medications on GV were clearly reflected among the groups of treated patients and differentiated by the levels of MAG. We and others have previously reported similar observations when MAGE was used to characterize GV in differently treated groups of patients with diabetes. 19,20 The present results clearly show that the use of a classical measure such as MAGE or SD for analysis of GV between antidiabetes treatment categories provided better distinction of the therapeutic effects than does the MAG index. We further note that the sensitivity to detect pharmacological effects, as calculated from the percentage difference in GV between the treatment groups, decreased for the indices used on an ordinal scale: IQR>SD>MAGE>CONGA1>MAG. Consequently, it appears to be important to choose the most sensitive index when evaluating optimization of glycemic control by reducing glycemic excursions.
It is particularly noteworthy that the increase of sampling intervals in the present study caused a remarkable decrease in the magnitude of MAG, being most obvious with seven-point glucose measurements (intervals as in the HEART2D study 13 ). Our MAG7pt values assort well with those of the HEART2D reanalysis; however, if compared with the MAG5 values presented herein, they were found to be approximately fourfold lower. Thus, seven-point glucose measurements provide poor assessment of GV in patients with diabetes under different treatment conditions and make assessment of therapeutic interventions on reducing glycemic excursions unreliable. The present results are consistent with data by Gottlieb et al. 21 in critically ill patients and with observations in patients with type 1 diabetes that glycemic excursions were two- to fourfold greater when measured by CGM than by seven-point glucose profiles. 22 Moreover, a systematic investigation by Baghurst et al. 23 first showed that the various indices of GV differ in their sensitivity to sampling frequency, and measurement of GV becomes increasingly incorrect if glucose measurements are spaced more than 1 h apart. Although this study 23 did imply that the biases for SD, MAGE, and CONGA n were relatively unaffected by the sampling frequency, our data for MAG demonstrate that the relative error increased as the number of glucose measurements decreased, suggesting introduction of bias. However, from the frequency of glucose measurements used in the present study we could not determine at which sampling range a plateau for MAG values would be attained. In view of these previous data 21 –23 and our present results, the validity of calculating MAG from seven-point glucose profiles or infrequently sampled glucose measurements at different time points—in the study of Hermanides et al., 9 15 min up to 4 h apart—appears questionable. It is thus not surprising that reanalysis of the HEART2D trial produced variable results for the three GV measures used. 13 Even if measurements for computation of MAG would be obtained at constant time intervals by conventional self-monitored blood glucose, it is uncertain whether peaks and nadirs in individual glucose profiles could be sufficiently captured. In particular, postprandial glucose profiles are characterized by a first glucose response followed usually by a varying number of smaller secondary excursions with periods of 20–30 min. 24 MAG appears to be sensitive to such secondary excursions, in contrast to MAGE, for example, which considers only the clinically relevant mean amplitudes. Thus, glucose measurements randomly sampled and at variable time intervals will inevitably lead to an unacceptable percentage error for this variability index.
This retrospective analysis has shown that there are strengths and weaknesses associated with the use of MAG to assess GV in patients with diabetes. If computed from CGM traces, according to the 5-min sampling interval, MAG is closely related with well-established, widely used indices of GV but less with measures of glycemic control and accurately reflects changes in glucose fluctuation by different therapeutic interventions in both type 1 and type 2 diabetes. Most important is that MAG is sensitive to sampling frequency 25 and does not assess the lower end of the glycemic spectrum. 26 Cautious interpretation is thus required when used for comparison of different treatment strategies to reduce GV in patient cohorts with variable glucose measurement frequencies. Even though we have not directly compared CGM traces with conventional blood glucose profiles in the same patient under identical conditions, it appears that estimation of GV by time-based indices such as MAG change is most appropriately performed using continuous glucose sensing. However, with regard to the present data and the fact that MAG has not gained widespread use, we think that this index does not deserve to be used as a reference for assessment of GV.
Footnotes
Author Disclosure Statement
All authors declare no potential financial interest or any commercial association that might present a potential conflict of interest. All authors declare that no competing financial interests exist.
References
Supplementary Material
Please find the following supplemental material available below.
For Open Access articles published under a Creative Commons License, all supplemental material carries the same license as the article it is associated with.
For non-Open Access articles published, all supplemental material carries a non-exclusive license, and permission requests for re-use of supplemental material or any part of supplemental material shall be sent directly to the copyright owner as specified in the copyright notice associated with the article.