
Abstract
Background:
Type 2 diabetes mellitus (T2DM) is a multifactorial disease resulting from ineffective use of insulin in the body. Single nucleotide polymorphisms (SNPs) in genes for scavenger receptors such as CD36 have been implicated in the pathogenesis of atherosclerosis and cardiovascular diseases in diabetes. The present study evaluated the effect of genetic polymorphisms of the CD36 gene on the risk of developing T2DM. Four SNPs in the CD36 gene (–178A→C in the promoter region, rs1984112 [A→G in exon 1A], rs1527479 [T→C in intron IB], and rs3211938 [T→G in exon 10]) were screened in T2DM patients and healthy controls (n=100 each).
Materials and Methods:
Analysis of CD36 gene polymorphisms was performed by polymerase chain reaction–restriction fragment length polymorphism. Statistical analysis was done by Fisher's exact test and χ2 statistics using SPSS version 15.0 software (SPSS, Inc., Chicago, IL), whereas SHEsis software (available at
Results:
There was genotypic association of rs3211938 (T→G) polymorphism with T2DM (P=0.046), whereas rs1984112 (A→G) and rs1527479 (T→C) SNPs showed no association. The minor alleles of SNPs (“G” of rs1984112, “C” of rs1527479, and “G” of rs3211938) showed significant association with clinical profiles in T2DM patients (P<0.05). Analysis also showed that the “GCG” haplotype had a significant association with T2DM (P=0.026; odds ratio=3.12; 95% confidence interval 1.089–8.939). Significant association of the CD36 gene was confirmed by linkage disequilibrium patterns.
Conclusions:
The CD36 variants may help to determine the T2DM susceptibility in the North Indian population. However, genotyping of variants in more individuals and studies in other populations will be required to validate the results and ethnic variations.
Introduction
CD36, also known as fatty acid translocase and platelet glycoprotein IV or IIIb, is a multispecific, integral, 88-kDa membrane glycoprotein expressed on the surface of a wide variety of cell types, including adipocytes, skeletal muscle cells, platelets, endothelial cells, and monocytes/macrophages. 6,7 It modulates platelet function via binding to oxidized low-density lipoprotein (LDL), cell-derived microparticles, and thrombospondin-1. 8 It was predicted that homozygous disruption of the CD36 locus led to hepatic insulin resistance with high plasma levels of free fatty acids and triglycerides. 9 The CD36 gene spans 36 kb (7q11.2–21.11) and comprises 15 alternatively spliced exons that are differentially regulated by several upstream promoters. 10 –12 The CD36 protein plays an important role in lipid metabolism, and its gene polymorphisms are related to hypertension, metabolic syndrome, high-density lipoprotein-cholesterol, and T2DM. 13 –15 In the present work, four single nucleotide polymorphisms (SNPs) (–178A→C in the promoter region, rs1984112 [A→G in exon 1A], rs1527479 [T→C in intron IB], and rs3211938 [T→G in exon 10]) in the CD36 gene were studied in a North Indian population. The first three SNPs are in the upstream regulatory region of the CD36 gene, whereas the fourth lies in the coding region (exon 10) at nucleotide position 1270, which codes for tyrosine in its wild-type condition (T allele). The presence of the G allele leads to a stop codon leading to a premature mRNA and nonfunctional CD36 protein. Therefore, the present study was undertaken to find out the effect of SNPs in such important locations of the CD36 gene in T2DM susceptibility.
Materials and Methods
Ethics
The present study was approved by the institutional ethics committee (protocol number 3742/R.Cell-08, dated October 24, 2008). An informed consent was obtained from all participants. Medical records of these patients were reviewed to ascertain diabetes-associated complications.
Study design
Peripheral blood samples (2 mL each) were collected with and without EDTA after overnight fasting from diabetes patients recruited from the outpatient diabetes clinic. The control healthy individuals were recruited on a random basis from universities, hospitals, and pathology labs. The study duration was from January 2009 to March 2011. The details of inclusion and exclusion criteria for patients and controls were as follows.
Inclusion criteria
The inclusion criteria for T2DM patients were according to National Diabetes Data Group and World Health Organization: • Elevated glucose concentrations (i.e., fasting plasma glucose [FPG]/postprandial glucose [PPG]/random blood sugar on more than one occasion): ∘ FPG: ≥126 mg/dL (7.0 mmol/L) of fasting (8 h or overnight) glucose in venous whole blood. ∘ 2-h PPG: ≥200 mg/dL (11.1 mmol/L) after either consumption of 1.7 g/kg of body weight of anhydrous glucose in 200 mL of water within 1–2 min or 75 g of glucose (oral glucose tolerance test). ∘ Random blood sugar: ≥200 mg/dL (11.1 mmol/L) with classical symptoms.
Exclusion criteria
Individuals with the following conditions were excluded: • Pregnant or nursing mother • Patients diagnosed of psychotic disorder or hospitalized for depression • Patients with other types of diabetes such as maturity-onset diabetes in the young, latent autoimmune diabetes in adults, gestational diabetes, and diabetes due to any type of pancreatic injury • Patients having fluctuations in glucose reading in multiple examinations
Criteria for selection of normal subjects
Normal subjects met the following requirements: • Normal healthy age/sex-matched controls have been included. • There was no family history of any specific disease/allergy/infection/inflammatory responses, including diabetes. • The subject should have a normal body mass index (BMI) and normal FPG/PPG.
Selection and description of participants
Subjects with pre- and postprandial glucose concentrations of ≥126 mg/dL and ≥200 mg/dL, respectively, were included in the diabetes group. BMI and waist-hip ratio were calculated by measuring height, weight, and waist circumference. Systolic and diastolic blood pressures were measured with the subject in the sitting position with an appropriately sized cuff after a 5-min rest.
Technical information
Biochemical analysis
The blood samples collected in plain vials were centrifuged at 956 g for 15 min, and serum was separated and aliquoted for different biochemical estimations. Biochemical analysis to determine FPG and PPG (mg/dL), serum insulin (mg/dL), total cholesterol, high-density lipoprotein cholesterol, and triglycerides were carried out using Ecoline kits (Merck, Darmstadt, Germany) in a ultraviolet-visible spectrophotometer (Shimadzu, Kyoto, Japan) at their respective wavelengths. 16
Genetic analysis
Genomic DNA was extracted from blood samples of T2DM patients and controls (>40 years old) using the salting out method with slight modifications. 17,18 DNA was checked on a 0.8–1% agarose gel, and its quality and quantity were estimated using a biophotometer (Eppendorf, Hauppauge, NY).
The four SNPs (–178A→C in the promoter region, rs1984112 [A→G in exon 1A], rs1527479 [T→C in intron IB], and rs3211938 [T→G in exon 10]) of the CD36 gene were genotyped in 200 subjects (n=100 each for controls and T2DM patients). SNPs were genotyped using polymerase chain reaction–restriction fragment length polymorphism.
Primers for each SNP were designed using Primer3 software (available at
bp, base pairs; F, forward; R, reverse.
Statistical analysis
Comparison of all clinical parameters between controls and T2DM patients was carried out by t test. Allelic and genotypic frequencies along with carriage rates of polymorphic alleles in patient and control groups were evaluated by Fisher's exact test/Pearsons χ2 test. Hardy–Weinberg equilibrium at individual locus was assessed by χ2 statistics using SPSS version 15.0 software (SPSS, Inc., Chicago, IL). All P values were statistically significant for P<0.05. The odds ratio (OR) with the 95% confidence interval (CI) was determined to describe the strength of association by logistic regression model. Unequal variance two-tailed t test was carried out to correlate various biochemical parameters with genotypes, and Fisher's exact test or Pearson's χ2 test was used to examine the association of different haplotypes.
19
Pairwise linkage disequilibrium (LD) based on the D' statistic for the three SNPs was calculated using SHEsis software (available at
Results
Biochemical analysis
The average age of controls (n=100) and patients (n=100) was 48.12±5.69 years and 53.74±9.14 years, respectively, their respective FPG levels were 83.87±7.75 and 173.78±71.169 mg/dL, and their respective PPG levels were 140.08±10.07 and 275.57±90.72 mg/dL. The BMI (24.47±4.33 kg/m2) was significantly higher, but total cholesterol (230.83±29.00 mg/dL), LDL-cholesterol (165.17±29.18 mg/dL), and high-density lipoprotein-cholesterol (43.85±4.68 mg/dL) levels were slightly lower in T2DM patients. No significant difference was observed in waist-hip ratio, blood pressure, and serum creatinine levels between the T2DM and control groups (P>0.05) (Table 2).
Data are mean±SD values.
Values are significantly different (P<0.05).
BMI, body mass index.
Genetic analysis
The MAF was calculated for each SNP using the genotyping results. The gel pictures showing the genotypes of each SNP are shown in Figure 1. The MAF of –178A→C was found to be <0.01, whereas that of the each of the other three SNPs was >0.01. Because –178A→C was monomorphic in our population, it was excluded from further analyses. The sample size calculated using QUANTO software was found to be within 100 for the other three SNPs studied (rs1984112, rs1527479, and rs3211938). Polymorphic studies of these three SNPs were found to be in Hardy–Weinberg equilibrium. Results of allelic and genotypic frequencies as well as carriage rates in controls and T2DM patients are summarized in Table 3.
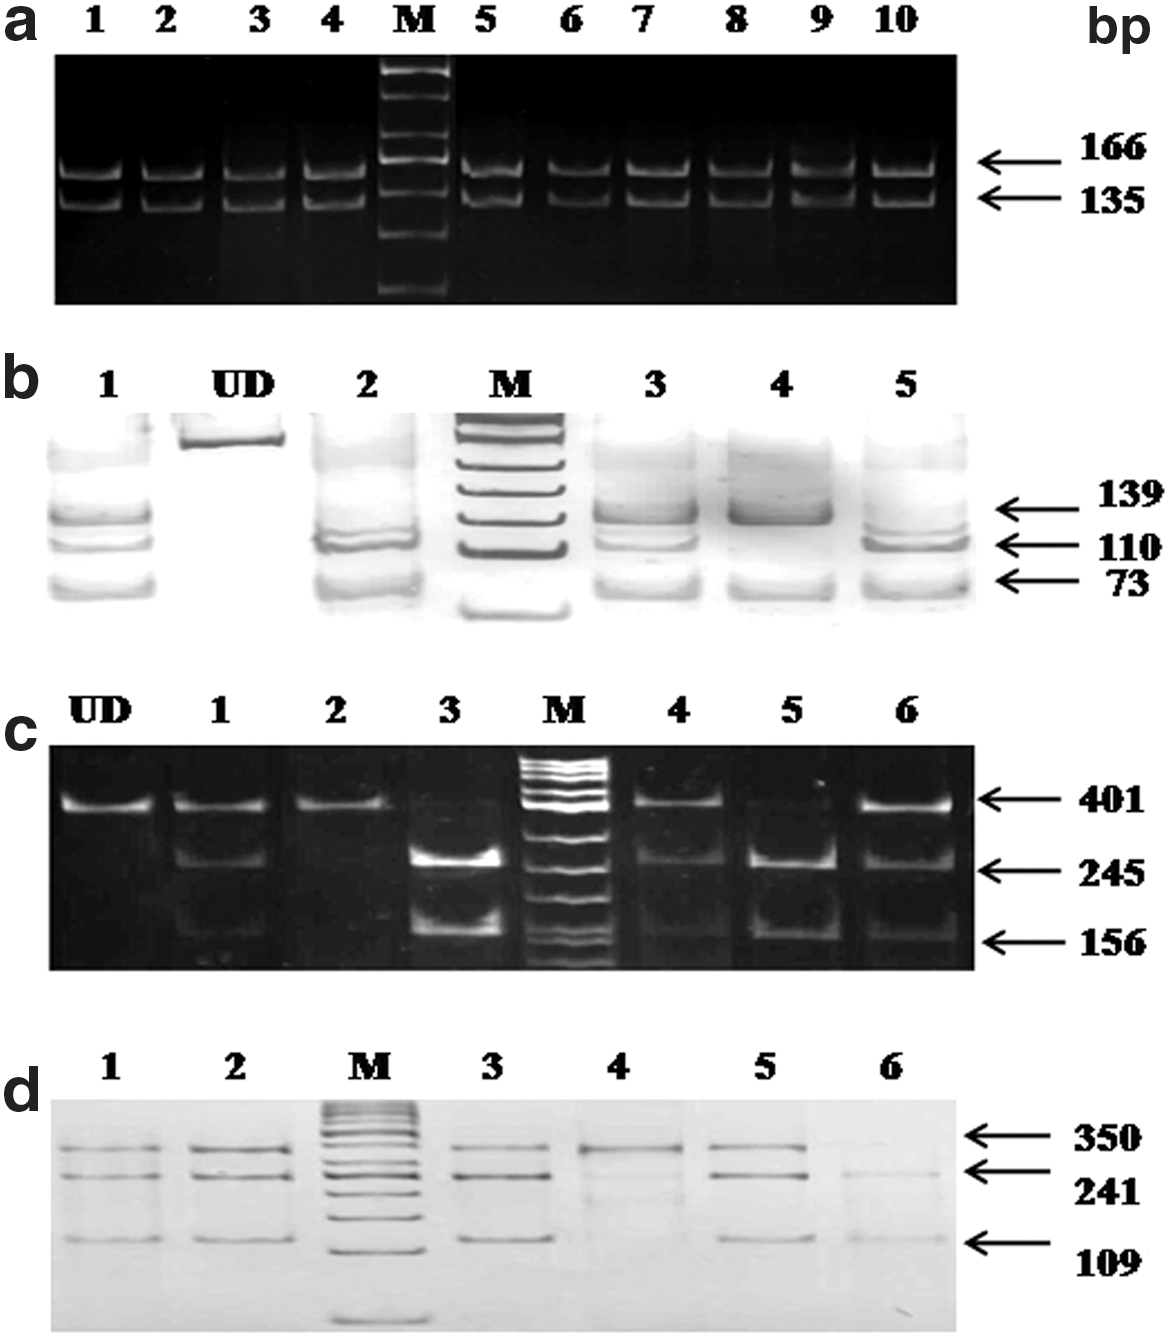
Results of electrophoresis.
Number of respective alleles in the study population.
Number of genotypes in the study population.
Number of carriers of alleles in the study population.
Significant difference.
CI, confidence interval; OR, odds ratio; SNP, single nucleotide polymorphism; T2DM, type 2 diabetes mellitus.
The rs1984112 (A→G) and rs1527479 (T→C) polymorphisms did not show any allelic or genotypic association with T2DM (Table 3). However, a marginal genotypic association (P=0.046) was observed in the case of the rs3211938 (T→G) polymorphism. The heterozygous genotype “TG” seemed to confer susceptibility to T2DM (OR=2.380; 95% CI 0.906–6.70) (Table 3).
Correlation of SNP genotypes with biochemical parameters showed a significant association with T2DM in the presence of minor alleles of all three SNPs (P<0.05) (Table 4). Total cholesterol and lipid profiles showed significant differences in patients. However, BMI was found to be significantly associated only with the “G” allele of the rs1984112 (A→G) polymorphism (P=0.021) (Table 4).
Data are mean±SD values.
Values are significantly different (P<0.05).
FG, fasting glucose; HDL, high-density lipoprotein; LDL, low-density lipoprotein; PPG, postprandial glucose; SC, serum creatinine; TC, total cholesterol; TG, total triglycerides; VLDL, very low-density lipoprotein.
Haplotype analysis
Haplotype analysis showed eight different combinations of genotypes at the three polymorphic loci. Among them, the GCG* haplotype showed significant association (P=0.026) with T2DM (OR=3.12; 95% CI 1.089–8.939) (Table 5). LD patterns according to position of variants within the gene were examined and showed strong statistical significance for two combinations: rs1984112:rs1527479 (D′=0.623; P<0.001) and rs1527479:rs3211938 (D′=0.634; P<0.001). The correlation coefficient (r 2) values of frequencies rs1984112:rs1527479, rs1984112:rs3211938, and rs1527479:rs3211938 were 0.120, 0.004, and 0.162, respectively (Fig. 2).

Linkage disequilibrium (D') and correlation coefficient (r
2) for three single nucleotide polymorphisms in the CD36 gene in a North Indian population with type 2 diabetes mellitus. Pairwise linkage disequilibrium in subjects is represented as dark gray squares for strong linkage disequilibrium and light gray squares for little or no linkage disequilibrium. Color images available online at
Significant difference.
CI, confidence interval; T2DM, type 2 diabetes mellitus.
Discussion
Findings from several groups have demonstrated that high glucose levels are responsible for the main pathophysiological alterations in diabetes. 21,22 Recently, the 2q21 locus was identified as an increased risk factor for T2DM in an Indian population in a genome-wide association study. 23 Another study has shown association of 31 common polymorphisms with T2DM in Indian sib pairs. 24 The association between CD36 gene overexpression and presence of atherosclerotic risk factors, particularly diabetes, shown in this study is in agreement with a common etiology of the disease. 25 The role of the CD36 protein in lipid metabolism and metabolic syndrome prompted us to investigate the association of CD36 gene variants with T2DM. Earlier studies from our laboratory have shown that out of several genetic variants (478C→T in exon 4, dinucleotide deletion [delAC] in exon 5, rs1761667 [G→A] in the –31118 promoter region of exon 1A, and rs1527483 [C→T] in intron 11), the SNP rs1761667 (G→A) showed a highly significant association with T2DM. 14,15 Moreover, there was no evidence of deletion mutation in the CD36 gene in our North Indian population. 18
In the present study, it was demonstrated that only one of the three SNPs, rs3211938 (T→G), had marginal association with T2DM (Table 3). However, individuals with the haplotypic combination “GCG” of the mutant alleles of all studied SNPs (“G” of rs1984112 [A→G in exon 1A], “C” of rs1527479 [T→C in intron IB], and “G” of rs3211938 [T→G in exon 10]) showed significant risk of developing T2DM (OR=3.120; 95% CI 1.089–8.938) (Table 5). Another interesting finding was that the mutant alleles showed relatively greater association with biochemical parameters for T2DM (Table 4). A recent report on genetic variants of the CD36 gene revealed that the “A” allele of rs10499859 (A→G) and the “T” allele of rs1324613 (C→T) were significantly associated with elevated levels of high-density lipoprotein and BMI. 26 Similarly, the raised BMI in North Indian T2DM patients may be attributed to the presence of “G” allele of rs1984112 (A→G in exon 1A) polymorphism.
Therefore, the presence of such alleles can be used as markers for early detection or diagnosis of T2DM. However, a previous study in an African-American population showed a protective role of this particular SNP against metabolic syndrome due to decreased CD36 gene expression. 27
The contribution of CD36 protein in insulin resistance is controversial; however, the deletion of scavenger receptor type B CD36 in rodents has suggested a pivotal role for CD36 mediating inflammation, insulin resistance, and atherogenesis through transport of fatty acids and uptake of oxidized LDL. 28 The effect of CD36 deficiency was clearly seen in the mouse, which exhibited greater than 60% decrease in fatty acid uptake and utilization by heart, oxidative skeletal muscle, and adipose tissues. 29,30 This may therefore become a useful tool in cardiovascular disease risk stratification. 31 Mice with muscle CD36 overexpression had enhanced free fat oxidation in response to contraction. 32 Some genetic cohort studies suggested that CD36 protects against insulin resistance, 33 whereas others did not. 34
Love-Gregory et al. 27 have demonstrated the association of several SNPs across this region, including those resulting in CD36 deficiency and the ones that conferred protection against metabolic syndrome. However, the interaction of these CD36 gene polymorphisms with other genetic determinants and whether they represent a gain or loss of function need to be established. The discrepancy of CD36 being protective depends on whether or not a pro-inflammatory environment generates pathologic CD36 ligands. Diabetes and insulin resistance increase inflammation and reactive oxygen species levels, which may contribute to atherosclerosis both by creating modified LDL ligands and by causing endothelial dysfunction. The CD36 protein not only recognizes pathologic ligands and removes them, but in circumstances of obesity and hyperlipidemia, these ligands also affect inflammatory and insulin signaling pathways in a pathophysiological response via CD36. 30,35 The limited power for analyzing binary traits of the CD36 gene associated with T2DM in the case-control design was the major limitation of our study. Although correction for multiple testing is not required for variants that already have strong prior associations with T2DM, the possibility exists that some of our weaker associations may represent false-positive findings. The limitation of our study may be the small sample size; therefore, individual SNPs except for one did not show significant association (Table 3). However, the CD36 gene with its variants appears to be an important candidate gene and may have a predictive potential on disease susceptibility in the North Indian population. However, further studies are required to validate and determine whether these associations are population specific.
Footnotes
Acknowledgments
The authors would like to thank the Department of Biotechnology, Ministry of Science and Technology, Government of India, New Delhi, India, for funding the work. S.G. would like to acknowledge the receipt of a Rajiv Gandhi National Fellowship from the University Grants Commission, New Delhi, India.
Author Disclosure Statement
No competing financial interests exist.