
Abstract
Background:
Glucose sensors measure glucose concentration in the interstitial fluid (ISF), remote from blood. ISF glucose is well known to be “delayed” with respect to blood glucose (BG). However, ISF glucose is not simply a shifted-in-time version of BG but exhibits a more complex pattern.
Methods:
To gain insight into this problem, one can use linear systems theory. However, this may lose a more clinical readership, thus we use simulation and two case studies to convey our thinking in an easier way. In particular, we consider BG concentration measured after meal and exercise in 12 healthy volunteers, whereas ISF glucose is simulated using a well-accepted model of blood–ISF glucose kinetics, which permits calculation of the equilibration time, a parameter characterizing the system. Two metrics are defined: blood and ISF glucose difference at each time point and time to reach the same glucose value in blood and ISF.
Results:
The simulation performed and the two metrics show that the relationship between blood–ISF glucose profiles is more complex than a pure shift in time and that the pattern depends on both equilibration time and BG.
Conclusions:
In this in silico study, we have illustrated, with simple case studies, the meaning of the of ISF glucose with respect to BG. Understanding that ISF glucose is not just a shifted-in-time version but a distorted mirror of BG is important for a correct use of continuous glucose monitoring for diabetes management.
Introduction
U
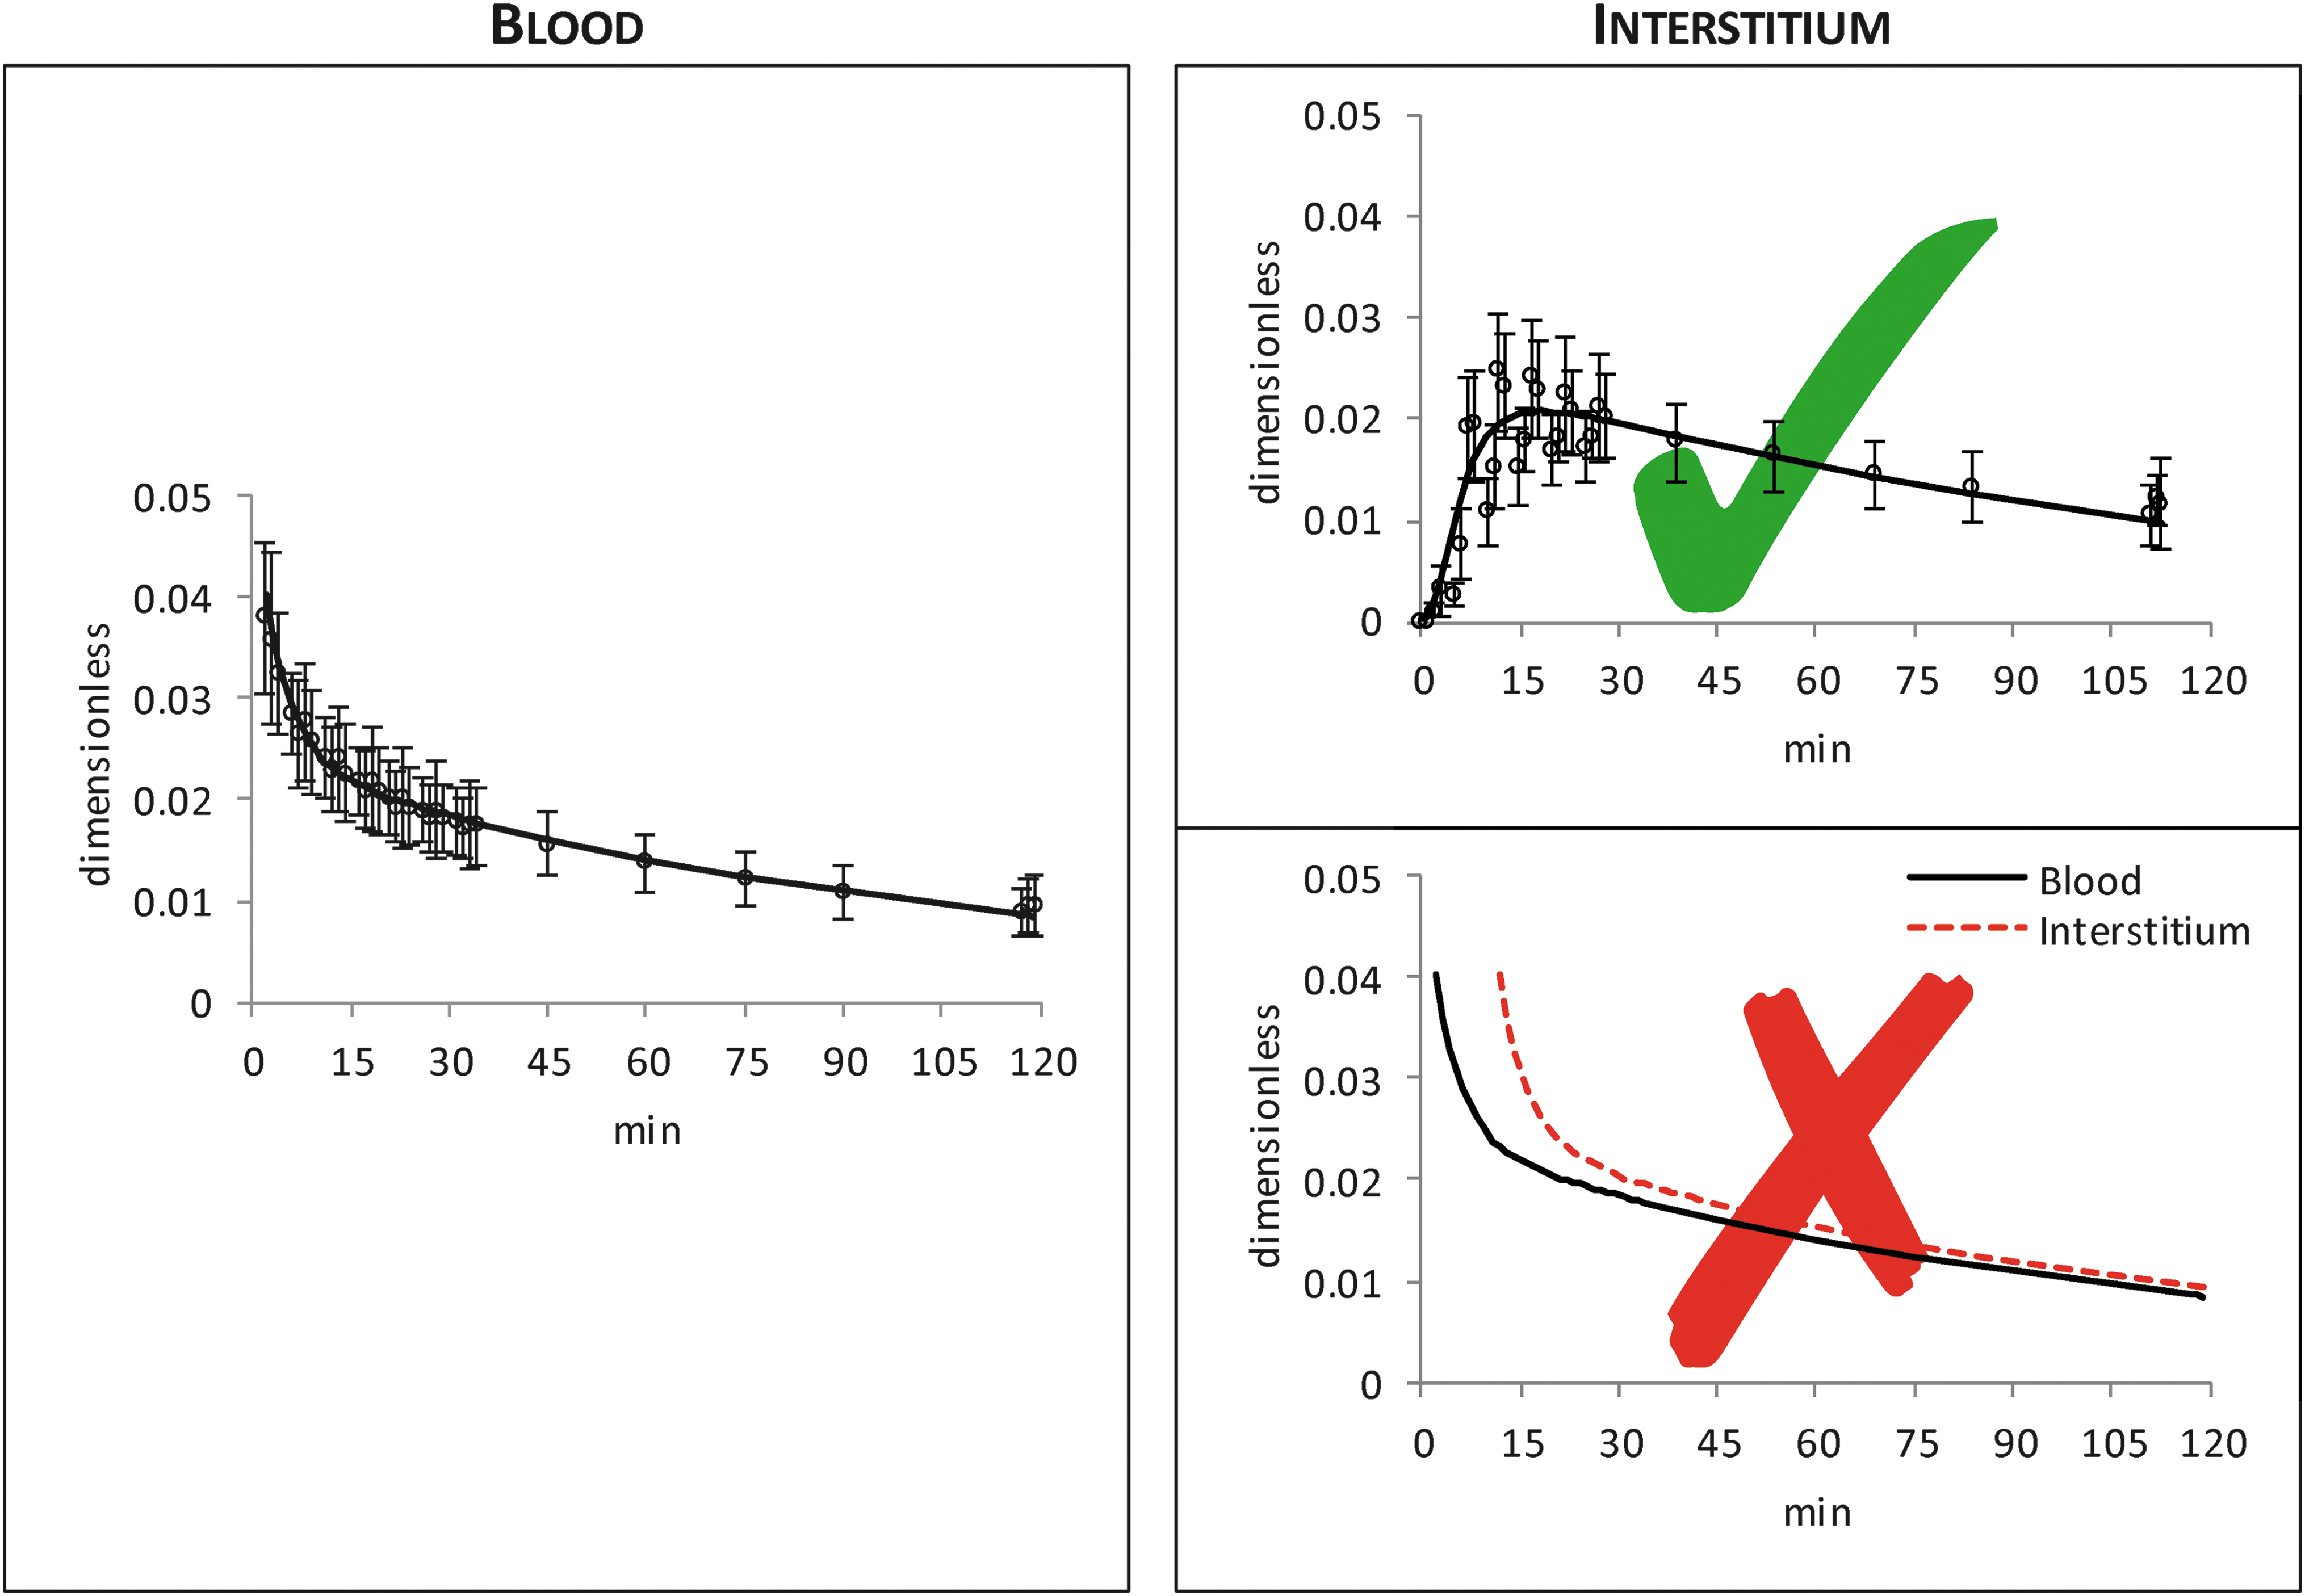
Average (±SD) BG (left) and interstitium (top right) glucose tracer-to-tracee ratio data (white dots) after an intravenous injection of a glucose tracer bolus (continuous black line is a smoothed version of data to facilitate reader's understanding). 1 In the bottom right panel, example of ISF glucose (red dashed line) obtained by shifting-in-time smoothed version of BG tracer-to-tracee ratio data (continuous black line). BG, blood glucose; ISF, interstitial fluid.
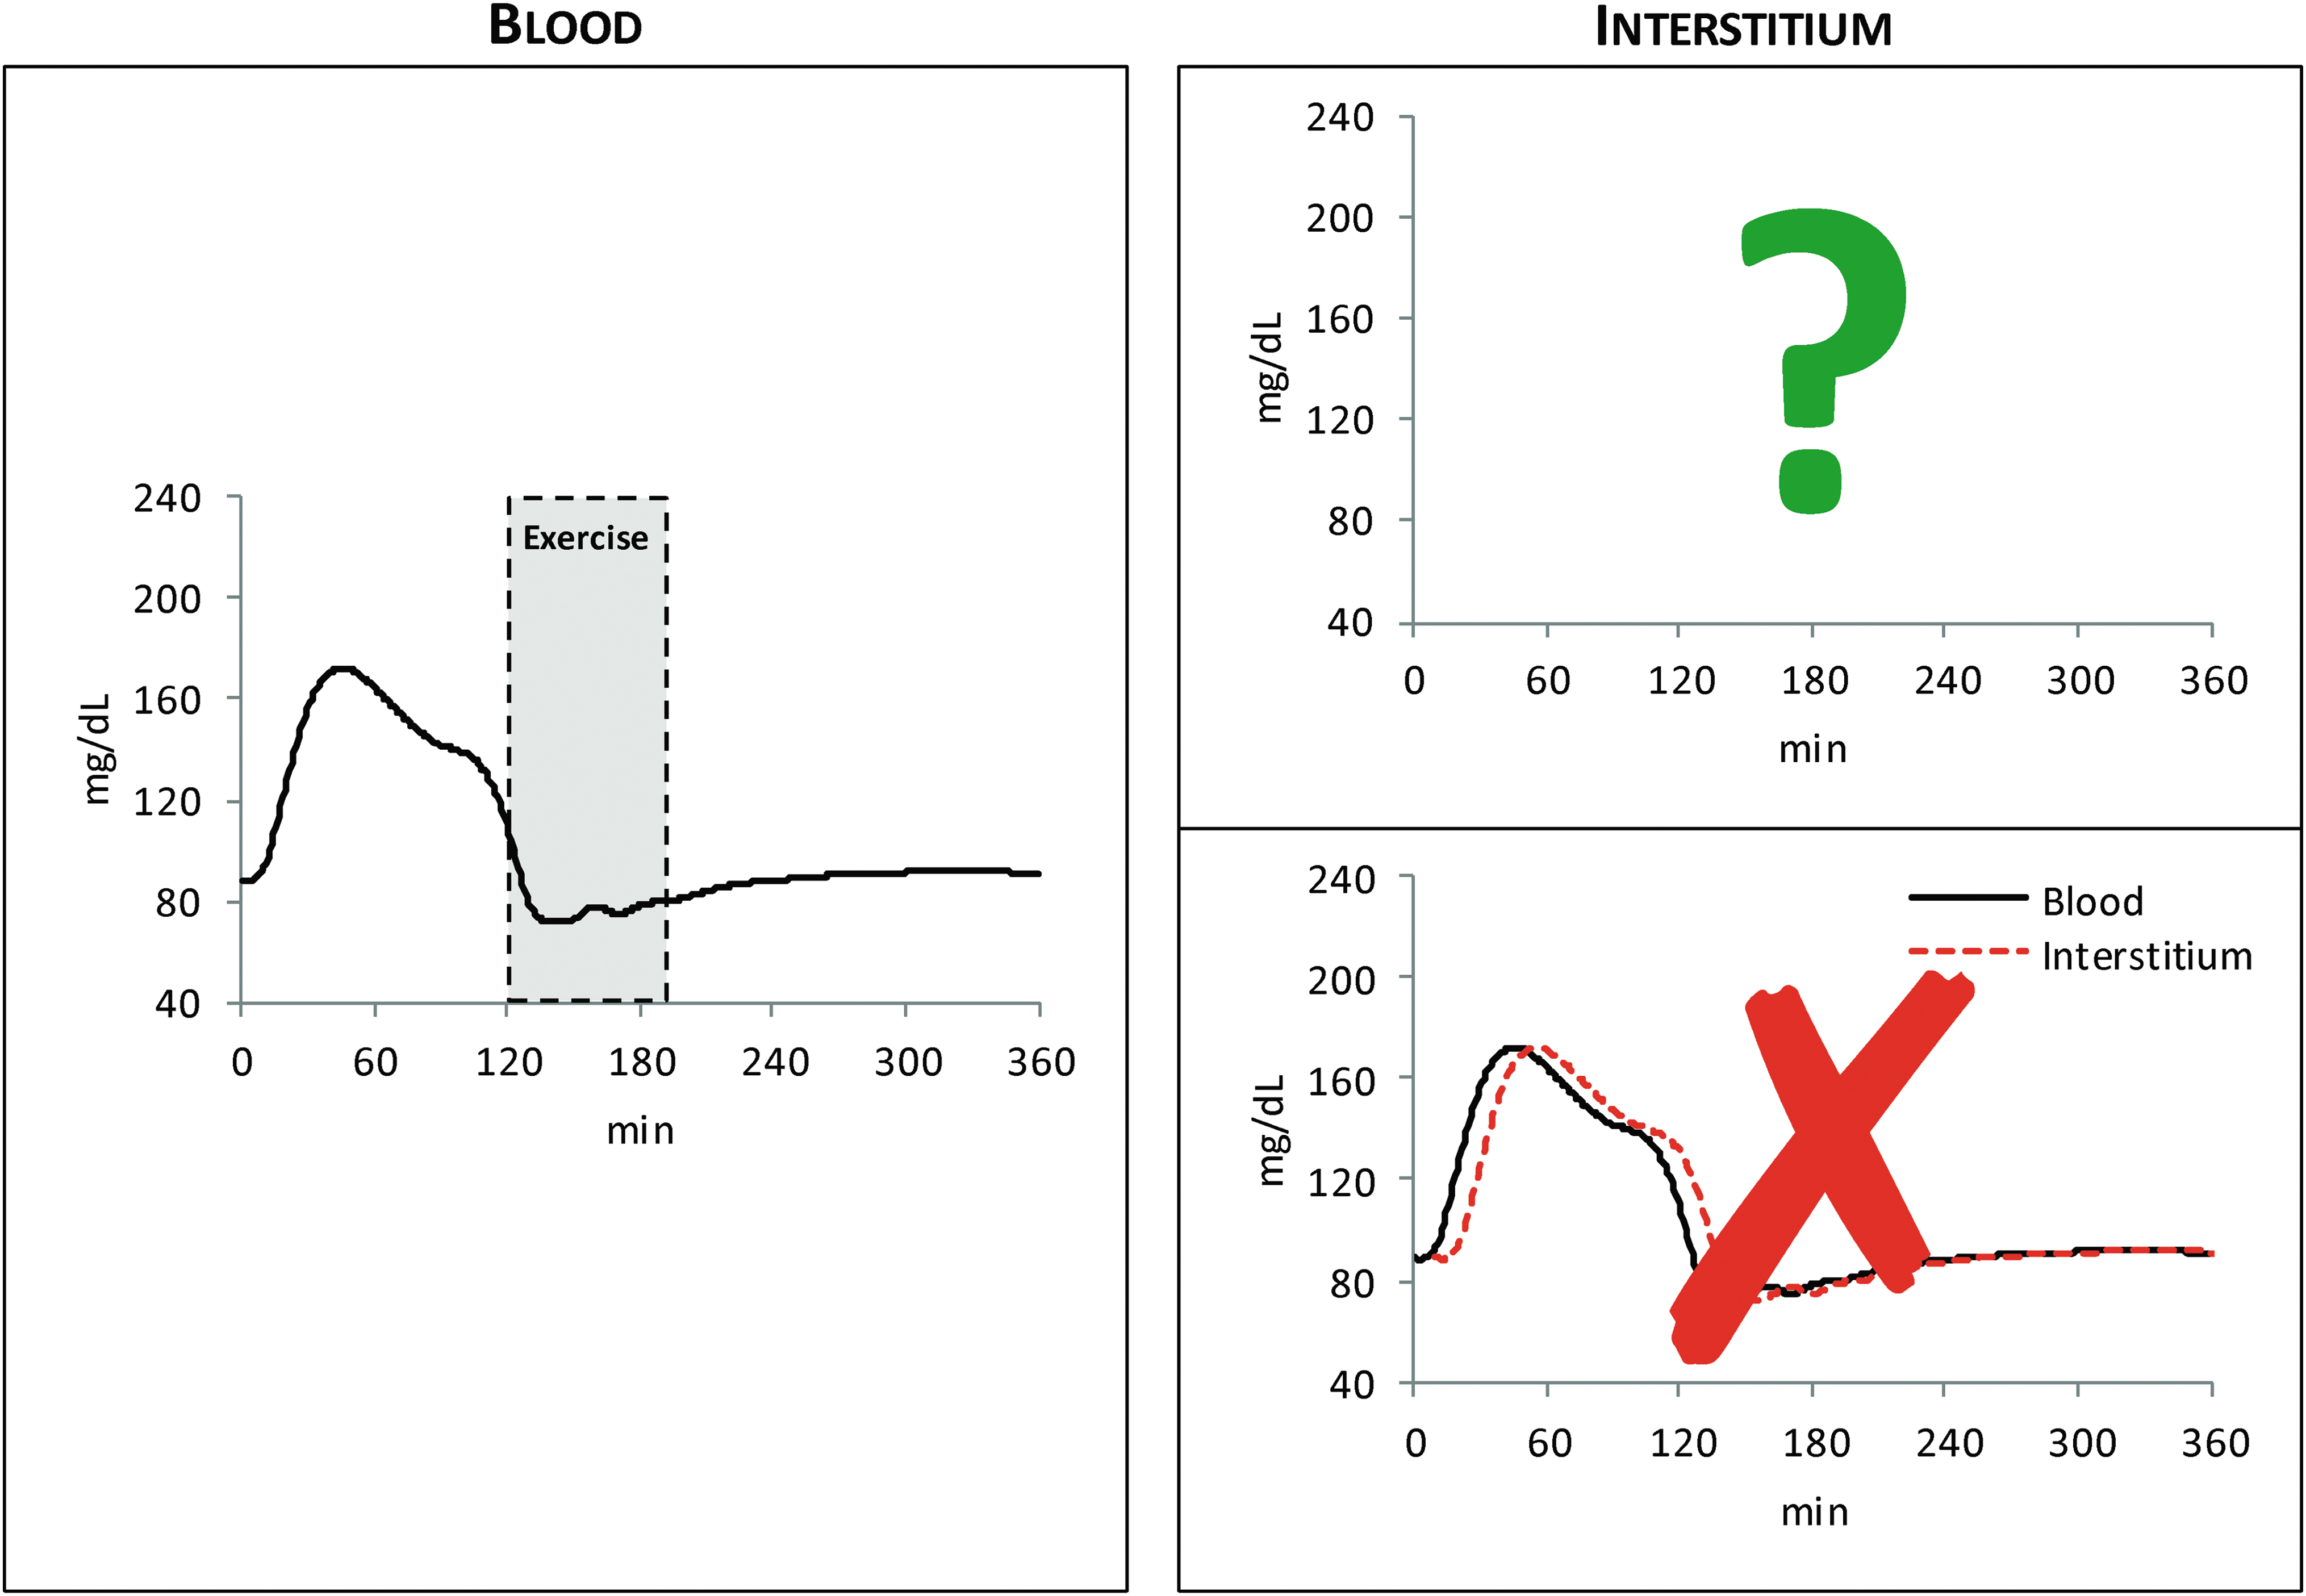
Average BG concentration data after a meal and exercise session (left) 4 versus unknown interstitium glucose concentration data (top right) or shifted-in-time version of BG concentration data (bottom right).
Assuming the linear model of BG-ISF glucose kinetics reported in Schiavon et al. 1 , the problem can be tackled by using linear systems theory: ISF glucose is the convolution between BG and the impulse response of the system, for example, described by a single exponential with time constant τ, thus immediately grasping that ISF glucose is not BG shifted ahead by τ. However, given the readership of the journal, we prefer to use a nontechnical language to convey, in a somewhat didactic way, the message also to clinical scientists and glucose sensing manufacturers.
Clearly, to answer the question of Figure 2 (right panel), one should measure, for example, by microdialysis, the ISF glucose time course. However, this is a very difficult task 5,6 and it is not surprising that no such data are available. A possible alternative is to resort to simulation to predict ISF profile. This is feasible, thanks to the recently developed BG–ISF glucose kinetics model 1 (Fig. 3).
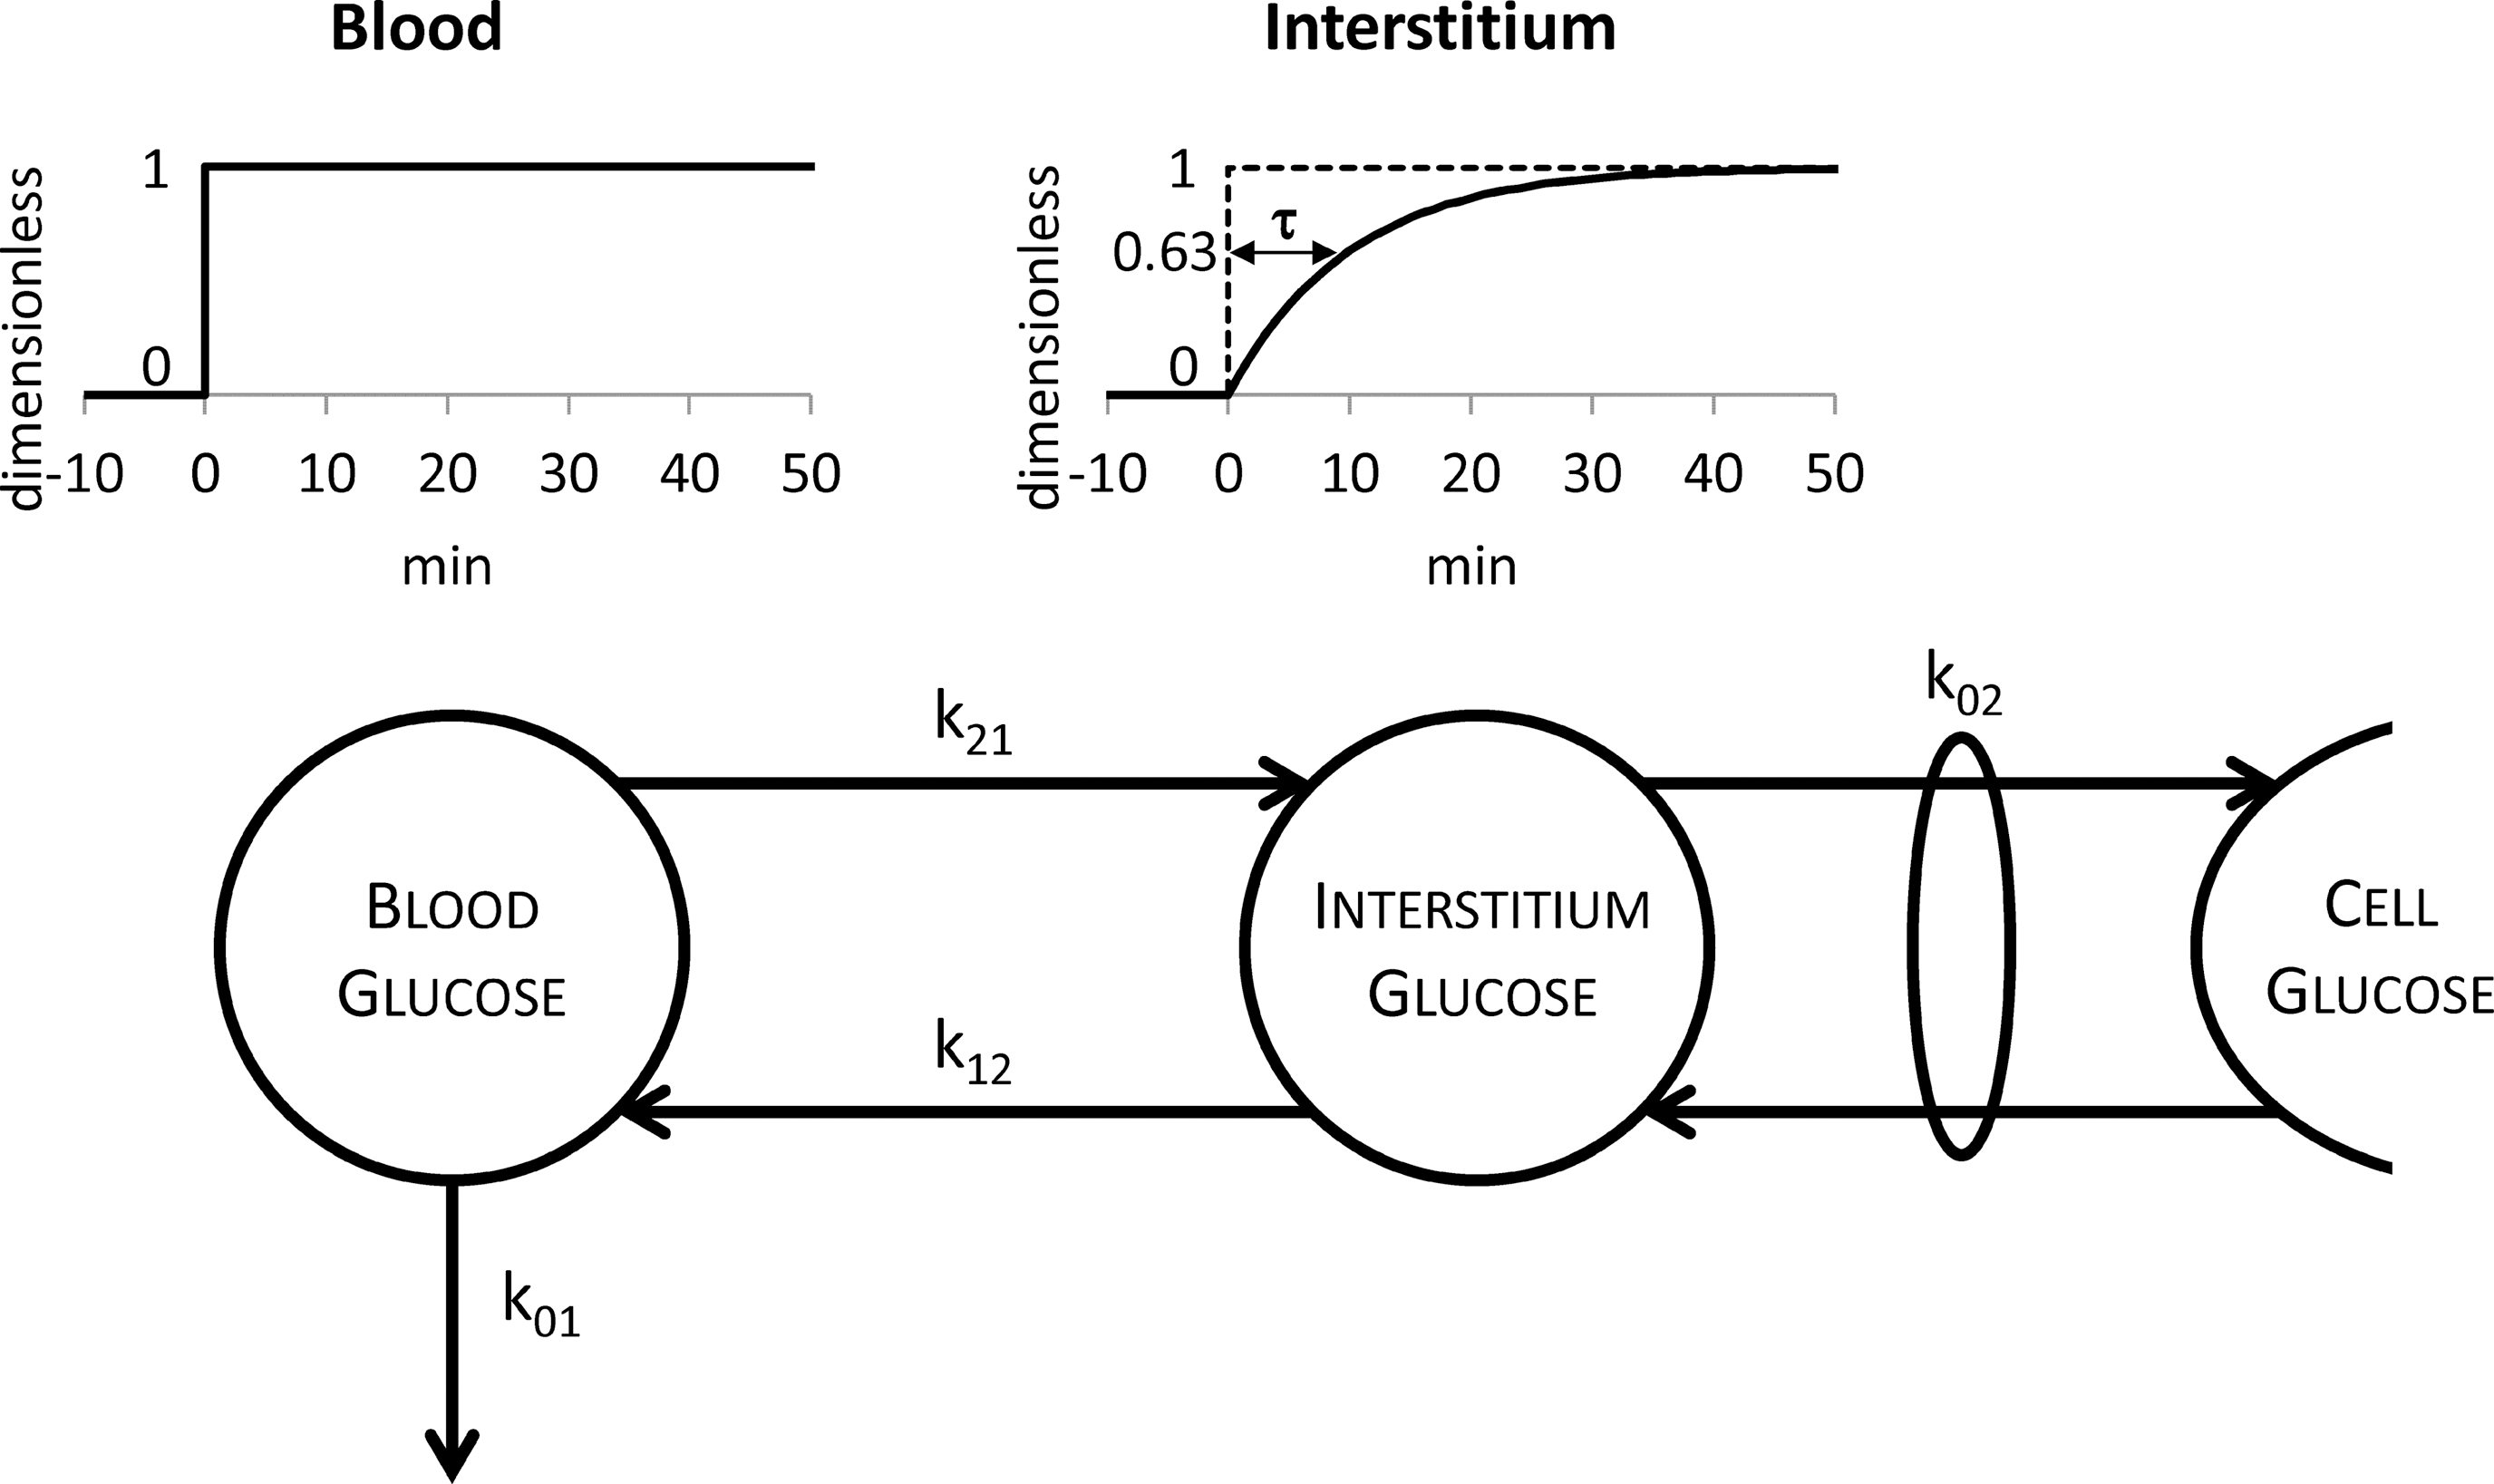
The two-compartment model describing the blood–interstitium glucose kinetics. The definition of the equilibration time τ is also reported above the model: τ is the time required by interstitium glucose to reach the value of 0.63 (top right) if a unit step glucose infusion is performed in blood at time 0 (top left).
The aim of this in silico contribution is to gain insight into the meaning of the physiological “delay” between ISF glucose and BG, by using a nontechnical language. To do this, we use two case studies and define new metrics describing the complexity of the relationship between BG and the distorted (with respect to BG) ISF glucose.
Research Design and Methods
BG–ISF glucose kinetics
Several studies have investigated the temporal relationship between BG and ISF glucose in subjects with and without type 1 diabetes by using different experimental techniques (see Schiavon et al.
1
for a brief review), the most recent being a multitracer and microdialysis experimental design.
2,3
There is consensus in the literature
1,7
–10
that a two-compartment linear model is adequate to describe glucose kinetics between blood and ISF. Once numerically identified, the model (Fig. 3) allows the calculation of a fundamental parameter describing the dynamics between BG and ISF glucose: the equilibration time τ, which represents, the time constant characterizing the response of the ISF compartment to a unit step glucose infusion in blood. The equilibration time is an intrinsic property of the system: it is protocol independent, at variance with other metrics like the time of appearance of glucose in the ISF, which is protocol dependent. The equilibration time or time constant of the system τ can be calculated from two of the model parameters:
Meal and exercise data
The data supporting our reasoning were derived from a study where 12 nondiabetic subjects (age: 18–60 years, body mass index: <40 kg/m2, HbA1c: ≤5.5%) received a standardized mixed meal containing 75 g of CHO at time 0 and 120 min after meal ingestion they performed four exercise sessions (15 min on and 5 min rest) of moderate intensity (50% VO2max). 4 One-minute interpolated BG concentrations are shown in Figure 4 (top panel).
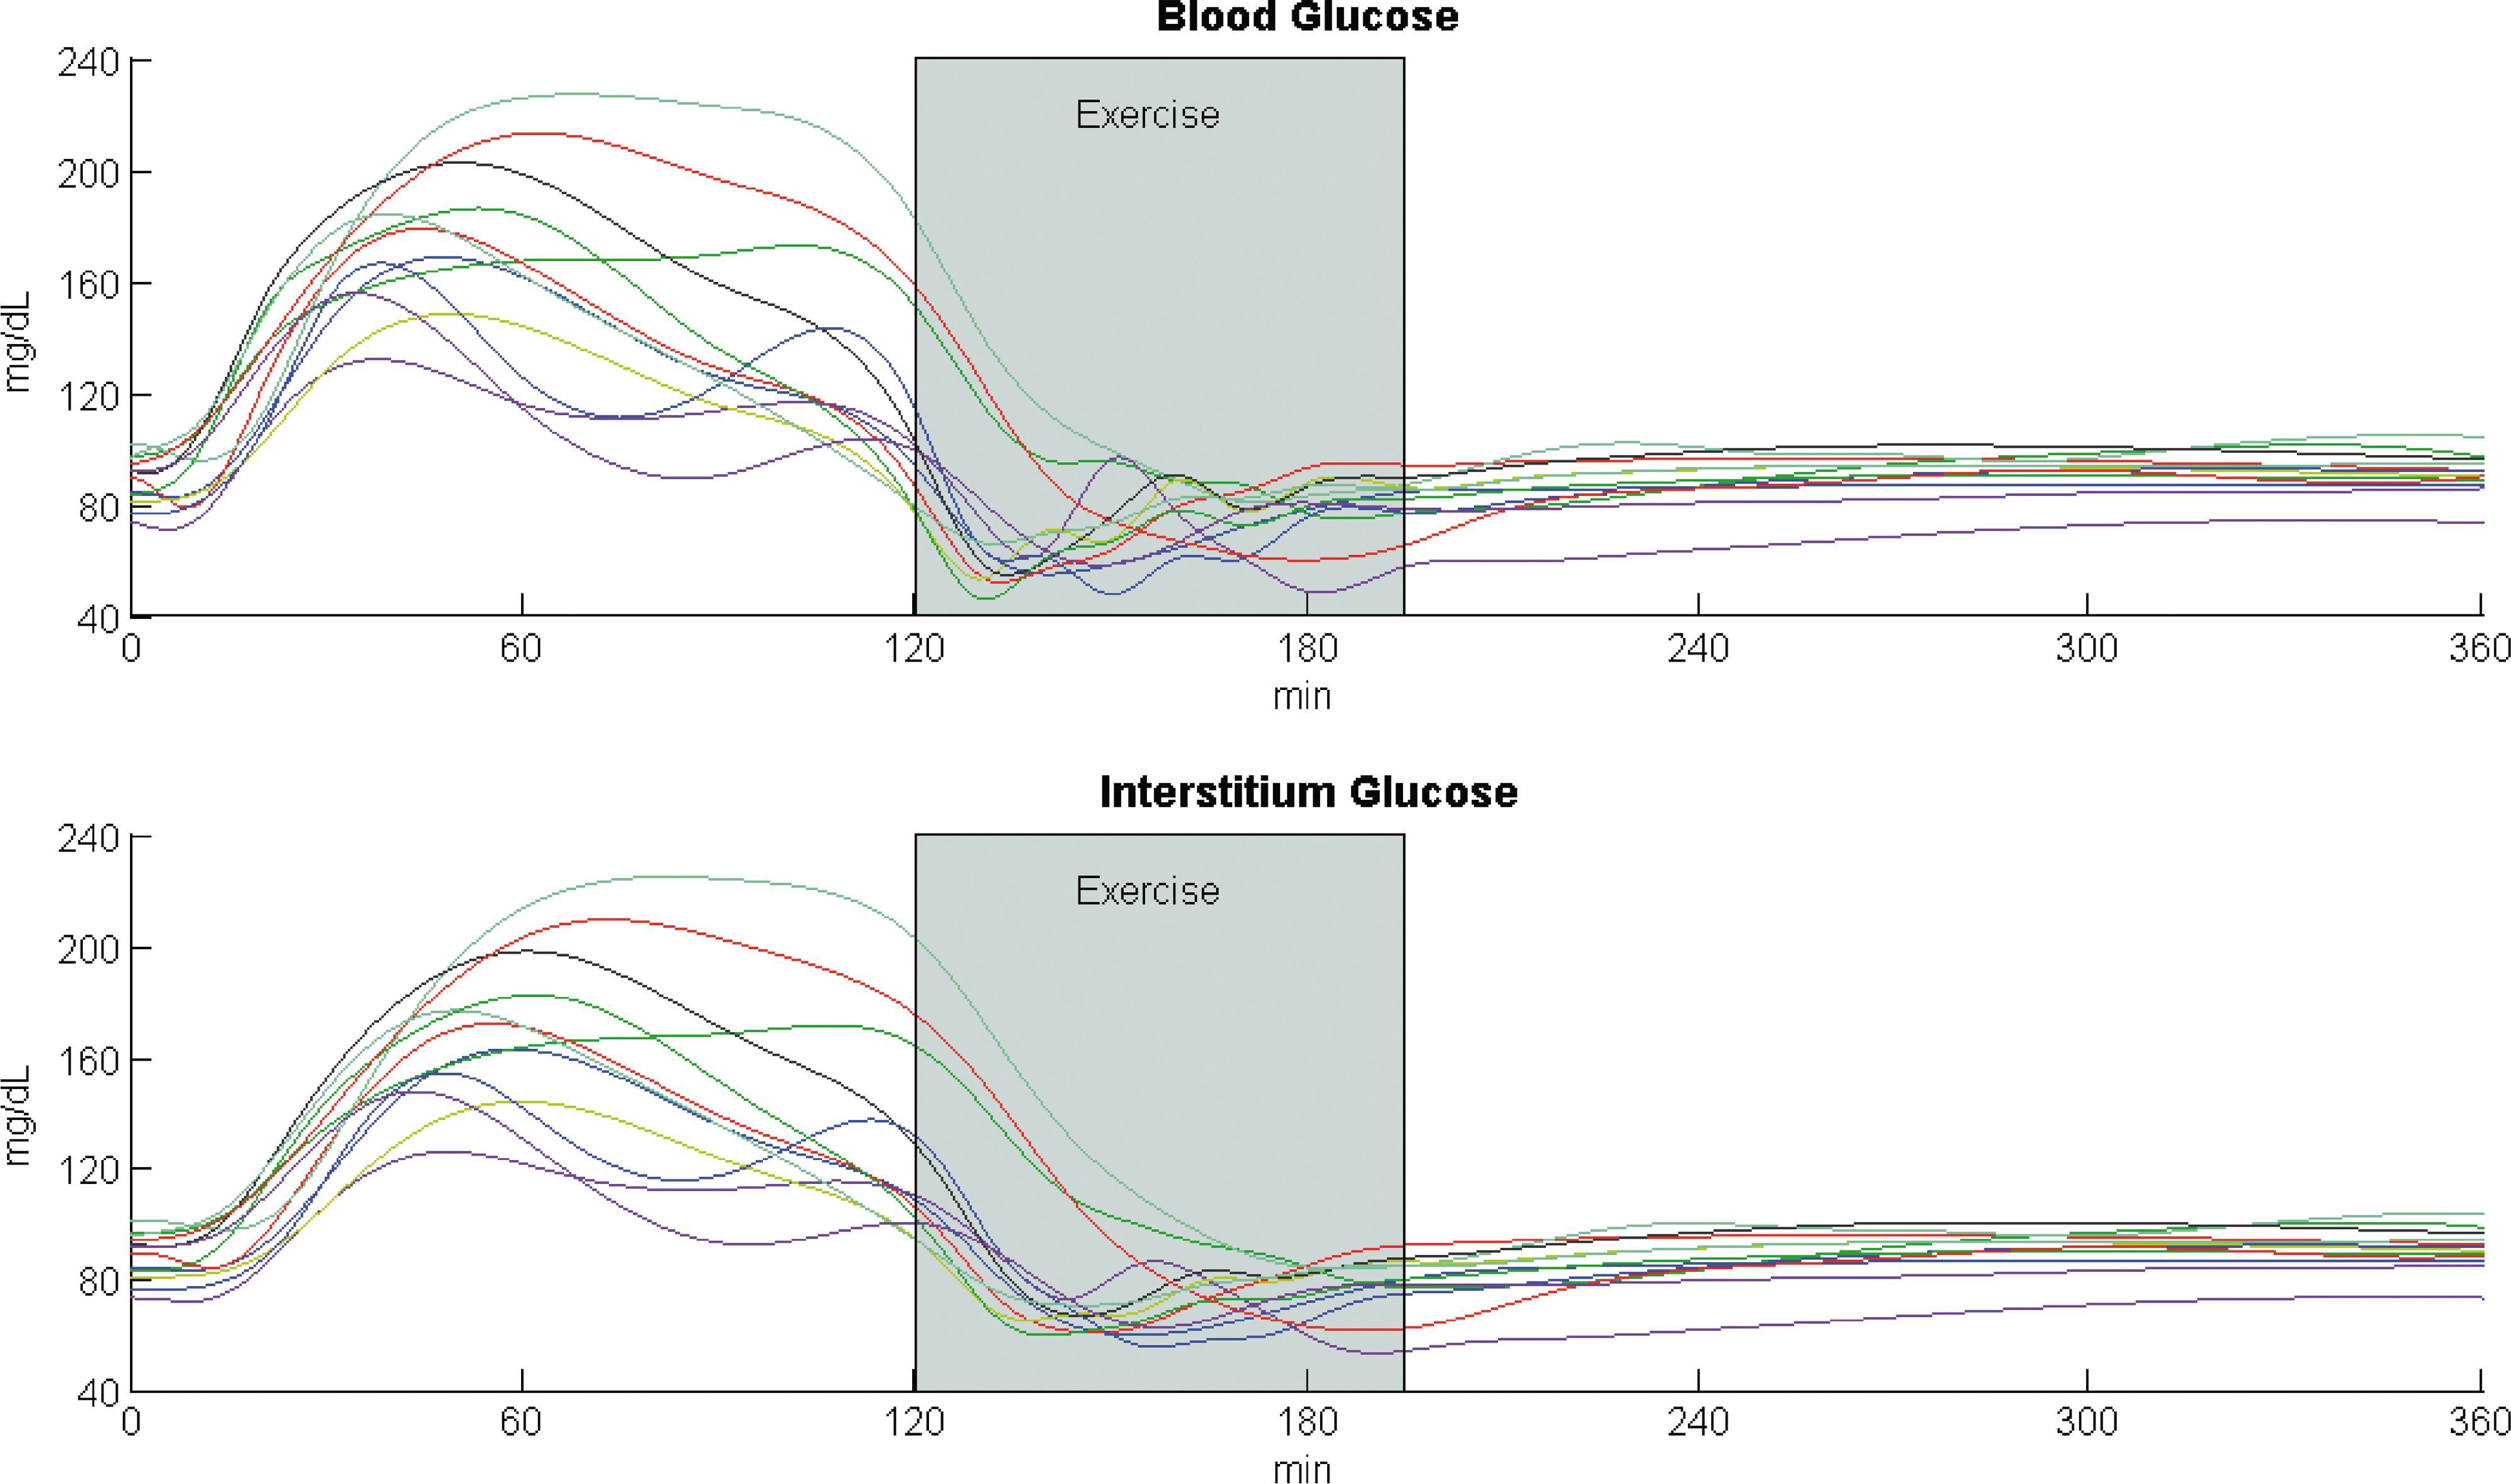
One-minute interpolated BG concentration (top panel) measured in nondiabetic subjects (n = 12) after meal and exercise session 4 and predicted ISF glucose time courses (bottom panel) with τ = 9.7 min, that is, the median equilibration time value between subjects with and without type 1 diabetes observed experimentally 1 . Shaded boxes between 120 and 195 min represent the exercise period at 50% VO2max. 4
Case studies
The measured BG profiles (Fig. 4, top panel) are used as a known input of the model in Figure 3 to predict the time course of glucose concentration in the ISF (all model parameters are assumed known).
Case study 1
This is performed in all available 12 subjects. The ISF glucose concentration time course was simulated (Fig. 4, bottom panel) using τ = 9.7 min, that is, the median equilibration time observed in subjects with and without type 1 diabetes in Ref. 1 . The aim is to show the variability of the ISF glucose profile in the population, even in the ideal case of identical equilibration time in all subjects.
Case study 2
This is performed in a representative subject (subject 10 of Ref. 4 ). In this case, ISF glucose is predicted for two extreme values of the equilibration time (τ = 7.1 min and τ = 20.5 min), corresponding to the minimum and the maximum observed experimentally 1 . The aim is to show the influence of the equilibration time value in determining the delay of ISF glucose with respect to BG.
BG–ISF glucose delay metrics
To describe quantitatively the time course of the ISF glucose versus BG delay, we use two intuitive metrics: the time course of glucose differences (GL, glucose lag) between BG and ISF glucose at each time point and the time course of time differences (TL, time lag) when ISF glucose is equal to BG:
where tk (with k ≤ i) is the time where BG assumes the same value of ISF(ti ) glucose.
Results
Case study 1
The time courses of GL and TL are shown for each subject in Figure 5 in the top and bottom panel, respectively, whereas the gray shaded profiles represent in both panels the interquartile ranges. GL time course takes on both positive and negative values, that is, when glucose rises, ISF glucose lags behind BG, whereas when glucose decreases, the opposite occurs. Despite the large inter-subject variability of glucose profiles, the maximum glucose difference between blood and ISF is on median 28 mg/dL during the rising phase after the meal, whereas the minimum is −26 mg/dL during the descending phase of BG, that is, after the BG peak and the start of the exercise session.
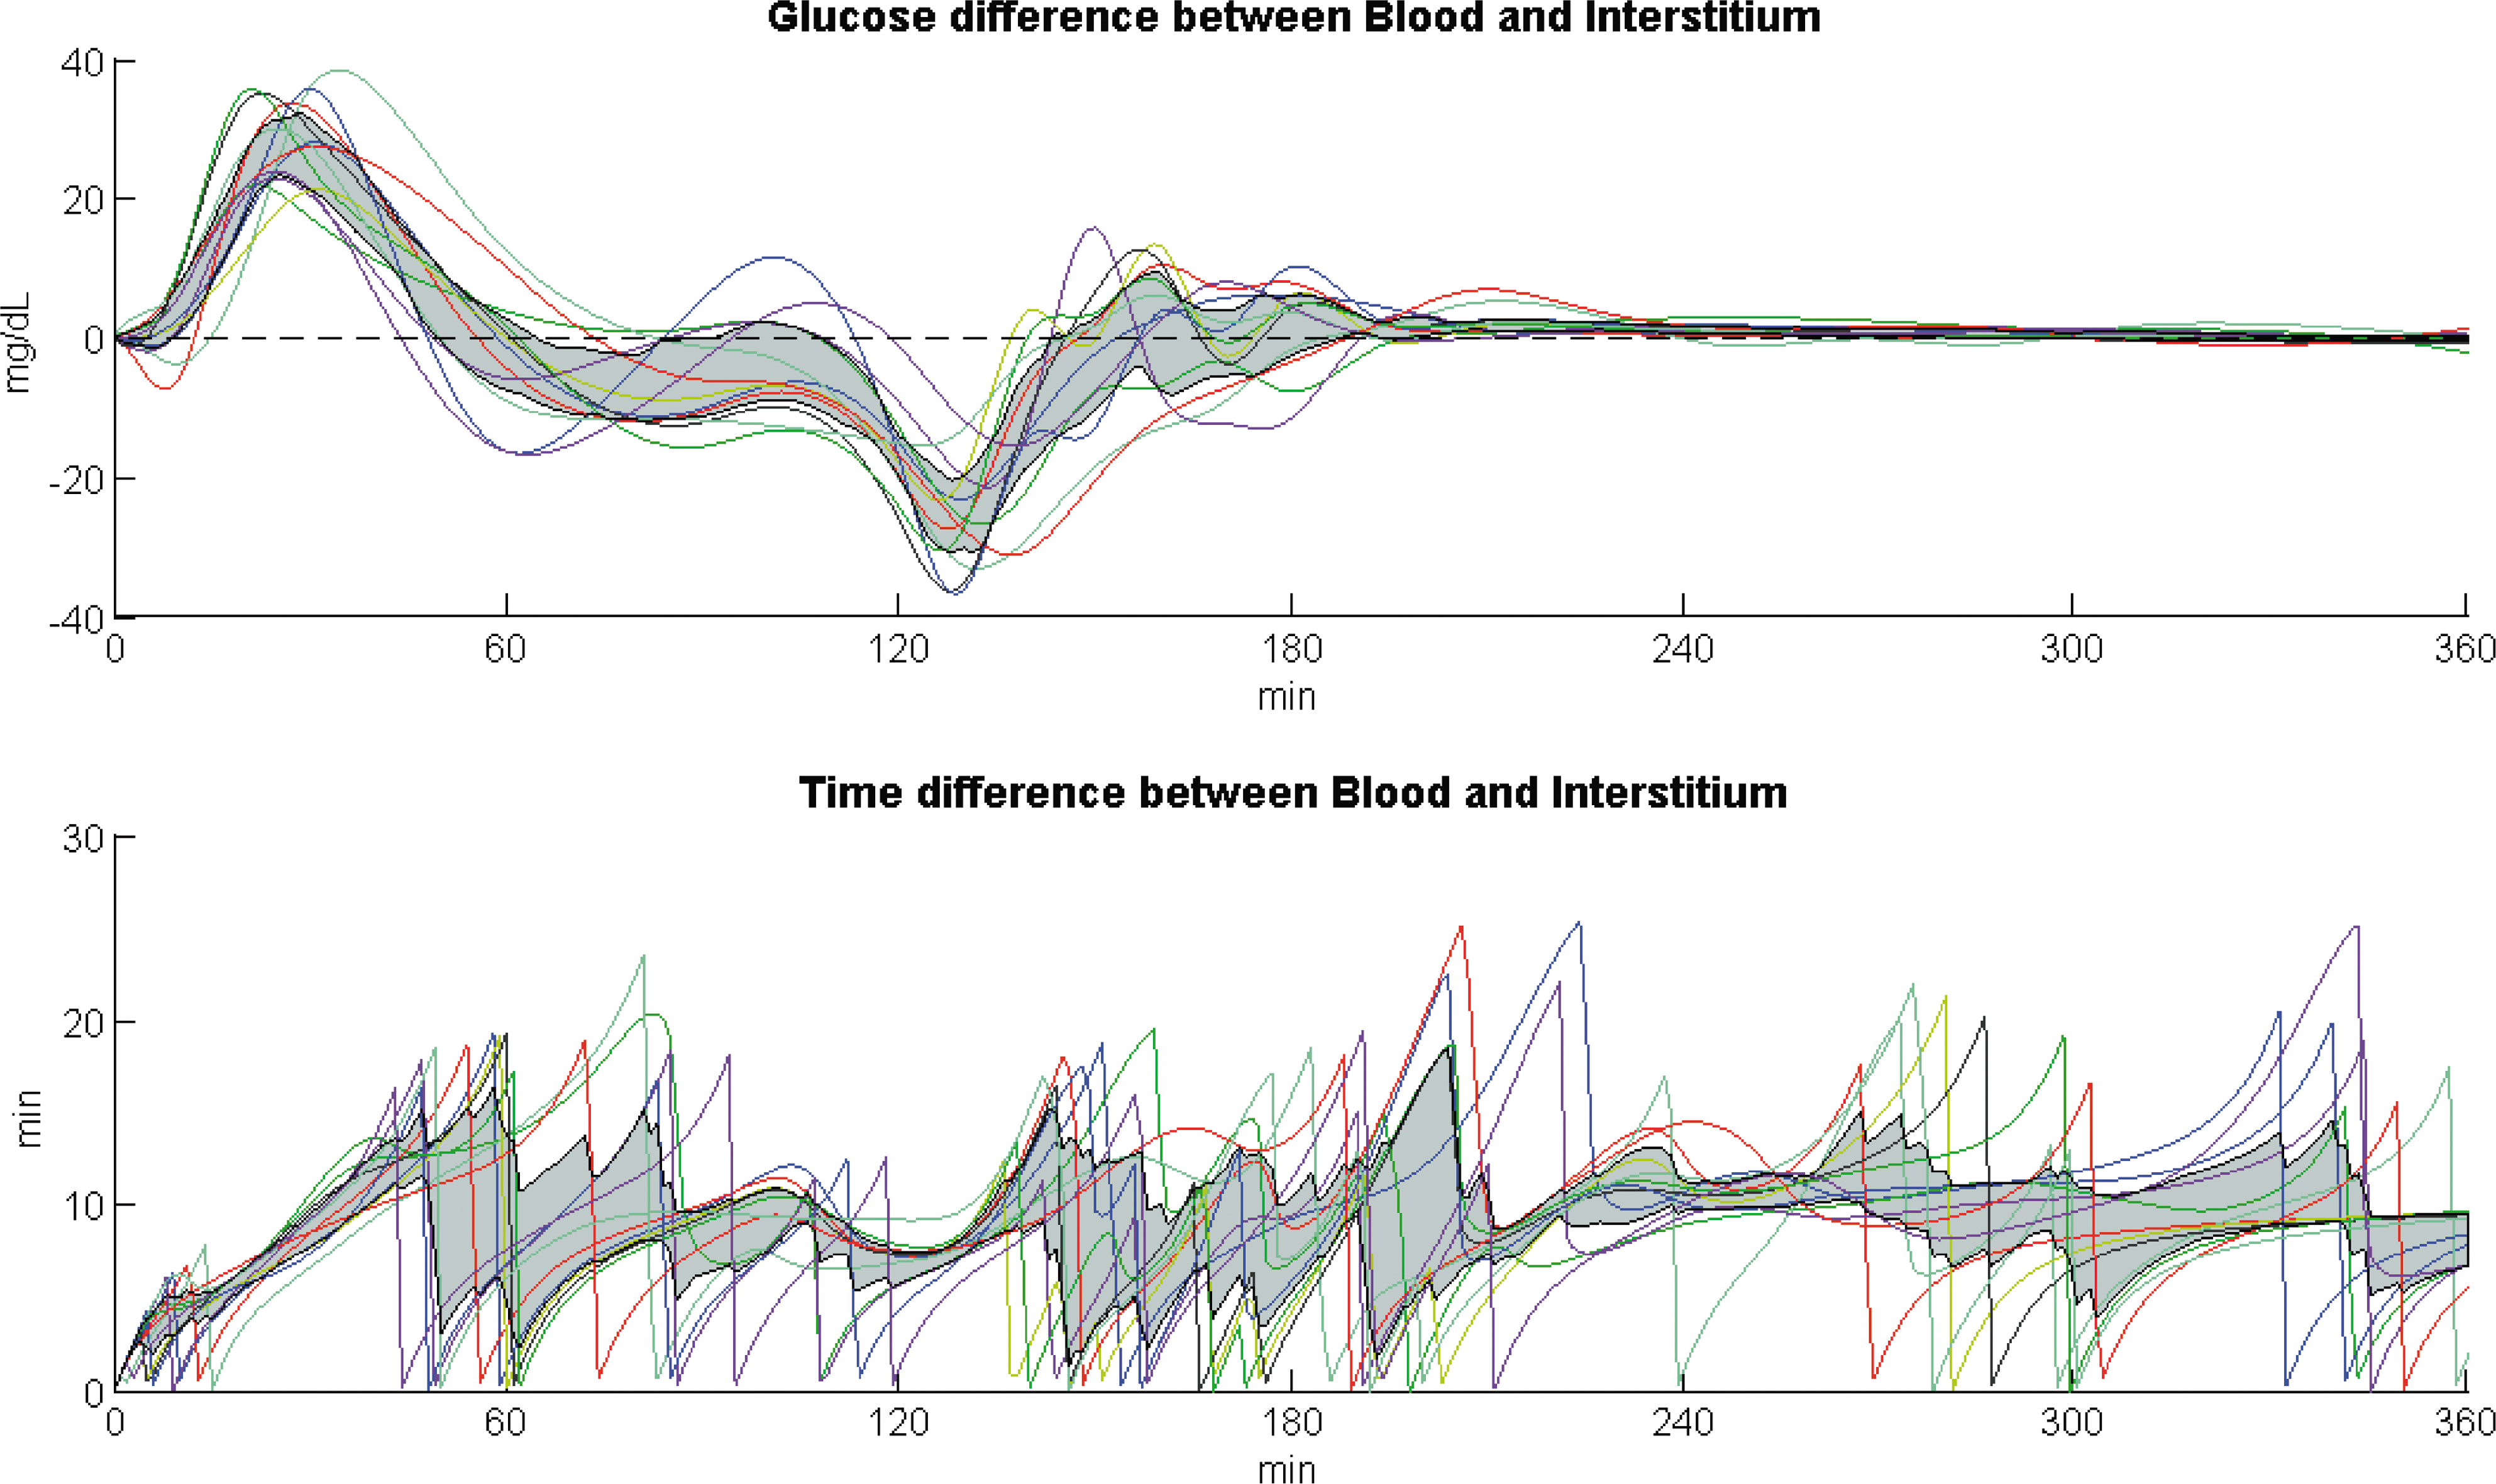
Time course of glucose differences (GL) between BG and ISF glucose (top panel) and time course of time differences (TL) for ISF glucose to equilibrate with BG (bottom panel), for each subject, at each time point for the median equilibration time value τ = 9.7 min. 1 The gray shaded profiles are the interquartile ranges for GL (top panel) and TL (bottom panel). GL, glucose lag; TL, time lag.
On the contrary, TL time course is always positive and becomes zero at the time ISF glucose equals BG. A large inter-subject variability could be observed in TL time courses ranging on median between 0 and 13 min. The time variant TL between BG and ISF glucose can exceed the equilibration time value because (Fig. 3) ISF glucose reaches only asymptotically the steady-state BG value.
Case study 2
Figure 6 (top panel) shows the time course of BG (black) and ISF glucose obtained in the representative subject with two extreme values of τ (τ = 7.1 min in red, τ = 20.5 min in blue), whereas the middle and bottom panels show GL and TL time courses. GL time courses show that the greater the τ, the larger the positive and negative excursions between ISF glucose and BG; similarly, TL profiles show that the larger the τ, the larger the TL between ISF glucose and BG.

Top panel: BG concentration data measured in a healthy subject (subject 10) after a meal and exercise session in Ref. 4 (black line) and predicted ISF glucose time course (red and blue line for τ = 7.1 min and τ = 20.5 min, respectively, that is, the minimum and maximum values observed experimentally 1 ). Middle panel: Time course of glucose differences (GL) between BG and ISF glucose at each time point for two equilibration times (red and blue line for τ = 7.1 min and τ = 20.5 min, respectively). Bottom panel: Time course of time differences (TL) for ISF glucose to equilibrate with BG for two equilibration times (red and blue line for τ = 7.1 min and τ = 20.5 min, respectively).
Summarizing, the ISF glucose profiles are not just a shifted-in-time mirror of BG during meal and exercise but exhibit a complex pattern that depends not only on the equilibration time τ but also on the time course of BG profile.
Conclusions
CGM is based on glucose concentration measured in the ISF, a compartment remote from blood. Since glucose needs to be transported from blood to interstitium, there is a physiological “delay” between the two compartments, and glucose sensors try to minimize the additional unavoidable technological delay. It is an accepted notion that ISF glucose is “delayed” with respect to BG, but this does not mean that ISF glucose is simply a shifted-in-time version of BG. Although this is a rather straightforward notion for technically inclined readers, there is often some confusion among nontechnically inclined readers on the meaning of this delay. With this contribution, we hope to have shown in a didactic way and using a nontechnical language that ISF glucose exhibits a complex pattern that depends not only on the equilibration time (a parameter characterizing the BG–ISF glucose system) but also on the dynamic profile of BG excursion. Two metrics have been introduced to characterize the delay, GL and TL, which clearly show that the relationship between BG–ISF glucose profiles is inherently time variant with a complex pattern heavily reflecting the dynamic profile of BG concentration.
This opens the door to incorporate predictive models or priors into contemporary subcutaneous glucose sensors to mitigate the delay for taking actions, for example, to predict ahead of time a hypoglycemic event and take a rescue carbohydrate intake in advance. In a scenario of insulin dosing, for example, in an artificial pancreas system, this delay calls again for the incorporation of this knowledge in the control algorithm to also compensate the additional, and relatively more important, delay of subcutaneous insulin absorption.
To elaborate our hypothesis a model of BG–ISF glucose kinetics was needed. The only tracer-based numerical quantification of the model kinetics is available in steady state, 1 so we had to assume the validity of the model also in the nonsteady state conditions of meal and exercise. Studies are currently being done in these circumstances, but even if the model parameter k02 will likely become time varying, for example, because of insulin action, the argument put forward in this contribution will stay. Similarly, putting into the problem additional ingredients related to technological delays will simply make the picture more articulated but not change the conclusion.
Footnotes
Acknowledgments
This work was supported, in part, by The Helmsley Charitable Trust (2012PG-T1D005) to R.B., National Institutes of Health (R01 DK 090541) to R.B., National Institutes of Health (DK 085516) to A.B., Italian MIUR (ex 60%) to C.C., University of Padova (Progetto di Ateneo 2014) to C.D.M., and University of Padova (Assegno Junior 2013) to M.S.
Authorship Contribution
C.C., M.S., and C.D.M. equally contributed to the article, analyzed the results, and drafted the article. A.B. and R.B. contributed to the discussion of the results, commented, and edited the article.
Author Disclosure Statement
C.C. reports research material support from Roche and Dexcom, Inc. and research grant to Department of Information Engineering, University of Padova from Dexcom, Inc. R.B. reports foundation gift to Mayo Clinic from Dexcom, Inc. M.S., A.B., and C.D.M. declare no conflicts of interest.