
Abstract
Background:
Devices employing electrochemistry-based correction algorithms (EBCAs) are optimized for patient use and require special handling procedures when tested in the laboratory. This study investigated the impact of sample handling on the results of an accuracy and hematocrit interference test performed with BG*Star, iBG*Star; OneTouch Verio Pro and Accu-Chek Aviva versus YSI Stat 2300.
Methods:
Venous heparinized whole blood was manipulated to contain three different blood glucose concentrations (64–74, 147–163, and 313–335 mg/dL) and three different hematocrit levels (30%, 45%, and 60%). Sample preparation was done by either a very EBCA-experienced laboratory testing team (A), a group experienced with other meters but not EBCAs (B), or a team inexperienced with meter testing (C). Team A ensured physiological pO2 and specific sample handling requirements, whereas teams B and C did not consider pO2. Each sample was tested four times with each device. In a separate experiment, a different group similar to group B performed the experiment before (D1) and after (D2) appropriate sample handling training.
Results:
Mean absolute deviation from YSI was calculated as a metrix for all groups and devices. Mean absolute relative difference was 4.3% with team A (B: 9.2%, C: 5.2%). Team B had much higher readings and team C produced 100% of “sample composition” errors with high hematocrit levels. In a separate experiment, group D showed a result similar to group B before the training and improved significantly when considering the sample handling requirements (D1: 9.4%, D2: 4.5%, P < 0.05).
Conclusions:
Laboratory performance testing of EBCA devices should only be performed by trained staff considering specific sample handling requirements. The results suggest that healthcare centers should evaluate EBCA-based devices with capillary blood from patients in accordance with the instructions for use to achieve reliable results.
Introduction
B
Frequently, these protocols include (or are even solely based on) a laboratory accuracy test performed by an individual responsible for quality management using venous whole blood, which is manipulated to contain different blood glucose ranges by spiking with a glucose solution for high glucose concentrations. Low glucose concentrations are obtained by letting the whole blood sample sit on the bench for a while, allowing for cellular glucose consumption by erythrocytes. Use of shakers or spinning devices is sometimes intentionally omitted during the preparation of the final test sample. After sample preparation, direct comparison of SMBG results is performed with a comparator reference method that is available through the regular facility infrastructure (e.g., routine laboratory automats). These protocols are frequently used to test new highly sensitive blood glucose meters and the performance test results define the acceptance of the tested meter within the medical facility.
Unfortunately, the described methodology has multiple limitations and the results are dependent on a variety of external factors, which include but are not limited to the underlying glucose measurement technology of a given blood glucose meter—which determines the sensitivity of this technology to outside factors and sample matrix changes, the degree of training and experience of the individual performing the test, and finally the choice of the comparator method. The test procedure may, therefore, bias the results in favor of certain technologies and may lead to disqualification of other meters—although they in fact might be more accurate and reliable—simply because of technicalities induced by the way the experiment is performed. In our experience, currently available branded blood glucose meters usually meet their specifications when tested in a specialized laboratory setting and in accordance with their instructions for use, 4 but may show a weaker performance when tested under nonoptimized testing conditions, leading to disputable test results. As an example, blood glucose meters employing mathematical correction algorithms based on dynamic electrochemistry, such as OneTouch® Verio Pro® (LifeScan) or BG*Star® (Sanofi), were reported with unfavorable accuracy results by one group with a testing protocol developed in-house, 5,6 but with excellent results by our and other groups using the ISO protocol. 4,7 To understand the credibility of SMBG performance testing results, it is important to elucidate the impact of sample handling and investigator experience on laboratory accuracy test results.
We, therefore, performed a series of experiments with standardized protocols to investigate the impact of sample handling as well as investigator training and experience on the outcome of laboratory performance tests with currently available branded blood glucose meters from different manufacturers.
Patients and Methods
The experiments were performed in Germany and in the United States, in accordance with the respective local ethical and regulatory requirements. All blood donors gave written informed consent before any blood draw. A standardized experimental protocol for assessment of accuracy and hematocrit interference was used to investigate the impact of investigator experience and sample handling on the performance of the study devices.
Devices and strips
The reference devices were ABL80 Flex CO-OX (Sendx Medical/Radiometer, Carlsbad, CA, for hematocrit and blood gas analysis), StatStrip Connectivity (Nova Biomedical, Waltham, MA) as whole blood glucose reference method, performed before and after blood glucose meter (BGM) testing, and the laboratory automat YSI 2300 Stat (Yellow Springs Instruments, Inc., Yellow Springs, OH) as plasma glucose reference method, performed before and after use of each sample. Devices to be tested (four meters/device type, one strip lot) were obtained through regular distribution channels: BG*Star (Sanofi), iBG*Star® (Sanofi), OneTouch Verio Pro (LifeScan), Accu-Chek® Aviva® (Roche Diagnostics).
Investigator teams
The experiments were performed by four different groups of investigators:
Team A (“experts”) was a blood glucose meter assessment team of IKFE Laboratory (Mainz, Germany), an experienced group that had been involved in laboratory testing of many meters including BG*Star and OneTouch Verio already in the preapproval development period. 4,8 –11
Team B (“routine EU”) was a hospital laboratory group, based in Mainz, Germany, used to perform blood glucose meter testing with an in-house testing protocol.
Team C (“lay testers”) was composed of staff members of the molecular biology laboratory team of IKFE, who are PCR (polymerase chain reaction) specialists used to pipette small sample volumes, but had never before participated in a blood glucose meter assessment.
Team D (“routine US”) was the team of the Institute for Clinical Research and Development (ICRD, San Jose, CA), who were experienced in routine blood glucose meter testing following a standard protocol. This team performed the experiments before (D1) and after (D2) an intense training on proper specific sample handling for testing blood glucose meters employing electrochemistry-based correction algorithms (EBCAs).
Standard experiment
Venous heparinized whole blood was immediately aliquoted after draw and manipulated to contain three different blood glucose concentrations (64–74, 147–163, and 313–335 mg/dL) and three different hematocrit levels (30%, 45%, and 60%) by different protocols, as defined hereunder. For each device type (n = 4), 4 meters were tested in parallel (n = 4) with 4-fold measurements (n = 4) with 1 strip lot (n = 1), 3 hematocrit levels (n = 3) and 3 glucose concentrations (n = 3), resulting in 144 measurements per device type and study group. Immediately before and after sample measurements, quality control measurements using the respective BGM control solutions and the reference measurements were performed. Mean absolute relative difference (MARD), precision, and the hematocrit interference factor (HIF 5 ) were calculated for all samples.
Sample preparation was done independently by the different teams A to D. Team A ensured physiological pO2 and very gently prepared the samples, whereas team B did not consider pO2 and used laboratory equipment for effective mixing. Team C and team D1 did everything manually, but also ignored pO2. In a consecutive second experiment, team D1 was well trained with special focus on potential laboratory handling errors (D2).
Standard sample handling protocol (teams B, C, and D1)
After blood draw, the heparinized blood sample was cooled until use and glucose was determined by use of the StatStrip device. A high blood glucose concentration was prepared by adding 10 μL of a 40% glucose solution to 3 mL blood and by mixing thoroughly. This step increased glucose levels by approximately 60–70 mg/dL. The new glucose concentration was determined by using StatStrip. To decrease glucose concentration, erythrocyte glucose consumption at room temperature was allowed for 1 h. Thereafter, the samples were stored on ice at 4°C–8°C until use.
Expert sample handling protocol (teams A and D2)
This second protocol (expert protocol) describes how to manipulate blood in vitro correctly to achieve different glucose concentrations and hematocrit values while keeping oxygen values constant. The samples (venous whole blood) were cooled directly after blood draw for at least 15 min at 4°C–8°C. Initial hematocrit and oxygen saturation were determined by means of the ABL80 Flex CO-OX device and glucose was measured with the StatStrip device. To increase glucose concentrations by 60–70 mg/dL, 10 μL of a 40% glucose solution was added to a 3 mL blood sample and the tube was manually rolled for gently mixing. Physiological whole blood glucose concentrations were decreased by allowing the erythrocytes to consume the glucose at room temperature. Final glucose concentrations were determined with the StatStrip device. Samples were approved for use in the experiment, as soon as three measurements of the sample did not deviate more than 5–15 mg/dL from each other in three successive, artificially created blood drops (equilibrated briefly until reaching room temperature). By means of a pipette, blood drops were placed on a Parafilm® surface, resulting in nicely rounded drops (not pools) and thereby mimicking the blood drops created by usual finger pricking. The sample was then stored at 4°C–8°C on ice until use.
A cell-free plasma aliquot of each sample was prepared by centrifugation in a 15 mL centrifugation tube at 2860 × g for 4 min. The plasma was transferred into a clean 15 mL tube without disturbing the red cell layer and stored at 4°C–8°C (on ice).
Each hematocrit level was freshly prepared and assessed using the ABL80 Flex CO-OX device. A low hematocrit value was prepared by diluting a sample with the plasma prepared from the same blood and gentle mixing. For a high hematocrit, the sample was carefully spun down for 3–5 min at 300 × g, avoiding hemolysis. Thereafter, a defined amount of plasma was removed out of the tube and the red blood cell layer was carefully resuspended in the remaining whole blood. The hematocrit of the sample was controlled by using the ABL80 Flex CO-OX device.
Statistical analysis
The data were collected and tabulated for each meter. Statistical analyses included calculation of the mean values and standard deviations for each meter type–sample combination. The mean of the differences from the comparison method was used for calculating the MARD for each meter at the three glucose concentrations. This accuracy analysis as well as the determination of the coefficient of variation (precision) was only performed with the samples that showed a hematocrit value of 45% (which is considered a “normal hematocrit”). The mean glucose value determined at a hematocrit of 45% was normalized to be 100% to determine the potential bias (% deviation) occurring at the other hematocrit levels. The means of the deviations between the different hematocrit samples were used for calculating a HIF (HIF = largest observed bias more than 100% + largest observed bias less than 100%) for each meter with the mean relative results obtained from the three glucose concentrations. A HIF <15% for the individual glucose concentration and a mean HIF over the entire glucose ranges <10% were predefined as indicative for no clinically relevant influence of hematocrit on the blood glucose readings, as defined previously. 7,8 Comparisons between mean values were calculated by means of the two-sided student's t-test. A P value <0.05 was considered statistically significant.
Results
Performing the same kind of experiment with different levels of expertise, the four different groups of investigators achieved quite different results, which became apparent after calculation of the different performance criteria.
For the determination of accuracy, the MARD from the reference method (YSI) was calculated for the different groups with the three samples with 45% hematocrit concentrations. The results are provided in Figure 1. The training status had a clear impact on the MARD values for BG*Star, iBG*Star, and OneTouch Verio Pro, whereas Accu-Chek Aviva appeared to be more robust when applied in this laboratory experiment.
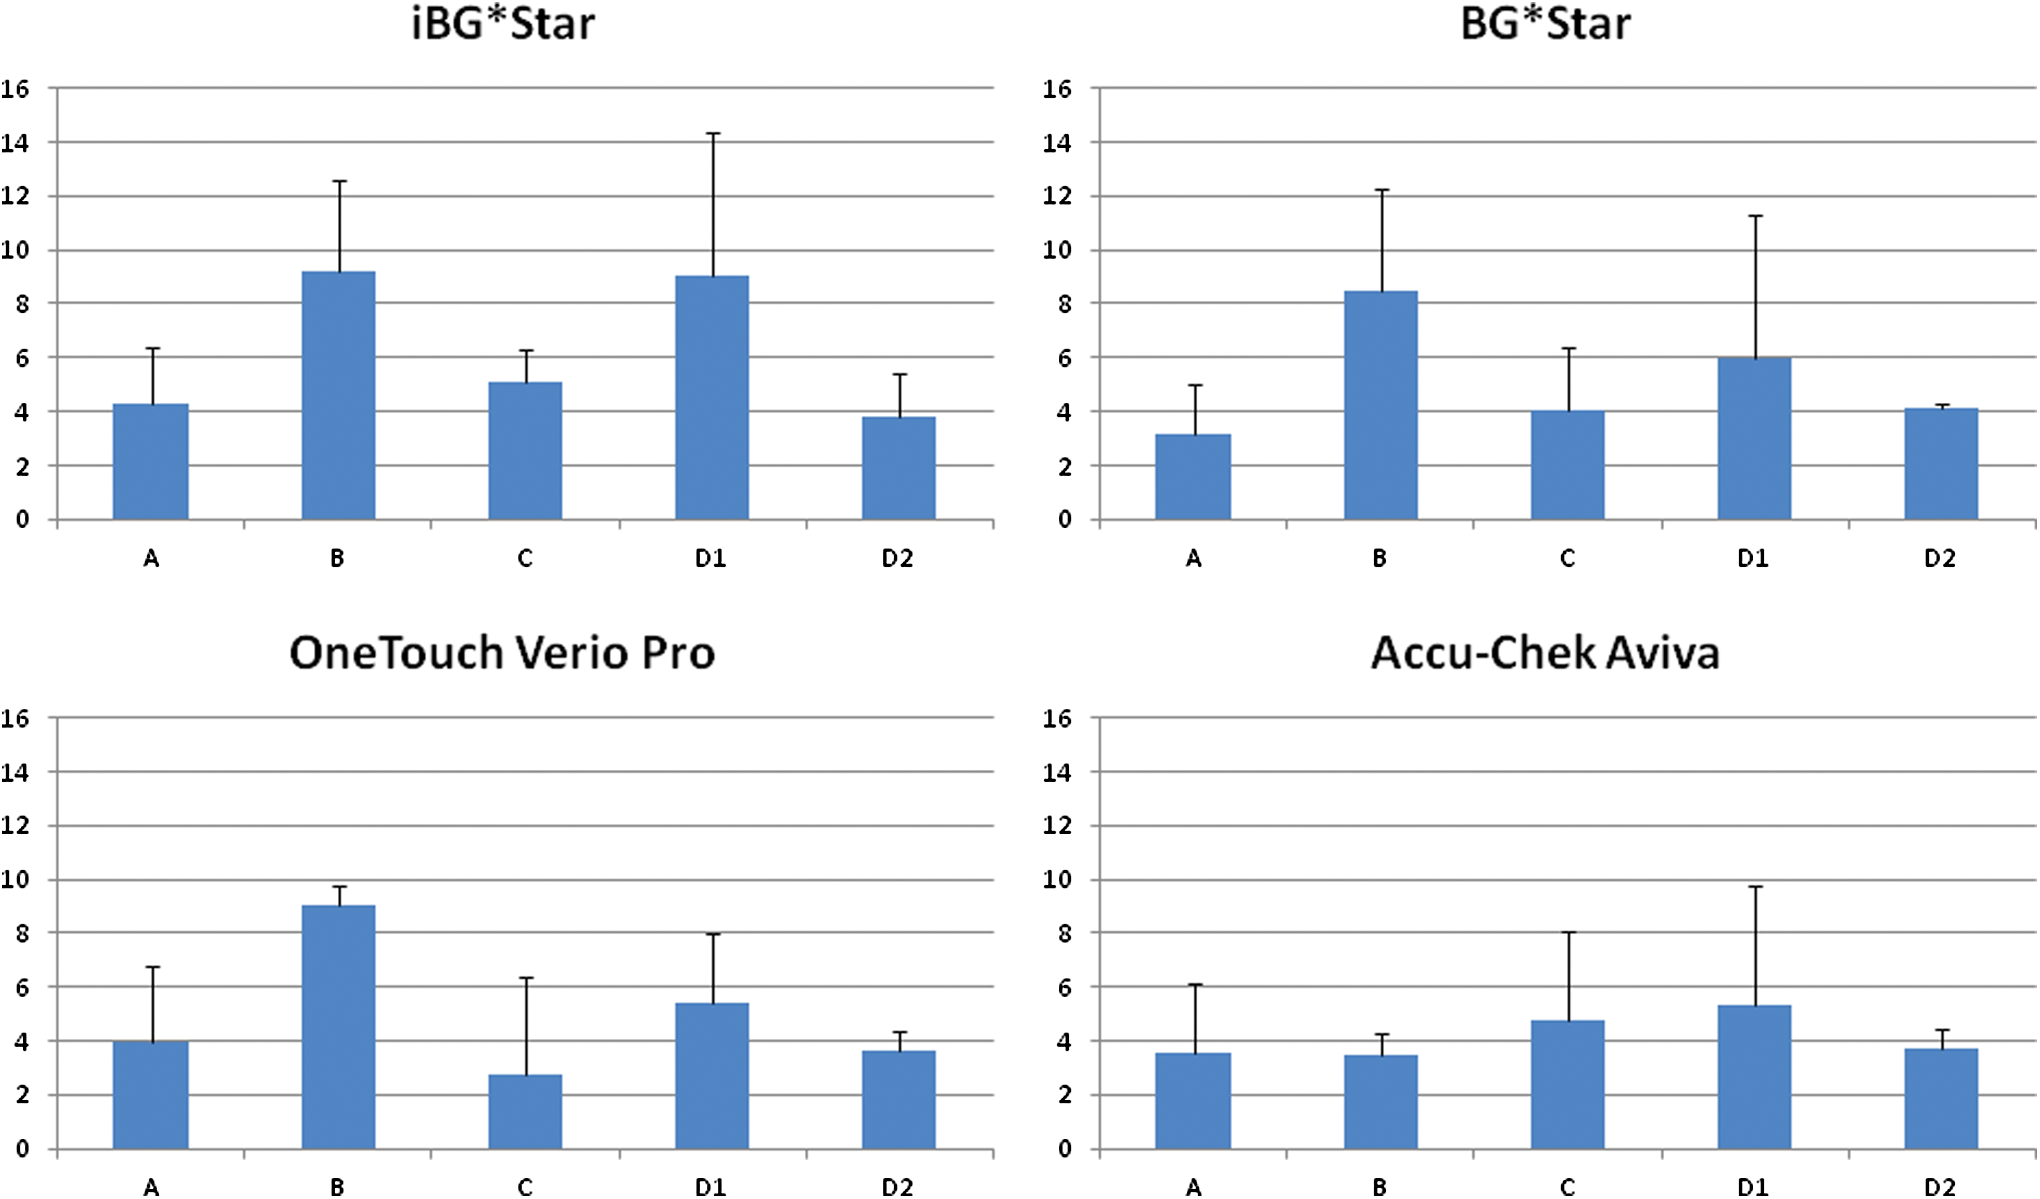
MARD values obtained from the differently experienced and trained laboratory teams with the tested devices. A, expert group; B, normal laboratory group; C, molecular biology group; D1, untrained nurses; D2, team D1 team after extensive training. MARD, mean absolute relative difference.
For precision determination, the coefficient of variation for each of the three blood glucose concentrations was calculated with all samples. Precision was good for all devices: iBG*Star, 2.4%–4.3%; BG*Star, 2.8%–4.9%; Verio Pro, 2.2%–3.9%; Accu-Chek Aviva, 2.0%–2.9%. For the devices employing EBCAs, there were again performance differences in correlation with the training status of the laboratory investigators, as shown in Figure 2.
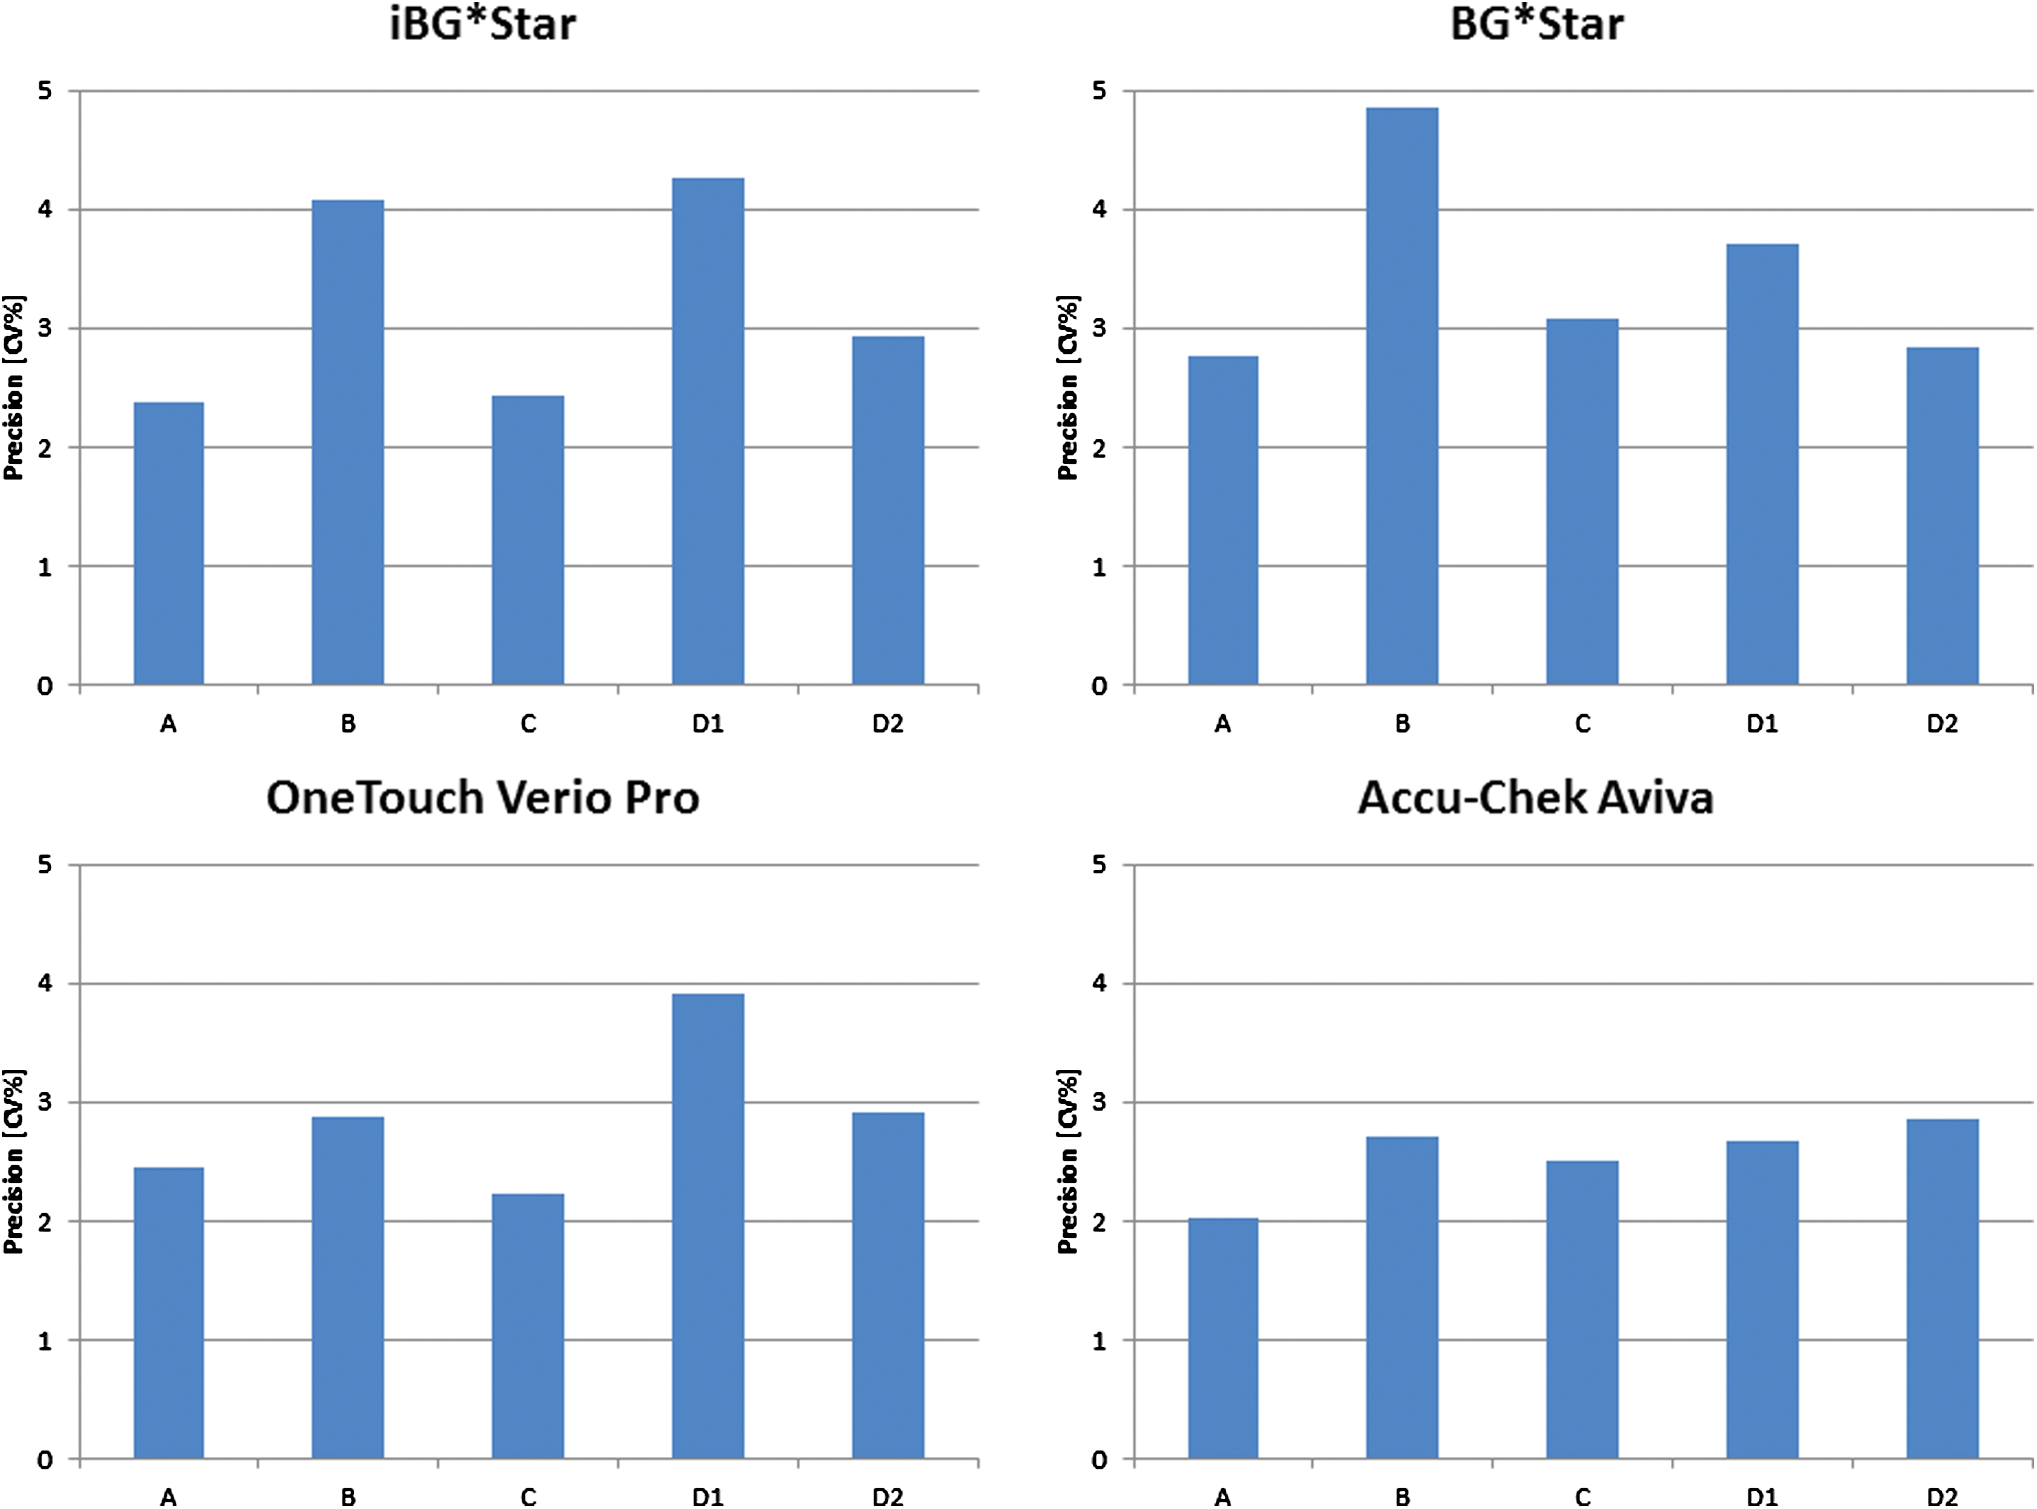
Precision of the device measurements when operated by the different laboratory teams. A, expert group; B, normal laboratory group; C, molecular biology group; D1, untrained nurses; D2, team D1 after extensive training.
Hematocrit interference was tested for the different devices with the glucose value at 45% hematocrit normalized to be 100%; the results are shown in Table 1. Team C (very accurate laboratory personnel, but no BGM testing experience) produced only “error” messages by the devices with BG*Star and iBG*Star when testing high hematocrit levels. Therefore, the HIF could only be determined from the low and normal hematocrit concentrations in this group. The results of the HIF determination are shown in Figure 3. When tested by experienced or trained investigators, the devices iBG*Star, BG*Star, and OneTouch Verio Pro showed no hematocrit interference (HIF <10%), whereas inexperienced investigators obtained a different result (HIF ≥10% with iBG*Star and OneTouch Verio Pro). Accu-Chek Aviva demonstrated false-low glucose values with high hematocrit levels. This result was independent of the training status of the investigator.

Mean HIF by laboratory team and device. A, expert group; B, normal laboratory group; C, molecular biology group; D1, untrained nurses; D2, team D1 after extensive training. HIF, hematocrit interference factor.
Glucose result at 45% hematocrit is set to 100%.
The single glucose value for the whole series of measurements indicates that the experiments were done speedily with one and the same prepared sample. A slightly higher variability in the high-range glucose samples is to be expected (standard deviation of analytical method, uptake of glucose by erythrocytes over time). Differing glucose values within a measurement series of the low-range or mid-range glucose values, in contrast, point to a prolonged time period needed for the experimental conduct.
Group C only produced “sample composition errors” (as indicated by the SMBG device). When the glucometers recognize an unphysiological sample, an error is reported instead of a potentially false glucose result. Repeated and prolonged sample mixing—as necessary for preparation especially of the high hematocrit ranges—likely raised pO2 values in the less experienced hands.
There was a clear impact of staff training and expertise on the amount of meter errors observed during the experiments. Group A produced 0% errors with all devices. Group B experienced 24% of errors with iBG*Star and 16% with BG*Star (Verio Pro and AccuChek Aviva: both 0%). Group C had 33% of errors each with BG*Star and iBG*Star (all high hematocrit tests) and no errors with the other two devices. Group D1 had 6.9% and 3.7% errors with iBG*Star and BG*Star, respectively, no errors with Verio Pro and 5.5% with Accu-Chek Aviva. After training (D2), the error rate dropped to 1.4% with iBG*Star, 0.7% with BG*Star, and 0% with both Verio Pro and Accu-Chek Aviva.
Discussion
The purpose of this study was to investigate the influence of training and experience of the laboratory personnel—and the use of a detailed test protocol including sample pO2 adjustment—on the results of hematocrit interference protocols of blood glucose meters with EBCAs, such as BG*Star, iBG*Star, and OneTouch Verio Pro. The investigation was performed with laboratory samples that were artificially manipulated to contain different glucose concentrations and different hematocrit levels. This standard laboratory protocol was demonstrated to be insufficient to draw conclusions about system accuracy. 8 –10 However, a general sensitivity of the underlying technology to hematocrit interference as well as the reproducibility of repeated measurements (precision) under the tested conditions can be identified.
Unfortunately, based on such laboratory testing, conclusions regarding accuracy are frequently drawn in the literature. This approach is in any case disadvantageous for blood glucose meters with glucose oxidase (GOD)-based measurement technology. The laboratory manipulations associated with the test protocol compromise the sample integrity, and especially the oxygen content of the samples may vary widely after handling, which has a negative impact on the performance data results of GOD-based meter technologies in general and on meters using EBCAs in particular. More experienced laboratory teams minimize the error probability by carefully handling the samples and thereby introducing less pO2 variability within the sample series to be tested. Literally a single vehement shaking move, creating slight blood foaming, will raise the pO2 of the respective blood sample above physiological values, resulting in a sample composition that the SMBG devices are self-evidently not constructed for. The expert laboratory teams discarded those samples and started anew with sample preparation, whereas inexperienced teams were not aware of this mishandling.
In our study, a laboratory assessment of accuracy and precision as well as a brief hematocrit interference protocol was performed by five different investigator groups in Germany and in the United States. The groups either used their normal in-house protocol for glucose meter performance testing (teams B and D1) or they worked according to a very detailed “expert” SMBG blood sample preparation protocol developed in the course of the laboratory work with (i)BG*Star during the previous 2 years (teams A, C, and D2). This expert protocol takes into consideration the special sensitivity of meters employing electrochemistry-based algorithms to sample composition and oxygen interference, occurring in the context of laboratory sample manipulation.
Our results give evidence of a major impact of the knowledge about the specific sensitivities of meters employing EBCAs during laboratory tests on the final results obtained through similar experiments. The more familiar the team with the laboratory techniques to avoid sample composition errors by careful sample handling the better the accuracy and precision results and the more meaningful the outcome of the hematocrit interference tests with BG*Star and iBG*Star. We also tested two other meters (OneTouch Verio Pro and Accu-Chek Aviva) in this setting. Although the glucose-dehydrogenase (GDH)-based Verio Pro system (also employing dynamic electrochemistry-like algorithms) showed results similar to (i)BG*Star, the GDH-based technology of OneTouch Aviva is not influenced to the same extent by the sample manipulations as are the GOD methods. This might explain why different groups have obtained and published less favorable results with BG*Star and Verio Pro (or other meters equipped with EBCAs) when comparing with Aviva. 5,6 Laboratory groups working in hospitals, specialized diabetes wards, or other healthcare units throughout the world perform their own tests comparing new SMBG devices before recommending them to their patients. Our results may initiate development of refined laboratory procedures in those healthcare centers to facilitate unbiased results, independent of glucose meter systems.
In conclusion, accuracy testing of blood glucose meters for patient self-testing in a laboratory setting with venous blood samples—spiked with glucose and adjusted to physiological values of HCT and pO2—is a complex undertaking. It requires expertise, special knowledge about the individual sensitivity of the applied technologies to sample handling (resulting, e.g., in changes of oxygen pressure or sample composition), and should only be performed in strict accordance with appropriately designed experimental protocols and by experienced healthcare professionals. Otherwise, a negative bias may be introduced in disfavor of some of the glucose meter technologies. Based on our results, we recommend healthcare centers that wish to perform their own accuracy testing to implement parallel SMBG assessments with capillary blood freshly obtained from patients and in accordance with the instructions for use of the devices to produce suitable performance data.
Footnotes
Acknowledgment
The reported study is an investigator-initiated study supported by Sanofi-Aventis Deutschland GmbH in the year 2012.
Author Disclosure Statement
D.K. has received consulting fees and travel support from Sanofi. A.P. has received travel support, consulting fees, and study grants from Sanofi. The authors have no conflict of interest.