
Abstract
Background:
Glucose variability (GV) has been increasingly (or more extensively) studied in patients with type 1 diabetes (T1D) in the ambulatory setting; limited data exist on GV in hospitalized patients with T1D.
Materials and Methods:
Retrospective single center cohort study, we analyzed in-hospital glucose measurements to assess GV in 736 hospitalized patients in different units over a consecutive 5-year period of time. GV was assessed by mean blood glucose (BG), Average daily risk range (ADRR), high BG index, and low BG index. To place our findings in context, we conducted a systematic review using Cochrane collaboration methodology to critically analyze current published literature on GV in hospitalized T1D patients.
Results:
Overall, glycemic control was suboptimal with mean BG 183 ± 51.5 mg/dL and mean ADRR 35 with only 16% patients being categorized as low risk (ADRR <20) for hypo or hyperglycemia. Patients admitted in medical units had mean BG of 194.4 ± 42.8 mg/dL (95% CI = 101.2–346.6) and ADRR of 39.4 ± 16 (95% CI = 1.3–118.7), which were higher than the patients admitted in the surgical units (mean BG 168.1 ± 35.7 (95% CI = 74.8–301.8) and mean ADRR (28.8 ± 13.1 [95% CI = 0.3–93.1]). For the systematic review, initial search yielded 2336 studies for screening, however, none of them had data specific for T1D.
Conclusion:
GV is high in hospitalized T1D patients admitted at our tertiary care center. Review of the literature shows paucity of data regarding GV in hospitalized patients with T1D.
Introduction
T
Despite recent technological advancement in the management of T1D, GV remains a challenge both for the patient and the clinician. GV has been measured using various mathematical approaches over the last 60 years. 2 The analysis of GV has improved with the development and maturation of continuous glucose monitoring (CGM) technology. 3 CGM has led to the development of closed loop glucose: insulin control thereby decreasing hypoglycemic and hyperglycemia and ultimately improving GV. 4
Currently, GV is reported as percent time spent in various glucose ranges and as indices that assign a risk function to a glucose measurement. 5,6 In the ambulatory setting, glucose concentrations of <70 and >180 mg/dL are consistent with hypo- and hyperglycemia, respectively. High BG index (HBGI) and low BG index (LBGI) were developed by assigning a risk score to measurements below 70 and above 180 mg/dL, respectively. 5,6 Average daily risk range (ADRR) is a sum of HBGI and LBGI. 6 The above measurements have shown to be a reliable representation of patients' glycemic control as illustrated in several studies. 7
Concurrent with the development of CGM and new measures of GV, randomized controlled trials (RCT) to achieve tight glucose control in hospitalized patients have been conducted and reported. 8,9 These studies have focused on all hospitalized patients and have included subjects from normal glucose tolerance to diabetes mellitus. At the time of hospitalization, patients with T1D would be expected to have maximum GV compared with other patient cohorts. However, the number of subjects with T1D who has been studied in randomized trials of tight glucose control in this setting has been very limited and to our knowledge, no subgroup analyses have been reported. Therefore, we investigated GV in hospitalized T1D patients at our institution. To place our findings in context, we conducted a systematic review of all studies evaluating GV in hospitalized T1D patients.
Materials and Methods
We performed an institutional review board-approved retrospective review of the electronic medical records (EMRs) of n = 3241 T1D patients admitted to St. Mary's Hospital of Mayo Clinic, Rochester, MN from January 1, 2006 to December 31, 2010.
Patients with T1D were identified from an electronic database. The electronic and paper medical records were reviewed to gather data for all T1D patients admitted to the hospital during the study period. Three thousand two hundred forty-one medical records were evaluated, but only 1541 satisfied eligibility criteria. The 1541 records retrieved represented 1 or more hospitalization episodes in 736 patients with T1D, who approved use of their medical records for research.
T1D was diagnosed on the basis of clinical criteria of significant GV; diabetic ketoacidosis (DKA), persistent requirement of insulin soon after diagnosis, and endocrinologist-documented diagnosis were diagnosed as T1D. Exclusion criteria were age <18 years, a diagnosis of type 2 diabetes, a history of pancreatic transplantation, and endocrinologist-documented diagnosis were diagnosed as type 2 diabetes. We also excluded those patients without body mass index (BMI) data. Additional demographic and comorbidity data gathered were as follows: age, gender, and year of onset of diabetes, BMI, details of treatment since diagnosis, history of DKA, reason for admission, and hospital unit of admission.
During hospitalization, patients on subcutaneous insulin were managed with Aspart (Novolog), Glulisine (Apidra), and Regular (Novolin). Regular insulin was used for IV infusion.
Protocols were used to manage glucose in all T1D patients. For patients requiring IV insulin, Human regular insulin (Novolin R) 250 units were used in 250 mL of 0.45% NaCl (1 unit/L). Target BG range was set between 110 and 150 mg/dL. BG was checked every hour while patients remained on insulin infusion. For patients managed with subcutaneous insulin during hospitalization, basal bolus insulin therapy was used by injection or when appropriate insulin pump. Basal insulin use was reviewed daily. Bolus insulin was modified based on food consumption and supplemental scale based on premeal glucose.
Assessment of glycemic variability
Glucose testing was done using glucometers and the hospital clinical laboratory. Total of 121,000 glucose measurements were analyzed. The glucose meter used was AccuChek. Quality control for glucose testing was performed by Mayo Clinic Rochester Hospital Clinical Laboratory services periodically in keeping with hospital accreditation regulations.
BG measurements during hospital stay were collected with an electronic search from the EMR. We assessed GV using the following measures: mean BG ± standard deviation (SD), HBGI, LBGI, and ADRR. LBGI, HBGI, and ADRR were calculated based on prior reports. 3 LBGI, HBGI, and ADRR were further categorized as follows: LBGI as low (<2.5), moderate (2.5–5.0), and high (>5); HBGI as low (<4.5), moderate (4.5–9), and high (>9); and ADRR as low (<20), moderate (20–40), and high (>40). 3,5,10,11
LGBI, HBGI, and ADRR were calculated as follows: 3,5,10,11
First BG values were transformed into symmetric interval (−10, 10), representing entire BG range (20–600 mg/dL). Thereafter, readings were assigned risk values which ranged from 0 to 100. Higher HBGI and LBGI determined more frequent hyperglycemia and hypoglycemia, respectively.
HBGI and LBGI were calculated as follows:
the ADRR is computed as the average of the risk range per day using the formula:
glucose measurements that were in the range 70–180 mg/dL were considered as euglycemic for calculation of LBGI, HBGI, and ADRR.
Systematic review
We conducted a systematic review to summarize the published literature on GV in hospitalized T1D patients. The systematic review was conducted in accordance with recommendations from the Cochrane collaboration and the preferred reporting items for systematic reviews and meta-analyses. 12
Study eligibility and identification
We included studies regardless of study design, sample size, and language with details in Table 4. We excluded all nonoriginal reports that did not contain original data (reviews, commentaries, and letters). An expert reference librarian (Patricia J. Erwin) designed and conducted the electronic search strategy with input from the study investigators with expertise in systematic reviews. To identify eligible studies, we searched electronic databases (Ovid MEDLINE, Ovid EMBASE, Web of Science, Scopus, and citation search for key articles) from 1970 to 2015. Duplicate citations were removed before evaluation. Two reviewers working independently reviewed all abstracts and titles using a standardized questionnaire form to determine study eligibility. Full articles were retrieved and reviewed in duplicate for inclusion. The authors of included studies which met the criteria were contacted for obtaining data. Disagreements were resolved by consensus or arbitration.
Data analysis
Data are displayed as mean ± SD or frequency (%) unless otherwise stated. To compare GV metrics between groupings of patients (e.g., medical vs. surgical patients), two-sample t-tests were used. Differences in the percentage of patients by GV-risk categorization were tested using Pearson's chi-square test. Two-sided P < 0.05 was required for statistical significance. No adjustments for multiple testing have been applied to reported P-values. SAS software (Cary, NC) was used for analysis.
Results
Glycemic control during hospitalization was assessed in 736 T1D patients with mean age 46 ± 16 years. Average HbA1c was 8.3% ± 2.1% and mean duration of T1D was 25.6 ± 15.5 years. Majority (62%) of patients were treated with multiple daily injections. Baseline characteristics of patients are summarized in Table 1.
BMI, body mass index; DKA, diabetic ketoacidosis; ICU, intensive care unit.
The mean BG during hospital admission was 183 ± 42 mg/dL. GV data are shown in Table 2. Forty-eight percent of the patients were classified as moderate-risk ADRR, and only 16% of patients were classified as low-risk (ADRR <20). Approximately 22% and 65% of the patients meet the HBGI criteria for “moderate” or “high” risk for hyperglycemia, respectively, whereas only 14% and 5% of the patients were at “Moderate” or “High” risk for hypoglycemia. We performed further analysis comparing medical versus surgical admissions, metabolic versus nonmetabolic admissions, and hyperglycemia-related versus hypoglycemia-related admissions as shown in Table 3. Patients admitted for metabolic reasons were diagnosed with DKA, nonketotic hyperosmolar state, severe hyperglycemia, or severe hypoglycemia.
ADRR, average daily risk range; BG, blood glucose; HBGI, high BG index; LBGI, low BG index.
Medical versus surgical units
Overall, mean BG was observed to be high in patients with medical admissions (194.4 ± 43, 95% CI = 101.2–346.6) compared with surgical admissions (mean 168.1 ± 36, 95% CI = 74.8–301.8) as shown in Table 2 and Figure 1A. ADRR showed significant difference between medical admissions (mean 39.4 ± 16, 95% CI 1.3–118.7) and surgical admissions (mean 28.8 ± 13, 95% CI = 0.3–93.1) with 47% and 43% of the patients in the medical unit classified as high- and moderate-risk ADRR, respectively, whereas only 19% of the patients in surgical units showed high-risk ADRR. In addition, HGBI during hospitalization for medical reasons was high, and most of the patients were classified high risk for hyperglycemia. The value for LGBI was in low range with 79% of the hospitalized patients being at low risk for hypoglycemia. High-risk HBGI was present in 47% of surgical patients. Furthermore, 84% of the patients admitted in surgical unit showed low risk for LBGI as shown in Table 3.
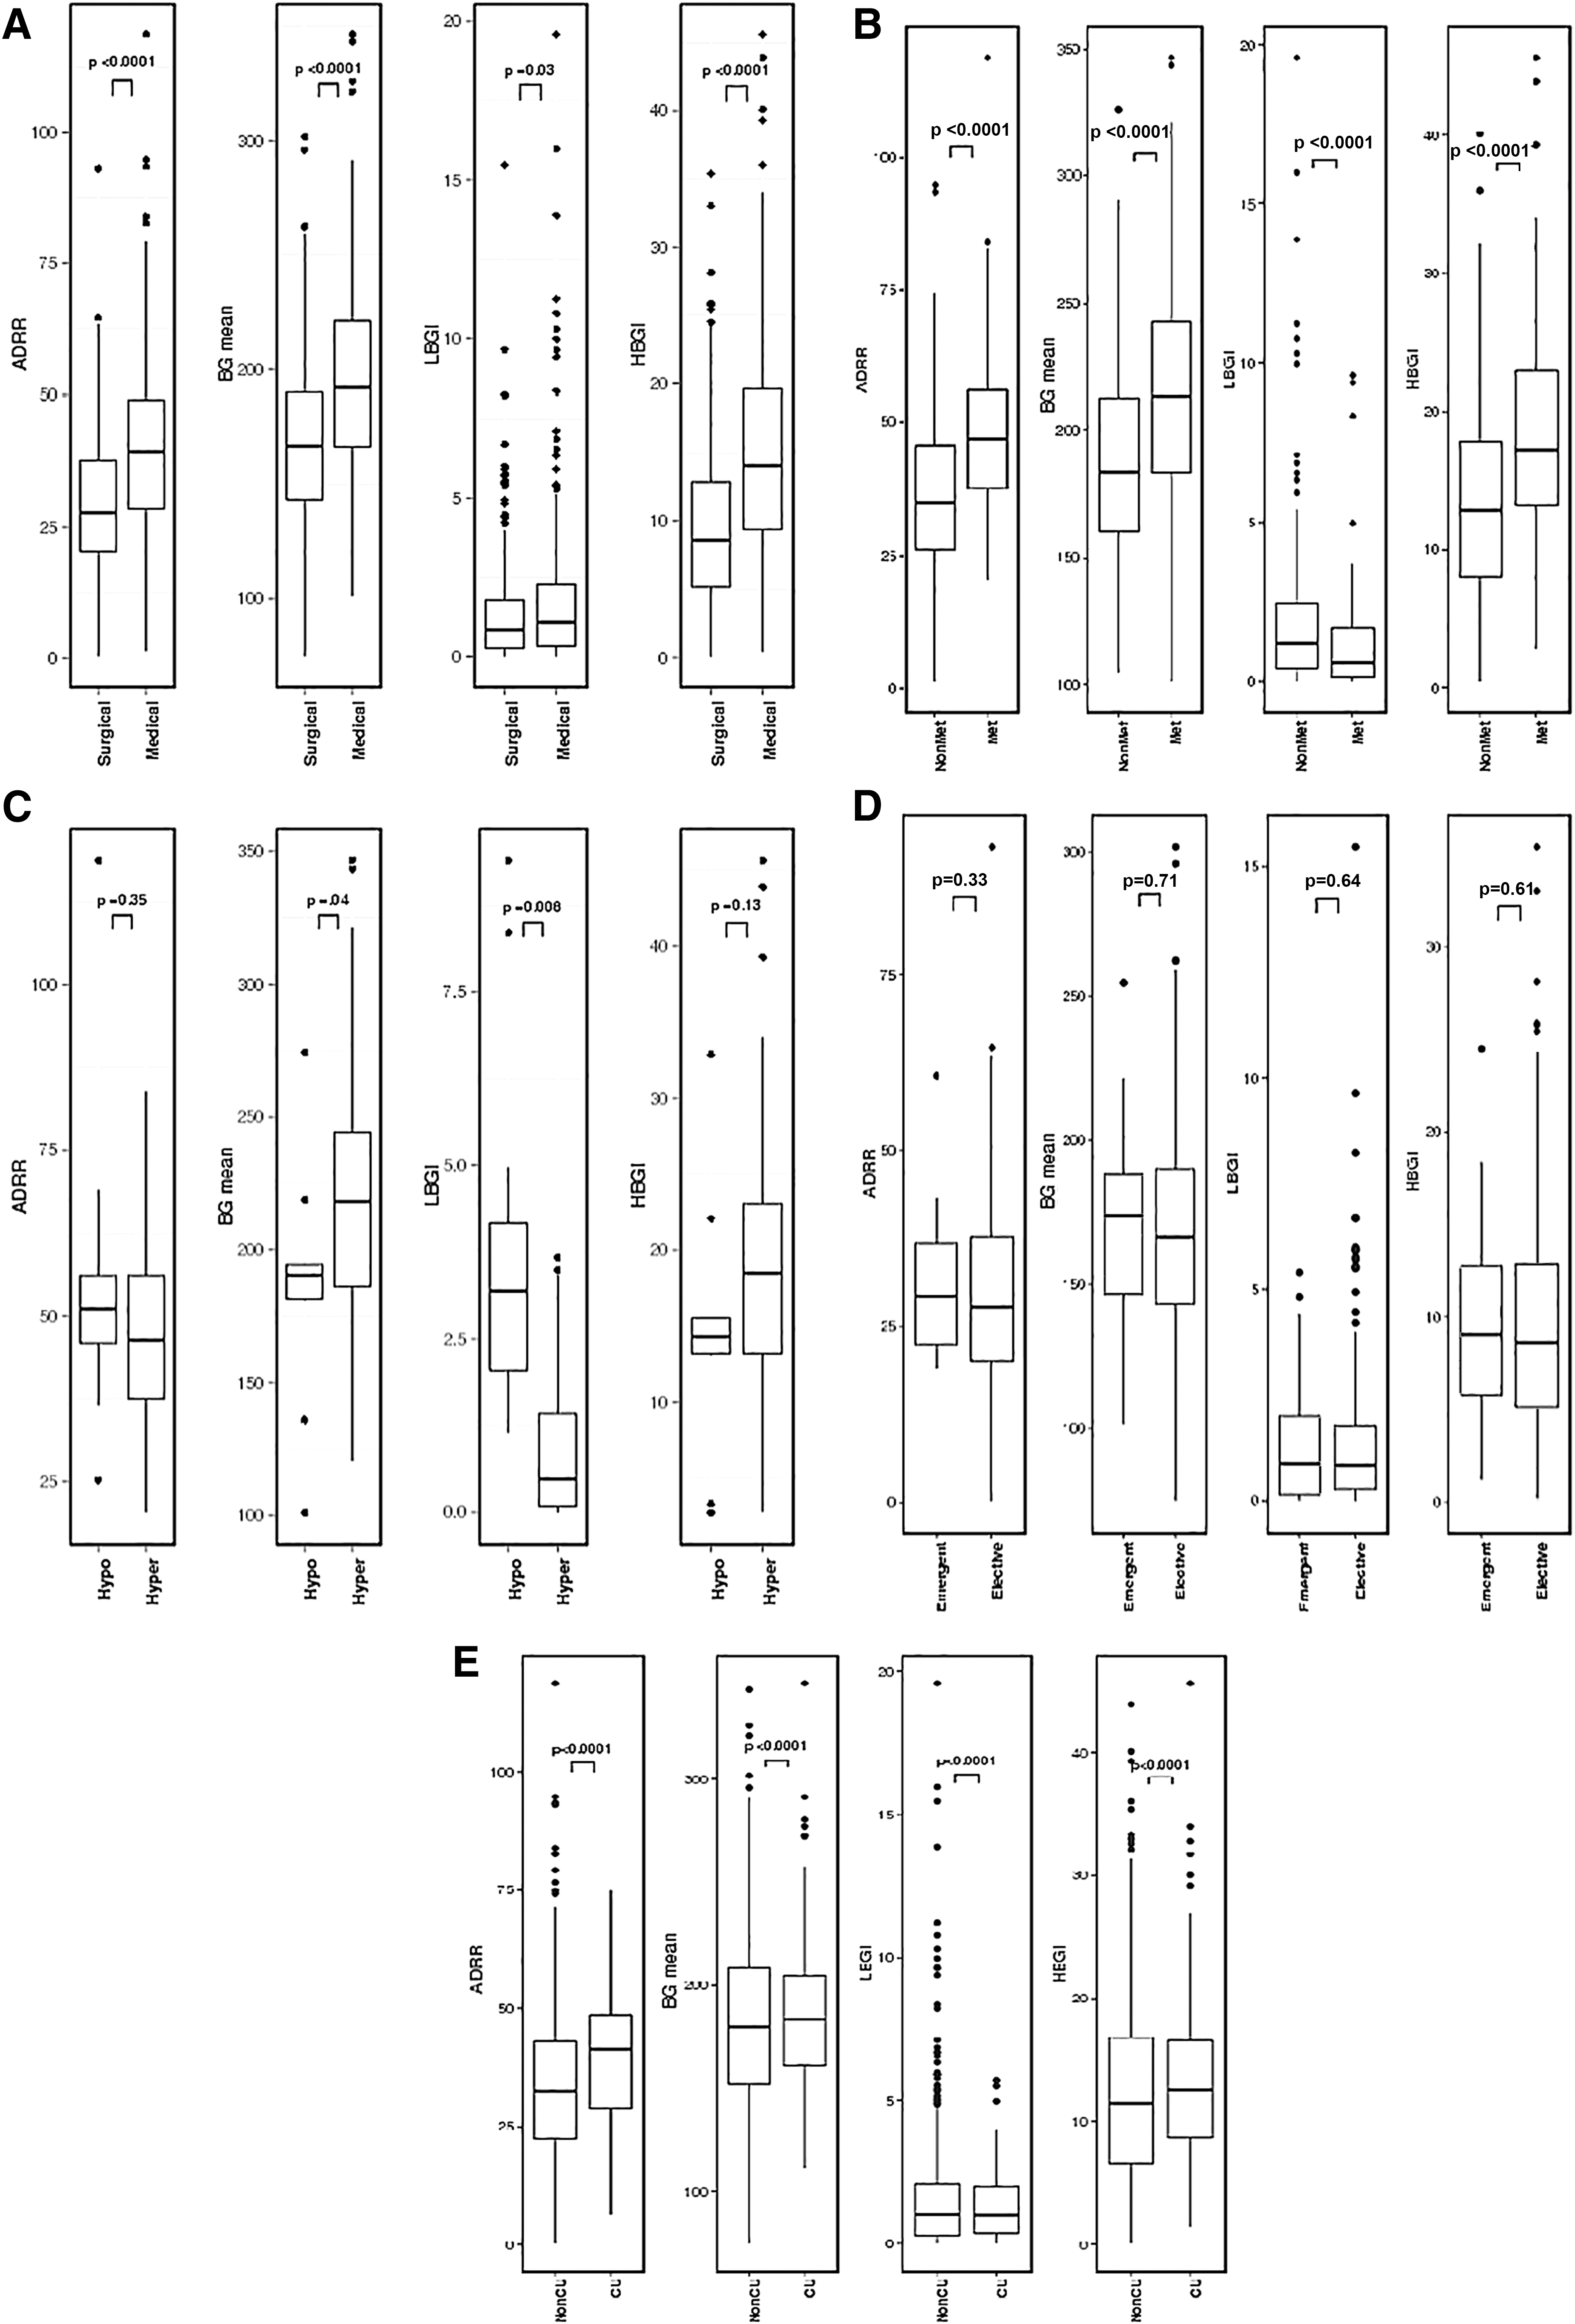
Glycemic variability indices comparison in hospitalized type 1 diabetes patients in different admitting units
Metabolic versus nonmetabolic admission
Patients were admitted to medical units for metabolic and nonmetabolic causes. As shown in Table 2 and Figure 1B, GV was observed to be higher in patients admitted for metabolic reasons when compared with other reasons for admission (mean BG 214.1 ± 42.6, 95% CI = 101.2–346.6 vs. 186.7 ± 40.5, 95% CI = 104.6–326.1) In addition, admissions for diabetes-related metabolic complications had a higher ADRR compared with nondiabetes-related admissions (mean ADRR 48.7 ± 15.6, 95% CI = 20.4–118.7 vs. 35.7 ± 15, 95% CI = 1.3–94.8) with 71% of the admissions for diabetes-related metabolic complications classified as high risk compared with 39% for nondiabetes-related admissions. Ninety-two percent of the patients hospitalized for metabolic reason were at high risk for HBGI, whereas 72% patients admitted for nonmetabolic reason reported high risk for HBGI (P < 0.001). Risk for LBGI was found to be very low with 2% and 7% being high risk for LBGI in metabolic and nonmetabolic admissions, respectively (Table 3).
Hyperglycemia versus hypoglycemia
As expected, admissions for hyperglycemia had a higher mean BG compared with those admitted for hypoglycemia in metabolic admission group (mean BG 217.3 ± 41.6, 95% CI = 120.5.2–346.6 vs. 186.1 ± 43 95% CI = 101.2–274.5) (Table 2 and Fig. 1C). However, there were no differences when ADRR and HBGI were compared between admissions for hyperglycemia and hypoglycemia (mean ADRR 48.1 ± 14.5, 95% CI = 20.4–83.9 vs. 55.2 ± 24, 95% CI = 25.2–118.7) and (mean HGBI 18.8 ± 8, 95% CI = 2.8–45.6 vs. 14.7 ± 8, 95% CI = 2.8–32.9). Understandably, LBGI was higher in patients with admissions for hypoglycemia compared with admissions for hyperglycemia (mean LBGI 0.9 ± 1, 95% CI = 0.0–3.7 vs. 3.8 ± 2.7, 95% CI = 1.1–9.4) with a frequency of 45% and 18% for moderate- and high-risk LBGI, respectively (Table 3).
Emergent versus elective (surgical admission)
Majority of the patients were admitted in elective surgical unit. Mean BG was similar between patients admitted in emergency and elective unit (170.9 ± 35, 95% CI = 101.4–254.7) versus (167.9 ± 36, 95% CI = 74.8–301.8), respectively. Similarly, mean ADRR also showed no difference between admitting emergent and elective units (mean ADRR, 31.1 ± 10.7, 95% CI = 19–60.6) and (28.7 ± 13.3, 95% CI = 0.3–93.1) (Tables 2 and 3; Fig. 1D).
Intensive care unit versus nonintensive care unit
Mean BG in patients with T1D admitted to the intensive care unit (ICU) (187.4 ± 39, 95% CI = 161.2–205) showed no difference from patients admitted to nonintensive care unit (non-ICU) settings (182 ± 43, 95% CI = 152 ± 209). Mean ADRR was observed to be higher in patients with ICU admission compared with non-ICU admission (39 ± 13, 95% CI = 29–48.6 vs. 34 ± 16, 95% CI = 22.5–43.1). However, LBGI and HBGI showed no difference between the two admitting units (Tables 2 and 3; Fig. 1E).
Insulin infusion versus subcutaneous insulin therapy
318 (43.4%) patients admitted during hospitalization were started on insulin infusion for the management of T1D. These patients showed better mean BG compared with patients managed with subcutaneous insulin therapy (178.2 ± 36.8, 95% CI = 106.1–346.6) versus (187.2 ± 45.2, 95% CI = 74.8–343.5, P = 0.0038). Mean ADRR showed no difference between two groups.
Insulin infusion was more frequently used in patients admitted in surgical units [191 (26%)] compared with medical unit [127 (17.3%)] (P < 0.0001).
Systematic review
We screened 2336 studies, of which 7 studies met criteria for final review (Supplementary Table S1; Supplementary Data are available online at
Discussion
In this retrospective study of hospitalized patients with T1D, significant GV across all hospital units was noted with some hospital units showing greater GV compared with others. Our systematic review confirms the paucity of studies addressing inpatient GV in T1D patients and highlights the need for prospective studies to better understand contributing factors and effect on patient important outcomes and test potential interventions to minimize GV. Our study reveals that patients with T1D have significant GV in the inpatient setting.
Overall, GV was more pronounced in T1D patients admitted in medical units compared with surgical units. Intravenous insulin infusion was used more frequently in surgical units compared with medical units accounting likely for this difference. Despite the implementation of standardized protocols to manage inpatient glycemic control in our institution, T1D patients continued to have a high-risk HBGI, including those admitted for hypoglycemia. Patients admitted for metabolic reasons had higher ADRR compared with those admitted for nonmetabolic reasons. These are thus high-risk cohorts requiring individualized, intensive management during hospitalization. Analysis of the reasons for this would enable better glucose control in this cohort. Despite IV insulin use, ICU patients had higher ADRR, indicating the need to review these protocols with a view to improving glucose control.
BG levels remained difficult to control during hospitalization in patients with T1D; however, it is critical to optimally manage such patients in the inpatient settings. Poor glucose control increases length of stay 13 –15 and risk of infection. 15 In addition, GV results in utilization of more resources such as medical provider work associated with managing BG and increases cost. 16 Hypoglycemia will trigger attention from nursing staff and, in addition, notification of medical teams. Similarly, hyperglycemia will result in additional work for nursing and medical providers and subsequently for laboratory personnel if frequent laboratory glucose testing is requested.
High BG concentrations are very common in critically ill hospitalized patients, however, tight BG has not shown to be effective in reducing mortality 9,17 and increases the risk of developing hypoglycemia. 18 Despite the fact that uncertainty exists regarding BG control in hospitalized patients with diabetes, it is well accepted that avoidance of glucose excursions is important. Optimal glucose control criteria in hospitalized patients continue to be debated. 19
In 2001, Van den Berghe et al. published the results of an RCT showing, reduction in mortality in surgical patients with tight control of BG with target BG between 4.4 and 6.1 mmol/L 8 as shown in Table 4. Similar results were shown in a 2006 study on medical ICU patients. 17 However, the NICE-SUGAR study randomized ICU patients to intensive glycemic control with a target range 4.5–6.0 mmol/L or conventional control with target of <10.0 mmol/L. 9 Conventional control of BG resulted in higher reduction in mortality. In a different study, no difference in mortality was observed when intensive control of BG was compared with conventional control with target BG of 7.8–10 mmol/L. 20 Many authors have argued against intensive treatment with insulin, which could result in more frequent hypoglycemia without further reduction in mortality. 18 At this time, there is no current recommendation on what optimal BG value should be during hospitalization. However, American Diabetes Association 2015 guidelines suggest maintaining BG between 6.1 and 7.8 mmol/L may be appropriate for selected patients. 21
mmol/L.
RCT, randomized controlled trials.
As described in our article, patients with T1D may be hospitalized for multiple reasons. Each cohort has significant and unique comorbidities. Therefore, the optimal glucose target may differ between cohorts. Prospective, carefully designed studies are needed to establish optimal glucose control targets for patients with T1D during hospitalization.
GV in hospitalized T1D patients is a formidable clinical problem. GV has been improved in these patients in ambulatory control by the availability and use of CGM. 22,23 Given the high GV and unpredictability of glucose concentrations in hospitalized T1D patients, improvements would require more systematic and frequent glucose measurements. Such measurements are best provided by use of CGM systems.
To date, only one CGM (GlucoScout, International Biomedical) is approved to monitor glucose concentrations during hospitalization in the United States. It measures BG every 5 min by using enzyme electrode technology. However, in Europe, five intravenous (IV) CGM devices have been approved. (1) GlucoClear by Edwards Lifesciences (Irvine, CA), (2) OptiScanner 5000 (OptiScan Biomedical, Hayward, CA), (3) Glysure system (Glysure, Oxfordshire, United Kingdom), (4) ERIUS (Maquet, Rastatt, Germany), and (5) Sentrino (Medtronic, Northridge, CA).
CGM in the inpatient setting has been mostly performed in ICU settings in subjects across the spectrum of glucose tolerance without substantial numbers of patients with T1D. In a prospective RCT involving 124 critically ill patients, hypoglycemic episodes were observed to be reduced in the group of 63 patients with real-time CGM compared with 61 patients with arterial glucose measurements. However, glycemic control was not different in both groups. 24 Similarly, patients with acute coronary syndrome were found to have no hypoglycemic events when they were randomized to subcutaneous CGM compared with a control group with capillary measurements. Both groups showed significant improvement in glycemic control. 25
It is important to consider clinical factors which can affect CGM readings such as severity of illness, abnormal body temperature, and various medications in hospitalized patients. 26 However, as described above, CGM technology has matured enough to be utilized/tested in hospitalized T1D patients. Important outcomes that should be studied in relation to GV in T1D include complication rates, length of hospital stay, patient satisfaction, cost/benefit ratio, and quality of care.
Future studies should try to improve GV during hospitalization in patients with T1D. These studies would need to be carefully planned and would need to measure glucose frequently with an appropriate technique. Initial studies to improve glucose control in hospitalized patients with T1D could start with exploring alternative clinical models of care in selected cohorts of patients. Such a cohort could be selected based on biologic risk of the patient such as T1D with acute infection or acute vascular event and interdisciplinary agreement with infectious disease and or/cardiology.
One of the limitations of our study is measurement of glucose by glucometers and laboratory methods. Furthermore, samples tested could have been capillary, venous, or arterial. Analyses directed at method used and type of sample assessed would have utilized fewer data points per day and would have falsely increased GV and on occasion prevented calculation of GV with less than three data points per day. We included all glucose measurements that were used to manage the patient. Thus, the GV reported reflects GV comprehensively.
By providing analysis of GV in this article, we hope that the stage has been set for studies using evaluating GV more systematically and prospectively in the hospital setting in patients with T1D. The care of T1D in the outpatient has been revolutionized by the availability of continuous/more frequent glucose data. A similar approach is essential to improve glucose control for T1D patients during hospitalization.
In conclusion, GV is high in hospitalized patients with T1D. Given the maturation of CGM technology and the glucose: insulin closed loop control (CLC) and the use of CLC for type 2 diabetes patients in hospital, 27 testing CLC and CGM use to reduce GV in hospital for T1D is an urgent, unmet clinical need.
Footnotes
Acknowledgments
We are grateful to Dr. Mohammad Hassan Murad and Patricia J. Erwin for their valuable contribution to this article. This work was supported by NIH DK 85516 (Y.C.K). Dr. Y.C.K. is the guarantor of this work, had full access to all the data, and takes full responsibility for the integrity of data and the accuracy of data analysis.
Author Disclosure Statement
No competing financial interests exist.
References
Supplementary Material
Please find the following supplemental material available below.
For Open Access articles published under a Creative Commons License, all supplemental material carries the same license as the article it is associated with.
For non-Open Access articles published, all supplemental material carries a non-exclusive license, and permission requests for re-use of supplemental material or any part of supplemental material shall be sent directly to the copyright owner as specified in the copyright notice associated with the article.