
Abstract
Background:
Glucose variability (GV) is a matter of interest for researches in recent years. It is connected with oxidative stress, which is crucial in the development of multiple complication of prematurity. However, glycemic variability in preterm infants was poorly investigated. This study aims to investigate glycemic variability obtained from a continuous glucose monitoring (CGM) system in a cohort of very low-birthweight (VLBW) infants.
Methods:
A prospective, single-center, open cohort study enrolled 74 VLBW infants with a mean birthweight of 1066 g and median gestational age of 28 weeks. A CGM system (Guardian Real-Time CGM®, Medtronic, Northridge, CA) was used to measure interstitial glucose concentration. The glycemic variability was calculated using EasyGV.
Results:
Most glycemic variability indices in VLBW infants showed log-normal distribution and for these, geometric mean ÷/ × geometric standard deviation (GSD) was calculated: M-value 2.28 (÷/ × 1.82), mean amplitude of glycemic excursions (MAGE) 1.89 (÷/ × 1.34), average daily risk ratio (ADRR) 2.22 (÷/ × 2.56), lability index 0.46 (÷/ × 1.71), J-index 0.46 (÷/ × 1.71), low blood glucose index 2.05 (÷/ × 1.66), high blood glucose index 1.11 (÷/ × 2.44), continuous overlapping net glycemic action (CONGA) 5.54 (÷/ × 1.16), mean of daily differences (MODD) 1.23 (÷/ × 1.38), and coefficient of variation 1.15 (÷/ × 1.31). Only SD of glucose concentration showed a normal distribution: arithmetic mean 1.24 (+/−0.37). ADRR, J-index, MODD, CONGA, and MAGE are moderately to strongly correlated with SD.
Conclusions:
In our cohort of VLBW infants, almost all glycemic variability indices showed skewed positive distribution. The natural central tendency measure for the log-normally distributed data is the geometric mean and for statistical variation is the GSD.
Introduction
G
The present study investigated values for glycemic variability in VLBW infants during the first week of life. Glucose measurements were obtained prospectively from a CGM system.
Aim of the Study
To define the glycemic variability obtained from a CGM system in a cohort of VLBW infants.
Patients and Methods
Patients
From 2013 to 2015, a single-center, prospective study was conducted at the Neonatal Intensive Care Unit of the Institute of Pediatrics, Jagiellonian University Collegium Medicum, a level-three neonatal center in Kraków, Poland. Infants were recruited if they had a birthweight less than 1500 g and were admitted to the unit during their first day of life. The exclusion criteria were as follows: major congenital malformations, diabetic mother, suspicion of inborn error of metabolism, perinatal trauma, and asphyxia.
Continuous glucose monitoring
For glucose measurements, a CGM system was used (Guardian Real-Time CGM®, Medtronic, Northridge, CA). The CGM sensor (Sof-Sensor®, Medtronic, Northridge) was inserted into the subcutaneous tissue of the lateral side of the thigh, from which measurements were recorded every 5 min for the first 6 days of life (Fig. 1). Both the accuracy and safety of the CGM system have previously been validated in neonates. 9 The CGM system was calibrated at least three times a day with a blood sample obtained from radial or umbilical arterial lines, infused with saline solution only. The CGM system was calibrated with the standard point-of-care blood glucose analysis used for clinical management (Cobas b 221 POC; Roche Diagnostics, Germany).

The glucose monitoring sensor inserted into the subcutaneous tissue of the lateral side of the thigh of a 980-gram infant.
The normal range of interstitial glucose concentration was predefined between 70 and 180 mg/dL. The incidence of hyperglycemia (defined as greater than 180 mg/dL) and hypoglycemia (defined below 70 mg/dL) based on sensor interstitial glucose concentration was investigated. Both the data from the CGM system as well as the calibration values were not blinded and were available for clinicians. A uniform nutrition strategy and uniform intervention algorithm for maintenance glucose levels was provided for all patients (Supplementary Table S1; Supplementary Data available online at
Glycemic variability
Glycemic variability was measured by means of EasyGV software, available free for academic or noncommercial use at the
Ethics
The study protocol was approved by the Jagiellonian University Ethics Committee, and written informed consent was obtained from a parent of each infant.
Statistical analysis
Glycemic variability was assessed using arithmetic mean (+/– standard deviation [SD]) for normally distributed data or geometric mean (÷/ × geometric SD [GSD]) after logarithmic transformation for nonnormal, positively skewed data. In addition, two-sided 90% reference intervals according to Clinical and Laboratory Standards Institute (CLSI) guidelines C28-A3 for glycemic variability measurement methods were calculated. To evaluate the strength and direction of correlation between various methods of glycemic variability assessment, Spearman's rank correlation coefficients were calculated.
Test statistics with a probability value (P-value) below 0.05 were considered to be statistically significant and suggested a significant association between t measurements of glycemic variability. MedCalc Statistical Software version 17.4.4 and OriginPro software version 9.1.0 were used for statistical analysis (MedCalc Software bvba, Ostend, Belgium;
Results
Seventy-four patients were enrolled in the study. The baseline demographic and clinical characteristics of the patients are detailed in Table 1. A total of 102,334 glucose measurements were delivered by the CGM system with a median recording time of 119.1 h (range 52.5–164.8 h) per patient. The time spent in the predefined euglycemic range was 94.56%, the average time below 70 mg/dL was 3.14%, and above 180 mg/dL was 2.3%. None of the infants needed insulin infusion.
Data are number (%), mean (SD), or median (IQR)
CRIB II, Clinical Risk Index for Babies score.
SD, standard deviation.
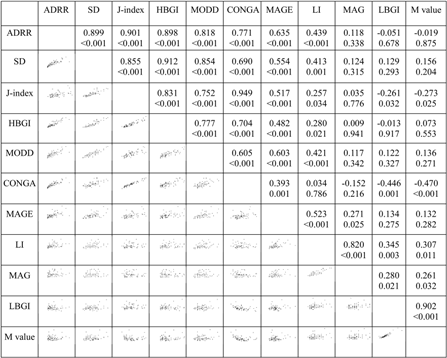
The ranges for each of the methods of glycemic variability assessment were calculated and are presented in Table 2. This shows the arithmetic means and SD or the geometric means and GSD. Spearman's correlation coefficients between the various measures of glycemic variability are shown in Table 3.
The Shapiro–Wilk test for normality was conducted for both glycemic variability assessment data and the log-transformed data. Glucose was measured in mmol/L.
Bold font indicates normally distributed data (arithmetic mean and SD).
Normal font indicates values after logarithmic transformation for nonnormal, positive skewed data (geometric mean and GSD).
EP28-A3C According to guidelines C28-A3 of the CLSI for estimating percentiles and their 90% confidence intervals.
CLSI, Clinical and Laboratory Standards Institute; GSD, geometric standard deviation; SD, standard deviation; CV, coefficient of variation; CONGA, continuous overlapping net glycemic action; J-Index, LI, liability index; MODD, mean of daily differences; MAGE-CGM, mean amplitude of glycemic excursions-continuous glucose monitoring; ADRR, average daily risk ratio; M-value; MAG, mean absolute glucose; LBGI, low blood glucose index, HBGI, high blood glucose index.
Discussion
There is very limited data for glycemic variability in VLBW infants and very little discussion of its role in pathogenesis of diseases connect with prematurity. 6 –8 This study determines the ranges for glycemic variability in a cohort of VLBW infants. In addition, we resolved methodological issues concerning glycemic variability measurements.
Hypoglycemia and hyperglycemia are common metabolic disturbances among preterm infants. However, rapid blood glucose fluctuations have more specific triggering effects on oxidative stress than chronic sustained hyperglycemia alone. 3 Oxidative stress has been shown to be significant in the pathogenesis of numerous neonatal diseases, including periventricular leukomalacia, bronchopulmonary dysplasia, and retinopathy of prematurity. 11
In our study, the interstitial fluid glucose levels in a population of VLBW infants were recorded by a CGM system during the first week of life. Although the CGM system produces the relevant data for analysis of glycemic variability (GV), there is almost no published information on glycemic variability in preterm neonates. 6 –8 Only Galderisi et al. conducted the study that was also based on CGM measurements in VLBW infants. It was designed to investigate if glucose administration guided by CGM is more effective than standard monitoring approach in maintaining euglycemia in VLBW infants. Additionally, they obtained data about GV that correspond closely with our observations in similar group of patients (SD: 21.6 ± 5.4 mg/dL and 22.3 ± 6.6 mg/dL). However, besides SD and coefficient of variation, no other GV indices were calculated.
Tottman et al. 8 and Fendler et al. 7 also described glycemic variability calculations and its impact to VLBW infants' mortality and morbidity. GV calculations were based on intermittent sample glucose measurements. It is difficult to compare variability indices obtained from continuous and intermittent glucose measurements data. Two hundred eighty-eight measurements per day per patient are obtained from continuous monitoring system compared to several per day per patient from intermittent glucose sampling method (e.g., 3–4 per day). Different calculation methods for GV are also available and used for these two observation methods.
The high degree of correlation between the various methods of GV assessment may be related to precise definitions of hypo- and hyperglycemia and good glucose management in the observed population. In the present study, we confirmed that Average Daily Risk Ratio (ADRR), J-index, Mean Of Daily Differences (MODD), Continuous Overlapping Net Glycemic Action (CONGA), and Mean Amplitude of Glycemic Excursions (MAGE) were moderately to strongly correlated with SD, which is consistent with previous reports. 2,12,13
Difficulties remain with proper presentation and analysis of GV data. Normally distributed data of glycemic variability are conveniently summarized by an arithmetic mean plus or minus an arithmetic SD. When glycemic variability measurements have a positively skewed distribution, some of the extremely large values may inflate the arithmetic mean and SD to such a magnitude that they provide unreliable information about the central tendency and range. Moreover, when using arithmetic mean and SD, it is also possible that a lower limit of the reference interval may take an unrealistic negative value.
One solution for positively skewed data is to transform the data to a normal distribution by taking the logarithm of each data point. A logarithmic transformation of both compresses large data values and stretches small values apart, resulting in a more symmetric, bell-shaped distribution. 14 An important issue involving the logarithmic transformation of data is the necessity to use a back-transformation procedure to report results on the original scale. The natural central tendency measure for the log-normally distributed data of glycemic variability assessment is the geometric mean, which is equal to the antilogarithm of the arithmetic mean of the transformed data.
Kirkwood introduced the term GSD for a multiplicative factor describing the extent of statistical variation in a sample of data derived from the log-normal distribution. 15 The relationships of arithmetic and geometric descriptive statistical measures to the parameters of log-normally distributed data were detailed and presented for example by Limpert et al. and Friedrich and Heil. 16 –18 From their work, we can see that when using transformed data, with a geometric mean, we cannot simply add or subtract the GSD. This would result in a symmetrical data range, which is clearly erroneous for positively skewed data such as glycemic variability. 15
Hill et al. estimated the normal reference range for glycemic variability derived from CGM for adults without diabetes in different ethnic groups. 2 They calculated normative value intervals as the geometric mean ± SD in the case of positively skewed data presenting glycemic variability assessment obtained for the following measures: Lability index (LI), HBGI, GRADE, MODD, and ADRR. Although data on glycemic variability is often presented using geometric mean ± SD, this may lead to incorrect estimation of normative ranges where the data are positively skewed. In the present study, we endeavor to solve this problem by fitting the log-normal distribution to the glycemic variability assessment dataset and defining the limits of the normative reference range using geometric mean ÷/ × GSD.
The study had limitations regarding real-time clinical intervention modifying interstitial fluid glucose level. Considering the methodology of the study, a possibility of a measurement error should be considered.
Conclusions
Most glycemic variability indices in VLBW infants showed log-normal distribution. Most of them are moderately or strongly correlated with a SD of glucose concentration. We intend to use this information to investigate the relationship of high glycemic variability with mortality and morbidity in the VLBW population.
Footnotes
Acknowledgments
The study was part of the project supported by grant no RG3/2012/3 “Early glycemic profile and the risk of complications of prematurity” obtained from the Nutricia Foundation.
Author Disclosure Statement
No competing financial interests exist.
References
Supplementary Material
Please find the following supplemental material available below.
For Open Access articles published under a Creative Commons License, all supplemental material carries the same license as the article it is associated with.
For non-Open Access articles published, all supplemental material carries a non-exclusive license, and permission requests for re-use of supplemental material or any part of supplemental material shall be sent directly to the copyright owner as specified in the copyright notice associated with the article.