
Abstract
Background:
Digital interventions may assist patients with type 2 diabetes in improving glycemic control. We aimed to synthesize effect sizes of digital interventions on glycated hemoglobin (HbA1c) levels and to identify effective features of digital interventions targeting patients with poorly controlled type 2 diabetes.
Materials and Methods:
MEDLINE, ISI Web of Science, and PsycINFO were searched for randomized controlled trials (RCTs) comparing the effects of digital interventions with usual care. Two reviewers independently assessed studies for eligibility and determined study quality, using the Cochrane Risk of Bias Assessment Tool. The Behavioral Change Technique Taxonomy V1 (BCTTv1) was used to identify BCTs used in interventions. Mean HbA1c differences were pooled using analysis of covariance to adjust for baseline differences and pre–post correlations. To examine effective intervention features and to evaluate differences in effect sizes across groups, meta-regression and subgroup analyses were performed.
Results:
Twenty-three arms of 21 RCTs were included in the meta-analysis (n = 3787 patients, 52.6% in intervention arms). The mean HbA1c baseline differences ranged from −0.2% to 0.64%. The pooled mean HbA1c change was statistically significant (−0.39 {95% CI: [−0.51 to −0.26]} with substantial heterogeneity [I 2 statistic, 80.8%]) and a significant HbA1c reduction was noted for web-based interventions. A baseline HbA1c level above 7.5%, β = −0.44 (95% CI: [−0.81 to −0.06]), the BCTs “problem solving,” β = −1.30 (95% CI: [−2.05 to −0.54]), and “self-monitoring outcomes of behavior,” β = −1.21 (95% CI: [−1.95 to −0.46]) were significantly associated with reduced HbA1c levels.
Conclusions:
Digital interventions appear effective for reducing HbA1c levels in patients with poorly controlled type 2 diabetes.
Background
I
Type 2 diabetes is a multifactorial metabolic disease linked with obesity, dietary behavior, and a sedentary lifestyle. 5,6 A recent trial conducted in the United Kingdom demonstrated remission to a nondiabetic state after changes in dietary behavior and significant weight loss in persons with type 2 diabetes. 7 Hence, type 2 diabetes has recently been recognized as a potentially reversible metabolic state. 8 However, the likelihood of a remission of the reversed state of the disease is still unclear. In addition, remission is less likely among persons with longer duration of type 2 diabetes. 7,9 Therefore, regular monitoring of blood glucose levels, as well as an optimal adherence to glucose-lowering medications, a healthy diet, and moderate-to-high-intensity physical activity (PA) remain important factors contributing to the prevention of macrovascular and microvascular complications of the disease. 10 –13
Failure to strictly adhere to medication, nutrition, and PA recommendations leads to hyper- and hypoglycemic levels 12,14,15 that worsen quality of life and increase the risk of mortality. 16,17 Ideally, tight glycemic control or maintaining glycated hemoglobin (HbA1c) levels between 5.7% and 6.5% is generally recommended to prevent complications and comorbidities. To help patients achieve tight glycemic control targets of HbA1c levels of 5.7%–6.5%, 18 the American Association of Diabetic Educators (AADE) identified seven self-care behaviors (AADE7). Healthy eating, being physically active, monitoring, taking medication, problem solving, reducing risks, and healthy coping are the listed AADE7 self-care behaviors to guide diabetes education and care. 19 The uptake of these self-care behaviors among patients can be strongly supported with digital interventions, such as text messaging and web-based and telemedicine interventions. 20 –23 By integrating digital technologies, e-health interventions help patients change their behavior toward regular monitoring of blood glucose levels, regular PA, a balanced diet, and other healthy lifestyle behaviors. 23 –29 Hence, diabetes-related behavioral and clinical outcomes can be improved through active engagement in e- and m-health interventions. In general, diabetes care is increasingly incorporating interactive digital e- and m-health interventions because the use of modern information and communication technologies comes with many advantages regarding the self-monitoring of the disease and self-regulation of lifestyle behaviors. 30 –34
HbA1c remains a surrogate marker of diabetes interventions after Stratton et al. demonstrated an independent log linear relationship between HbA1c- and diabetes-related complications. 26 Furthermore, recent reports suggest that interventions leading to a reduction in HbA1c of at least 0.3% among persons with type 2 diabetes are considered clinically significant. 24,29 Clinically significant reductions of HbA1c were achieved from various randomized controlled trials (RCTs) of digital interventions. 33 –37 Findings of several systematic reviews and meta-analyses on the effectiveness of digital interventions have also reported clinically significant HbA1c reductions, with varying level of effectiveness. For example, HbA1c reductions of −0.63%, −0.5%, −0.43% have been documented for videoconferencing, 25 mobile-based interventions, 31 and interactive self-management interventions, 28 respectively.
Meta-analysis results also suggest that the changes in HbA1c levels were different across duration and mode of interventions. 21,32 A review on the effects of health information technology self-management interventions reported an aggregated HbA1c reduction of 0.36% at 6 and 0.27% at 12 months. 21 In another review, all information technology-based interventions led to a reduction of 0.33%. 38 Participation in telemedicine, telecare, teleconsultation, and videoconferencing interventions was associated with HbA1c reductions of 0.31%, 39 0.37%, 40 0.54%, 41 and 0.63%, 25 respectively. Furthermore, meta-analysis results suggest a reduction of HbA1c when participating in interactive self-management interventions by 0.43%, 28 whereas participation in computer-based interventions was only associated with a reduction of 0.2% 32 and mobile-based interventions with a reduction of 0.5%. 31 Two different reviews on the effects of mobile short message services reported an HbA1c level reduction of 0.22% 30 and 0.60%. 42 It can be argued that these HbA1c changes are small 32 but, in the long run, these small changes can help patients attain the target HbA1c level of less than 6.5% and thus prevent the risk of microvascular complications and diabetic-related deaths. 43,44
One limitation of the existing evidence of systematic reviews on the topic is the disregard of the influence of baseline HbA1c, the mean baseline HbA1c difference between control and intervention groups, and the pre–post correlation in the overall estimates of effect sizes for interventions. Results of subgroup and meta-regression analysis indicate that baseline HbA1c is associated with overall pooled effect sizes estimated using meta-analysis. 31,45 Available methodological literature on meta-analysis of a continuous outcome emphasizes the importance of accounting for baseline imbalance and pre–post correlations to determine precise and unbiased effect size estimates of a continuous outcome, such as HbA1c. However, the methodology to account for baseline imbalance and pre–post correlations is complex in the absence of individual participant data (IPD) and necessary summary data from published RCTs. Nevertheless, if relevant summary data are reported in RCTs, it is recommended to use analysis of covariance (ANCOVA) rather than change scores and final value effect size estimators. 46 –49
Importantly, e-health interventions targeting persons with type 2 diabetes are generally multicomponent behavioral interventions and complex in nature. 50 One way to simplify the complexity of reporting and analyzing the effect size of such interventions is by describing the active ingredients of the interventions by using the Behavioral Change Technique Taxonomy V1 (BCTTv1) 51,52 and/or the AADE7 self-care behaviors. 19 The AADE7 self-care behaviors provide an evidence-based framework to identify contents of diabetes self-management interventions. 19 The effectiveness of the active ingredients for reducing HbA1c levels in patients with poorly controlled type 2 diabetes has, to our knowledge, not yet been investigated. The results of our previous scoping review suggested the need for a detailed investigation of the individual and combined effects of BCTs on HbA1c and their role as mediators in Hba1c change. 53 Therefore, this systematic review and meta-analysis aimed to synthesize the effectiveness of digital interventions and identify BCTs associated with reductions of HbA1c levels.
Materials and Methods
The design, conduct, and reporting of this systematic review was guided by the Preferred Reporting Items for Systematic review and Meta-analysis (PRISMA) 2015 guideline. 54 The protocol of this systematic review was registered a priori (PROSPERO Registration No. 42016049940). The full description of the protocol for this systematic review can be accessed elsewhere. 55
Study inclusion criteria
Type of studies
Studies were included if (1) the design of the studies examining intervention effects was an RCT, including multiple arms RCT; (2) patients in the intervention have documented poorly controlled type 2 diabetes defined by an HbA1c level of >7.0%; (3) interventions were technology based, such as m-health (mobile health) interventions, web-based interventions, interventions delivered through the use of a personal digital assistant, a tablet, a computer, the Internet, telemedicine, videoconferencing, telehealth, or other forms of e-health; (4) HbA1c was reported as an outcome; (5) the control group received usual care, standard care, or existing care, and (6) if the study results were published in English. We used the American Diabetes Association (ADA) definition to define poorly controlled type 2 diabetes. Hence, having an HbA1c value of greater than 7.0% was considered poorly controlled type 2 diabetes. 56 Studies examining interventions that targeted either persons with type 1 diabetes or both type 1 and 2, and those including control groups receiving interventions other than usual care, were excluded from the review.
Search strategy for identification of studies
Studies published up to June 30, 2017, were searched in MEDLINE via PubMed, ISI Web of Science via Thomson Reuters, and PsycINFO via OvidSP using a comprehensive search strategy. The search terms suiting the different databases were created in collaboration with a research librarian. MeSH terms, keywords, and Boolean operators were used to develop the search strategy. The search was first completed in June 7, 2016, and updated on June 30, 2017.
Article screening
Two authors (M.M.K. and M.P.) screened titles and abstracts, as well as full-texts independently. If the two authors could not reach consensus, a third author (C.R.P.) was consulted to resolve disagreement. Covidence, a web-based screening tool, was used to document the screening process. 57 Information regarding the search and screening process is displayed in Figure 1.
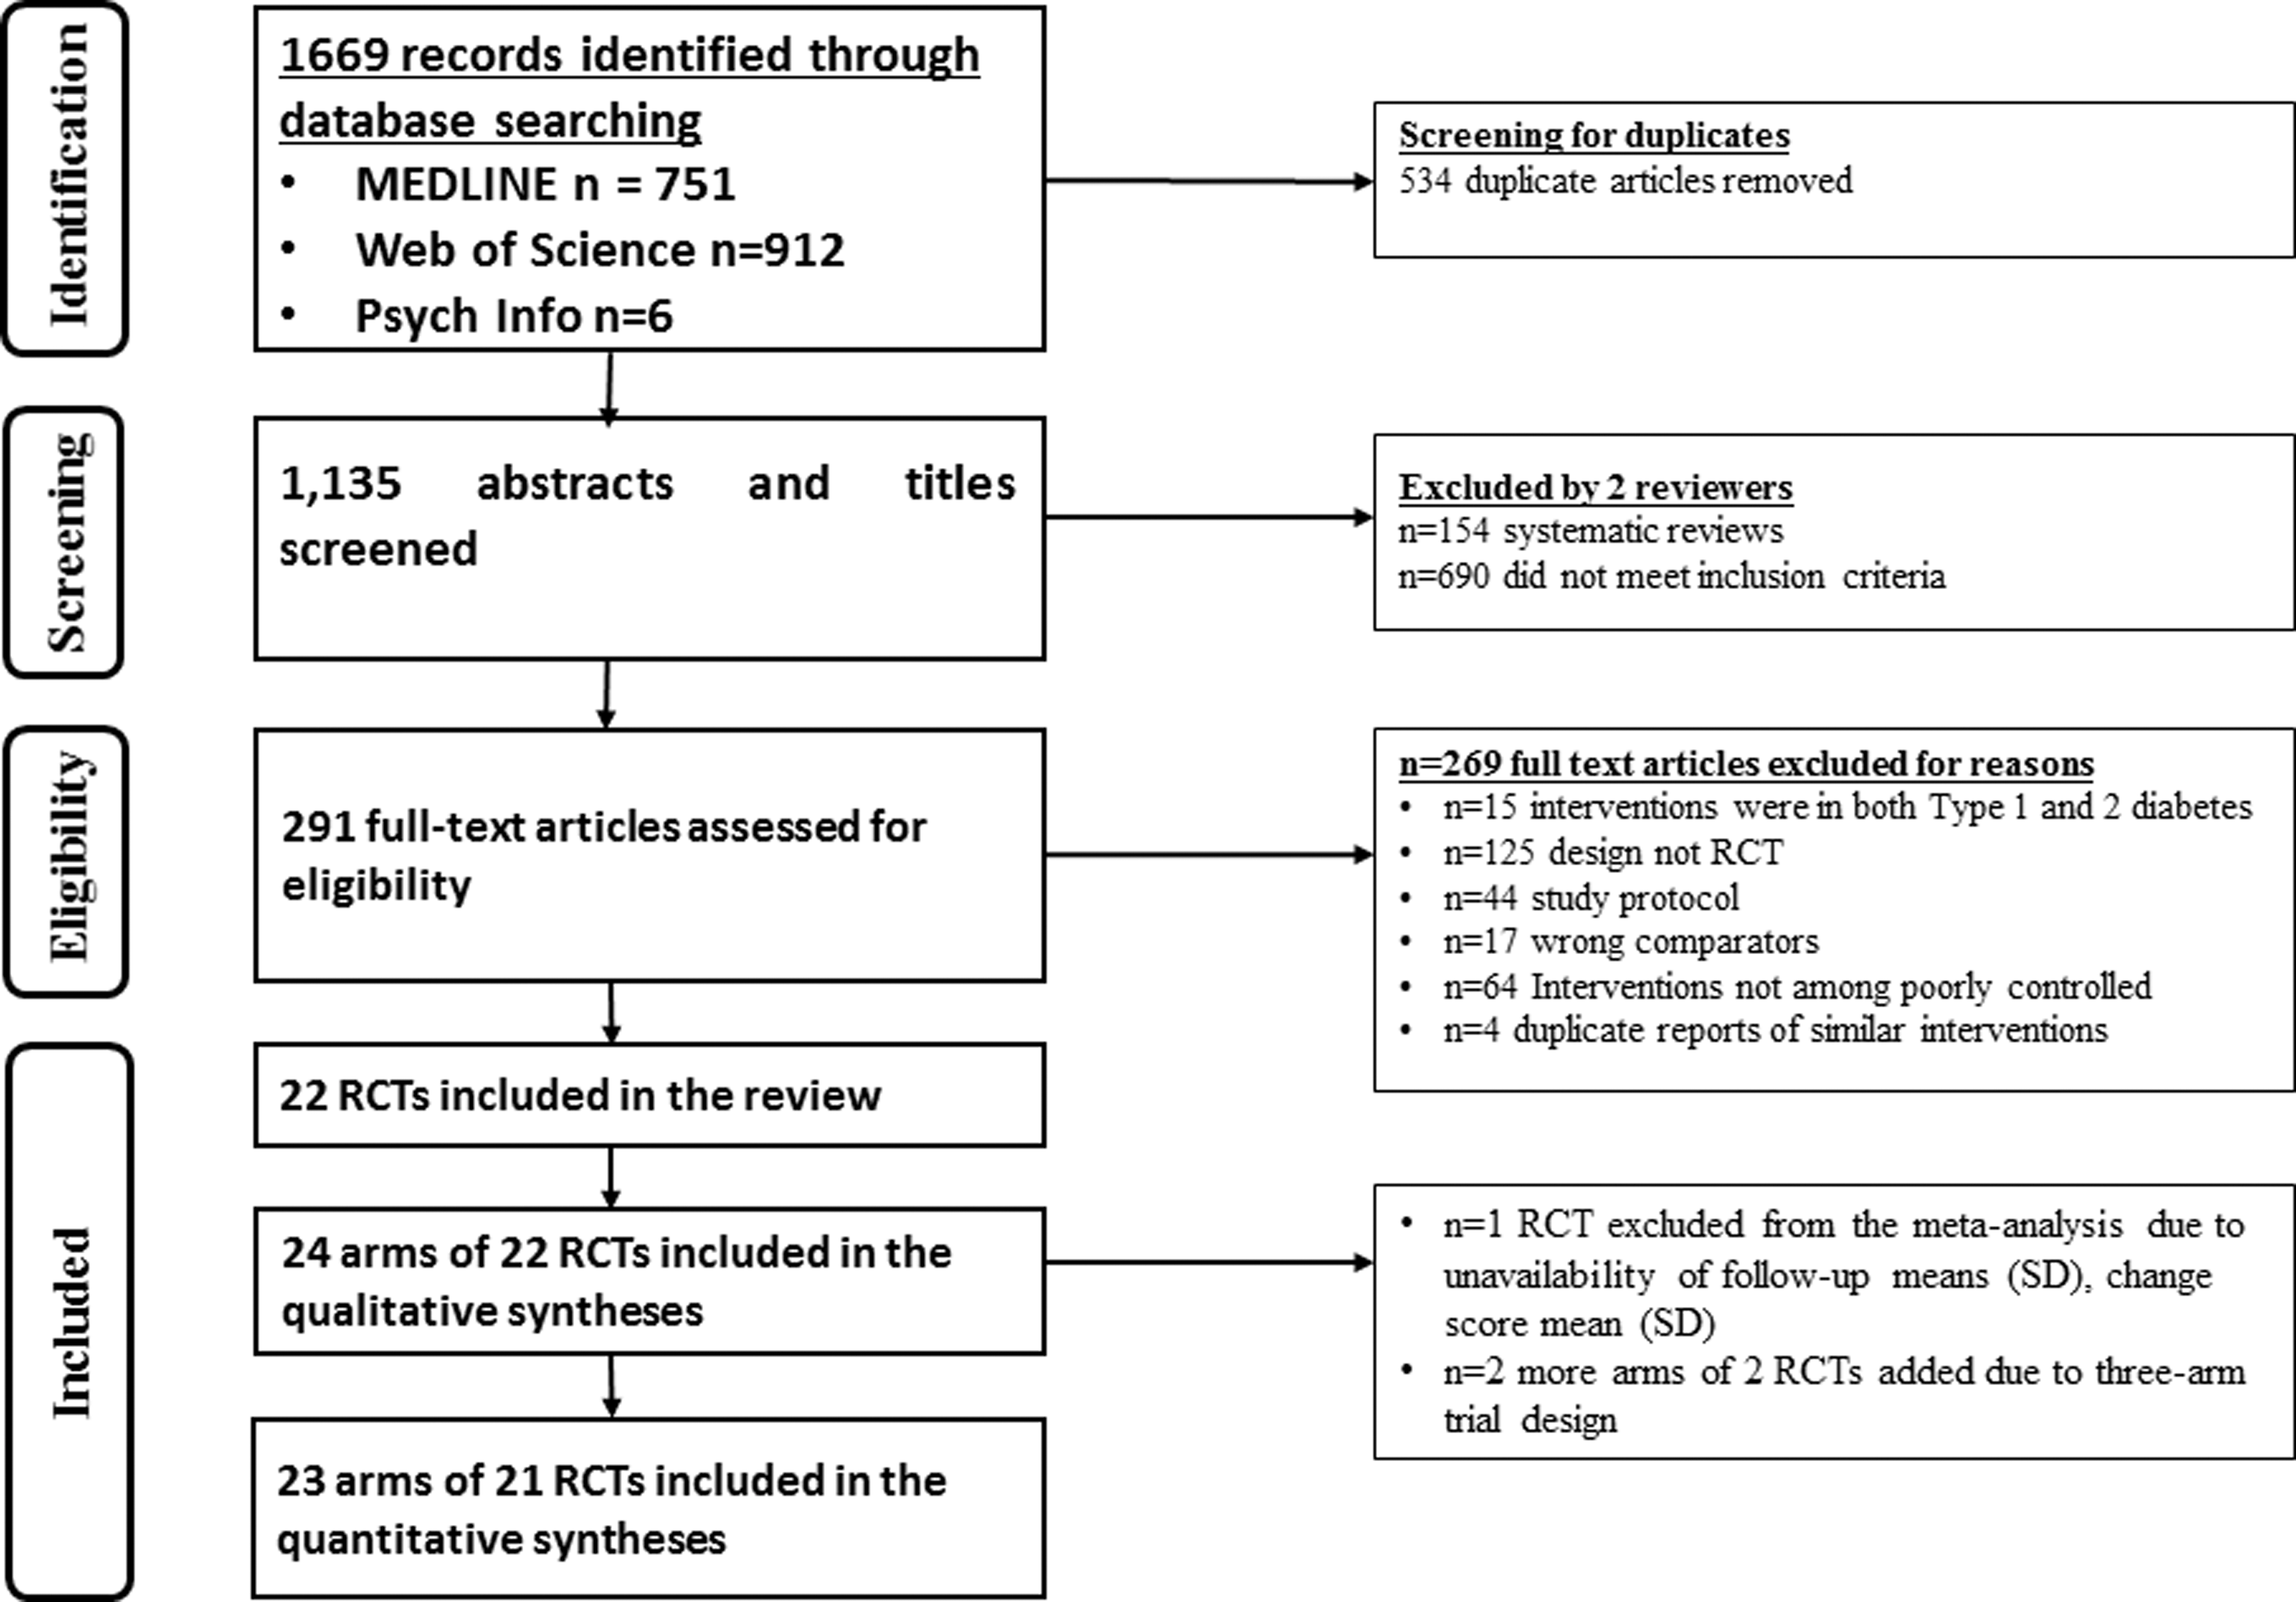
Preferred reporting items for systematic reviews and meta-analyses flowchart for database search and study selection.
Data extraction process
Two authors extracted the following information: citation information (authors, titles, journals, year of publication), study location, study population (ethnicity, sex, age), study objectives, intervention type and delivery mode, AADE7 self-care behavior targeted, inclusion criteria, information on whether the intervention was guided by the use of behavioral science models or theories, individualization or tailoring of the interventions, and BCTs included in interventions. Moreover, sample size, intervention period, HbA1c values, and respective standard deviations (SDs), P-values, and 95% confidence intervals (CIs) were extracted for each study. The mean HbA1c change scores (SD), mean HbA1c difference (SD), type of statistical test (e.g., t-test, z-test), and data on intention-to-treat analysis (ITT) were collected for each study. If not reported in the articles, mean HbA1c change scores for both, control and intervention groups, were calculated for a particular time point (3, 4, 6, 8, 9, and 12 months). Based on the full description of the interventions in the articles reporting the study results or in study protocols, BCTs were identified and coded using the BCTTv1. 58
Two authors (M.M.K. and T.L.H.) read the description of the interventions to collect data about the seven AADE7 self-care behaviors addressed in each intervention. Two reviewers (M.M.K. and C.R.P.) experienced in using the BCTTv1 58 coded the description of intervention contents independently and meetings were held to reach consensus on which BCTs were coded for each individual intervention.
Quality assessment
The Cochrane Risk of Bias Assessment Tool for randomized control trials 59 was used to assess the quality of the included studies. Two authors (M.M.K. and M.P.) independently assessed the risk of bias, resolving differences with consensus. Covidence was used to semi-automate the process. 57 Using this tool, seven domains of risk of bias can be identified: allocation concealment, sequence generation, blinding of participants and personnel, blinding of outcome assessors, incomplete outcome data, selective outcome reporting, and other sources of bias. The terms low, high, or unclear risk of bias were used to label the quality of studies for each domain. The seventh domain, “other sources of bias,” was assessed following the recommendation by Fu et al. Hence, baseline balance of HbA1c levels between control and intervention groups, information on loss to follow-up, retention and attrition rates, and reported competing interests were considered. 46 Finally, the consensus quality ratings were exported to RevMan 60 to receive the final graphical representation of all risk of bias ratings.
Missing data
Missing data were obtained by contacting corresponding authors or computed based on the reported data. Using Excel functions, SD values, which were initially not reported for some of the studies, were calculated based on the reported 95% CIs, standard error (SE), or P-values. 46,61 Contacting corresponding author and computing missing SD values with reported data did not work for a study by Wakefield et al. 62 Therefore, this missing SD value was imputed using arithmetic means by following an existing methodological guideline. 46 For one study, 63 the mean and SD values were calculated based on the reported median and range using Hozo's formula. 64 The pre–post correlation values, both for control and intervention groups, were calculated based on formulas described in previous methodological studies and formulas by Fu et al. 46 and Morris and DeShon. 48
Data syntheses and analysis
Simple analysis of final values, simple analysis of change scores, and ANCOVA effect size estimator are the main methods used to calculate effect sizes of a continuous outcome with a similar scale of measurement.
46
–49
Methodological guidelines show that adjusting for baseline imbalance and pre–post correlation is important in meta-analyzing continuous outcomes. The baseline HbA1c differences in the studies included in our review ranged from 0% to 0.64%, with only two RCTs having a mean HbA1 difference of 0%.
36,65
Assuming publication bias is negligible, meta-analysis of the baseline differences should be close to zero if the two treatment groups are balanced.
46
In our case, meta-analysis of baseline HbA1c mean difference was 0.14% (95% CI: −0.31 to 0.59). In addition, pre–post correlation ranged from 0.06
37
to 0.74.
66
For this reason, accounting for baseline imbalance and pre–post correlation was essential. In this review, the ANCOVA effect size estimator was preferred because it helps to adjust for baseline imbalance and pre–post correlations.
46
–49
Therefore, the effect size estimates were computed using the “black-belt” ANCOVA approach using the following equation:
Meta-analyses
Stata version 13 statistical software was used to perform the meta-analyses. The outcome data reported at study closure were used to perform the overall meta-analysis. HbA1c reductions of at least 0.3% were labeled as clinically significant. 24,29,67 For studies reporting the results of RCTs with three or more arms, relevant arms were considered in the pooled analysis if they were deemed combinable.
Following Cochrane recommendations, observed statistical heterogeneity was assessed with the Cochrane's χ 2 -test (a P-value of less than 0.1 indicates statistically significant heterogeneity) and quantified by using I 2. With I 2 value of ≥50%, a random-effects model was used, else a fixed-effects model. 68
Sensitivity analyses were performed by excluding studies judged as having a “high risk” of bias for more than three dimensions of the risk of bias assessment tool. Several subgroup analyses were performed to estimate the effects of various intervention features (e.g., tailoring, mode of intervention, and BCTs included). The differences across subgroups were assessed using the random-effects model.
A series of univariate meta-regression analyses were performed by regressing intervention effect sizes across studies on intervention features (i.e., duration of intervention, mode of delivery, theory based, tailoring, baseline HbA1c inclusion criterion [HbA1c >7.0% vs. >7.5%], type of BCT [present or absent], and total number of BCTs included in the interventions). Then, multivariate meta-regression analyses were performed to identify effective BCTs and intervention features associated with HbA1c level. Following the recommendation by Borenstein et al., 69 BCTs were added in the subgroup and meta-regression analyses if they were included in at least two studies.
Visual inspection of contour funnel plot was used to detect publication bias. In addition, Egger's test using a P-value of less than 0.1 was conducted to assess publication bias. 70 If publication bias was suspected, the “trim and fill” imputation method was used to estimate the number of missing studies in the funnel plot. 71 Finally, the quality of evidence generated through meta-analysis was classified as high, moderate, and low using the GRADE approach. 72,73 The GRADEpro online tool was used to systematically evaluate the synthesized evidence. 74
Results
Study selection and characteristics
In the database search, 1669 titles and abstracts were retrieved, with only 22 studies fulfilling the inclusion criteria. 35 –37,62,63,65,66,75 –89 Two studies 66,80 were three-arm RCTs, and 20 of them were two-arm RCTs. Because of this, 24 arms of 22 RCTs were considered in the meta-analysis. However, one RCT 76 had most of the required data missing, and hence excluded from the quantitative syntheses. Finally, 23 arms of the 21 RCTs were used in the meta-analyses (Fig. 1).
Studies were published between the years 2009 and 2017, with the majority conducted in the United States (n = 9). A total of 3787 subjects were included in the 23 arms of the 21 RCTs and followed for a mean duration of 7.29 months (SD = 3.05). One thousand nine hundred ninety-one (52.6%) participants were assigned to the intervention arms. The mean number of participants randomized into control and intervention groups was 82.6 (SD = 62.7) and 83.9 (SD = 62.12), respectively. On average, treatment retention rate at study closure was 89.4% (SD = 9.97, range = 25%, min. = 75% to max. = 100%).
Nearly two-thirds of interventions (n = 15; 65.22%) were web based delivered via smartphones, tablets, PDA, and computers. Five interventions implemented telehealth (21.74%) and three (13.04%) text messaging. Eleven of the 21 RCTs (52.4%) targeted patients with baseline HbA1c values greater than 7.5%, while the rest were targeted patients having an HbA1c level of greater than 7.0%.
Quality of studies
Less than half of the included studies described ITT with 12 studies not stating ITT procedures. Only one study was judged as having a low risk of bias on all of the risk of bias assessment dimensions. 89 Four studies (18.2%) were judged as having a high risk of bias on three of seven dimensions. 76,78,82,84 Eighteen (81.2%) studies adequately described the randomization procedure and were judged as having a low risk of bias with regard to this dimension. 35 –37,62,63,65,66,75 –81,83,85,86,89 Seven studies (31.2%) did not adequately describe how the allocation was performed and were unclear for judgment (Fig. 2). 63,65,77,82,86 –88
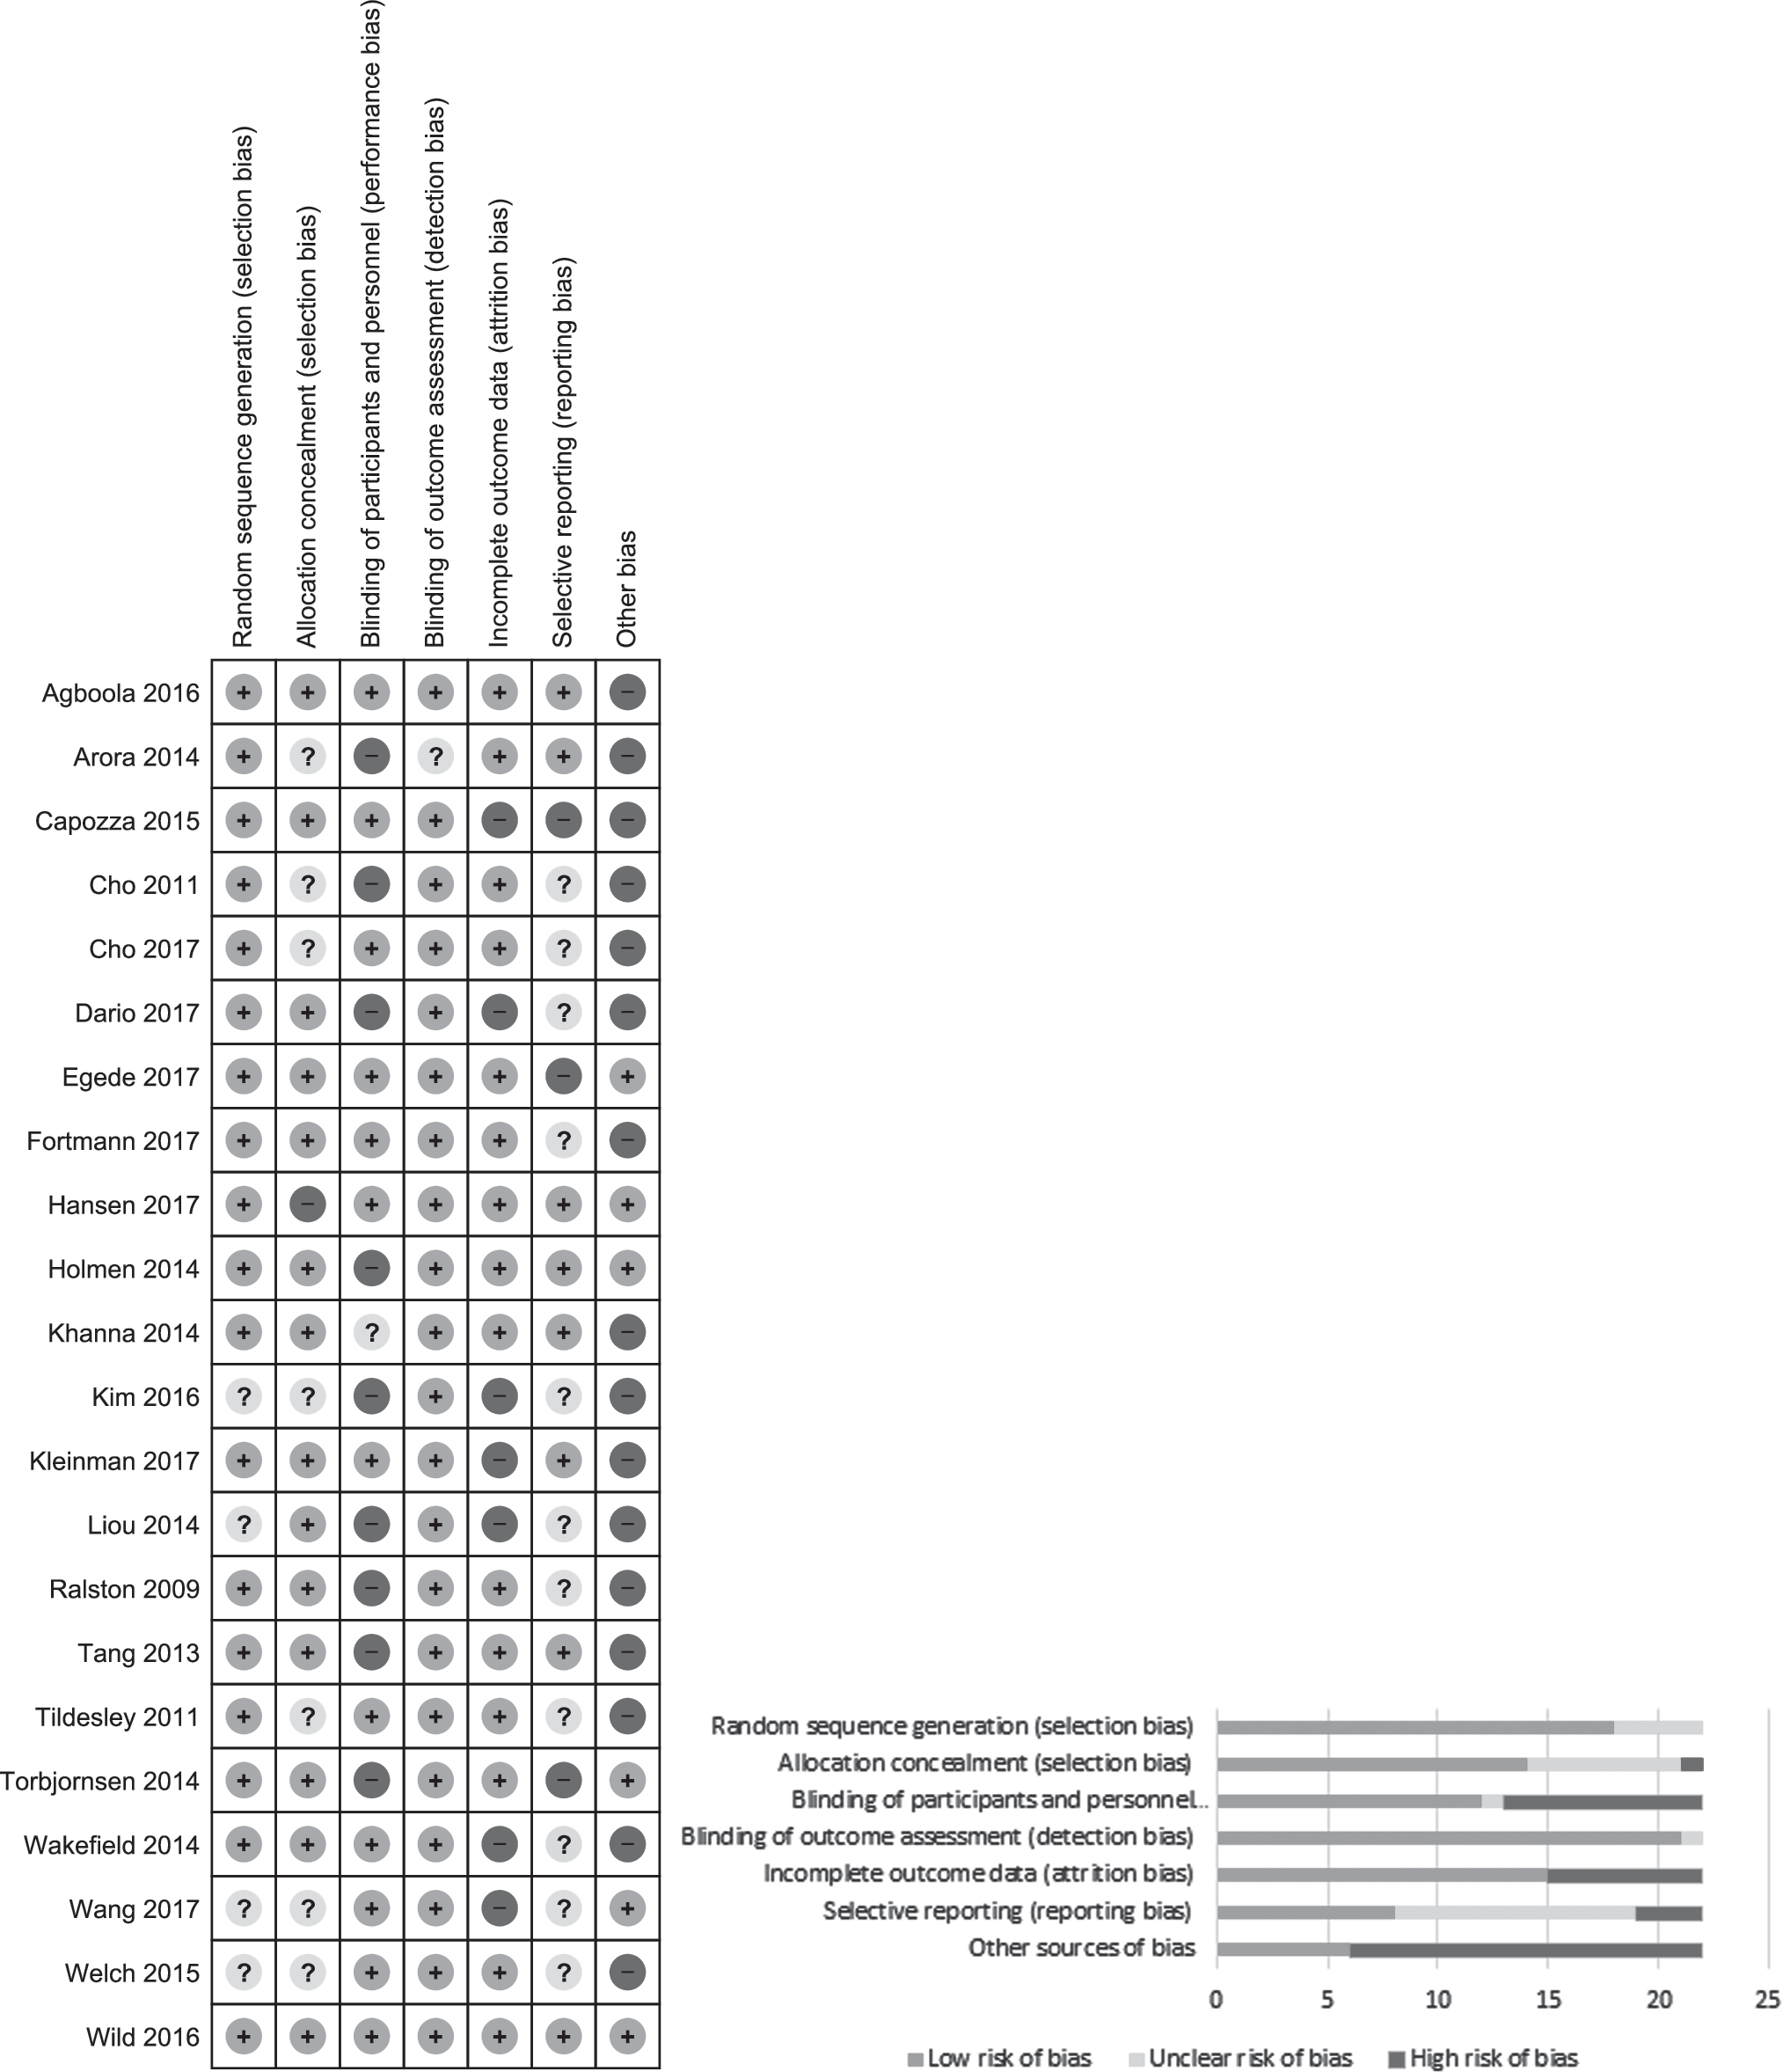
Risk of bias assessment of individual studies and aggregated summary.
Regarding intervention-related adverse events, only eight studies 36,37,62,66,77,80,85,89 reported that adverse events were assessed. All of these studies reported that there were no intervention-related adverse events. One study reported two deaths but not due to intervention participation 66 and one reported trouble among intervention participants with regard to using the digital devices or connecting with Bluetooth. 80
Only seven interventions were designed following behavioral health theories. The theories used were the “health belief model,” 75,83 the “trans-theoretical model of behavioral change,” 75 the “health action process approach,” the “theory of planned behavior,” and the “Bandura's theory of self-efficacy.” 83 In addition, “Green and Kreuter's PRECEDE-PROCEED model,” 81 “cognitive behavioral therapy,” the “Reach Out” problem-solving model, and “motivational interviewing” 66,80 were used to guide intervention design. Seventeen interventions 36,37,62,65,66,77 –83,85 –89 were tailored according to individual patient characteristics (Table 1).
Characteristics of Included Studies
FTA-HC, Few Touch Application health counseling; HbA1c, glycated hemoglobin; IBGMS, Internet-based glucose monitoring system; m-health, mobile health; MI, motivational interviewing.
AADE7 self-care behaviors targeted in the interventions
Inter-rater agreement determined by using Cohen's kappa and prevalence adjusted bias kappa (PABAK) was 0.6 and 0.8, respectively, suggesting a high reliability. A mean of 4 (SD = 1.74, range 1–7) AADE7 self-care behaviors were addressed in interventions. Of the seven AADE7 self-care behaviors, “monitoring” was the most frequently included (in 21 of 24 intervention arms) followed by “healthy eating” and “taking medication,” which were addressed 16 and 15 times, respectively. However, “healthy coping” was included in only nine intervention arms.
Of the 22 interventions included in this review, only one intervention addressed seven of the AADE7 self-care behaviors. 88 Four interventions targeted six self-care behaviors each (Table 1). 65,76,77,85
BCTs used in e-health interventions targeting persons with poorly controlled type 2 diabetes
Inter-rater agreement determined by using percent agreement was 96.5% and PABAK was 0.93, suggesting a very good agreement. A total of 27 BCTs with a minimum of 4
36,84,89
and a maximum of 11 BCTs
75
were addressed in interventions. Of the 27 BCTs, “instruction how to perform behavior” was used most frequently, included in 21 intervention arms.
35
–37,62,63,65,66,75
–77,79
–82,84
–86,88,89
Eight BCTs were included only once. None of the intervention arms had a similar combination of BCTs (Supplementary Table S1, available online at
Impact of interventions in terms of reducing HbA1c
The pooled mean HbA1c difference suggests a statistically significant HbA1c reduction, −0.39 (95% CI: −0.51 to −0.26), favoring digital intervention groups. However, heterogeneity was high (I 2 statistic: 80.8%).
Publication bias
Visual inspection of the contour funnel plot shows that the majority of the effect sizes of the interventions are in the significant region as well as in the upper left part of the plot, suggesting the predominance of published significant findings. Only one study falls on the nonsignificant region (P > 0.5) of the contour-enhanced funnel plot (Supplementary Fig. S1). This asymmetry of the plot might possibly be due to either the presence of publication bias or due to factors other than publication bias. To confirm this, Egger's test and then “trim and fill” test were performed. Egger's test indicated that there is not enough evidence of small-study effects (coefficient = −1.13, P = 0.182). Performing the “trim and fill” test also did not result in changes in the pooled effect size estimate. Therefore, both Egger's and the “trim and fill” tests indicated that the influence of publication bias is negligible.
Sensitivity analyses
Sensitivity analyses were conducted excluding four studies judged as having a “high risk” of bias in more than three dimensions of the risk of bias assessment. The pooled HbA1c MD and heterogeneity I 2 statistics were not substantially changed, resulting in a pooled HbA1c MD of −0.38% (95% CI: [−0.51 to −0.24]) and I 2 of 77.9%. However, removing eight studies having a “high” and an “unclear” risk of bias for allocation concealment resulted in a lower effect size estimate, −0.30% (95% CI: [−0.45 to −0.15]). I 2 statistic was also lowered to 68.4%. Further sensitivity analysis conducted by removing the four studies with inadequate description of randomization yielded a lower effect size estimate, −0.29% (95% CI: −0.41 to −0.17).
Subgroup analyses by intervention features and BCTs
The pooled mean HbA1c difference was −0.52% (95% CI: [−1.04 to 0.00]), −0.41% (95% CI: −0.55 to −0.27), −0.21% (95% CI: [−0.65 to 0.22]) for text message-delivered, web-based, and telehealth interventions, respectively. Statistically significant pooled HbA1c reductions favoring the intervention group were only noted for web-based interventions. However, there was substantial statistical heterogeneity across the three intervention subgroups (Fig. 3).
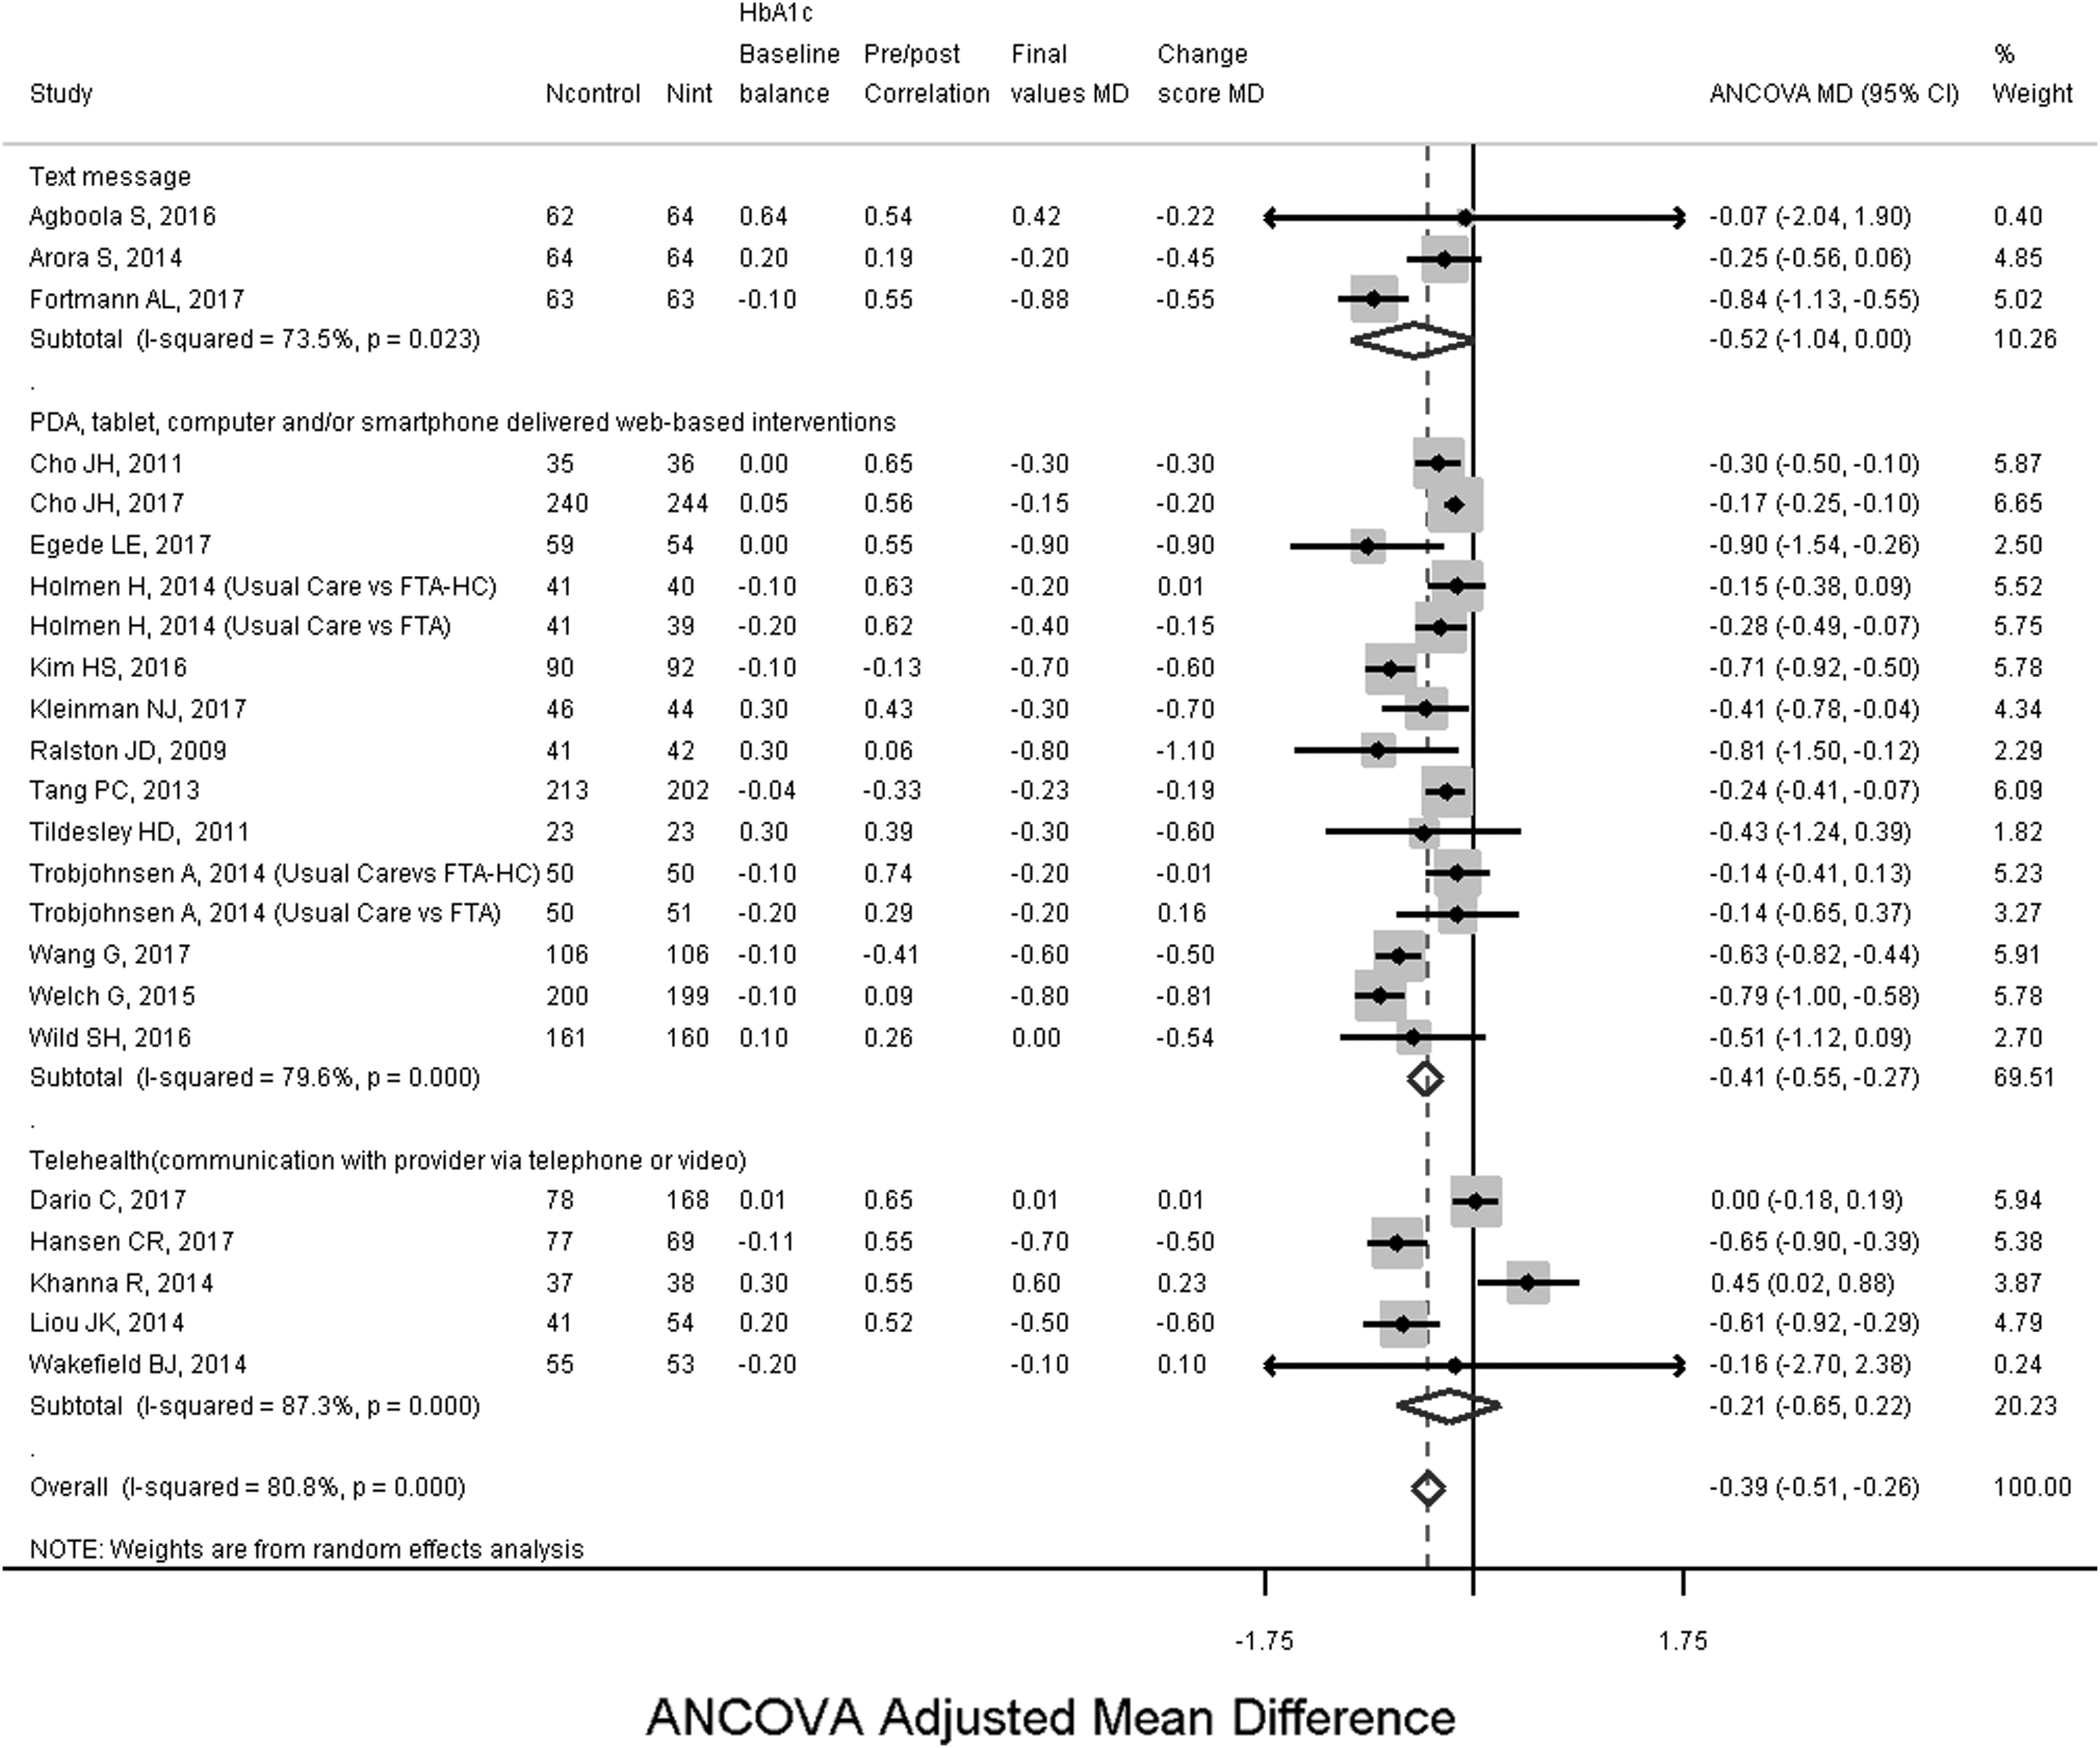
Subgroup analysis of the effectiveness of digital interventions for reducing HbA1c-levels by mode of delivery. HbA1c, glycated hemoglobin.
A subgroup analysis on the duration of interventions yielded an ANCOVA-adjusted mean HbA1c difference of −0.30 (95% CI: −0.495 to −0.11), −0.59 (95% CI: −0.78 to −0.39), and −0.21 (95% CI: −0.35 to −0.075) for interventions having outcome endpoints after 3–4, 6–8, and 9–12 months, respectively. However, there was substantial heterogeneity in the 3–4 months (I 2 = 89%) and 6–8 months (I 2 = 85%) subgroups (Supplementary Fig. S2).
Additional subgroup analysis was performed to investigate the differences in mean HbA1c reduction for interventions that “included” versus “did not include” a specific BCT. Hence, we noted HbA1c mean differences favoring the intervention group for the presence of the following BCTs: “information about health consequences” (−0.77%), “instruction on how to perform behavior” (−0.35%), “self-monitoring of behavior” (−0.27%), “self-monitoring outcomes of behavior” (−0.15%), “adding objects to the environment” (−0.13%), and “feedback on outcomes of behavior” (−0.12%). However, as can be seen above, only two BCTs led to clinically significant HbA1c changes (delta > −0.3%) (Supplementary Table S2 available at
Furthermore, subgroup analysis on the effect size differences shows that interventions implemented among patients with HbA1c levels of greater than 7.5% led to higher reductions (delta = −0.12%) of HbA1c levels relative to interventions among patients with HbA1c of greater than 7.0% (Supplementary Table S3).
Subgroup analysis on the baseline HbA1c inclusion criteria resulted in relatively bigger effect size for interventions targeting patients with HbA1c levels greater than 7.5% (i.e., −0.45% {95% CI: [−0.70 to −0.21]} vs. −0.33% {95% CI: [−0.478 to −0.18]}) (Supplementary Fig. S3 available at
Identifying intervention features and BCTs associated with HbA1c reductions
The univariate meta-regression analysis, obtained by regressing the effect sizes of interventions on intervention features indicated that none of the features, except for duration of interventions, was significant. Interventions with 3- to 4-month duration (β = 0.42, P = 0.016, tau2 = 0.085, R 2 = 21.7%) and a 6- to 8-month duration (β = −0.29, P = 0.03, tau2 = 0.089, R 2 = 17.7%) displayed significant associations with the effect size indicating that 6–8 months of intervention duration resulted in a pronounced reduction of HbA1c levels. Only two BCTs, “feedback on behavior” (β = 0.29, P = 0.037, tau2 = 0.092, R 2 = 15.4%) and “social support practical” (β = 0.42, P = 0.016, tau2 = 0.0085, R 2 = 21.6%), were significantly associated with the effect size. Because the β coefficients were positive, the use of these BCTs did not demonstrate HbA1c reductions.
Multivariable meta-regression revealed that the presence/absence of nine BCTs and other intervention features in the model explained 79.8% of the variance in the effect size. Tailoring the interventions, β = 1.15 (95% CI: [0.14 to 2.17]), baseline HbA1c higher than 7.5, β = −0.44 (95% CI: [−0.81 to −0.06]), and the presence or absence of four BCTs were significantly associated with HbA1c levels. Hence, the BCTs “problem solving” (β = −1.30; 95% CI: [−2.05 to −0.54]), “feedback on outcomes of behavior” (β = 0.68; 95% CI: [0.08 to 1.28]), “self-monitoring outcomes of behavior” (β = −1.21; 95% CI: −1.95 to −0.46), and “prompts/cues” (β = 0.44; 95% CI: [0.03 to 0.85]) were significantly associated with the HbA1c levels. Of these, baseline HbA1c higher than 7.5%, “problem solving,” and “self-monitoring outcomes of behavior” were associated with reduced HbA1c-levels (Table 2).
Multivariable Meta-regression Model of Intervention Features and BCTs
Number of studies included in the model = 23, estimate of between-study variance tau2 = 0.022, adjusted R 2 = 79.83, I 2 = 97.76%, Joint test for all covariates F(17.5) = 5.34, P = 0.037.
Statistically significant at a P-value of 0.05.
ANCOVA, analysis of covariance; BCT, behavior change technique.
Grading the quality of evidence generated from the meta-analyses
Applying the GRADE principles,
74
the quality of evidence generated through this meta-analysis can be considered “moderate quality” (Supplementary Tables S4 and S5 available at
Discussion
This systematic review is the first to demonstrate the effectiveness of digital interventions for reducing HbA1c levels in patients with poorly controlled type 2 diabetes. It is also the first review to account for baseline imbalance and pre–post correlations using an available robust statistical method, ANCOVA. The review also used a reliable taxonomy 52 to identify effective BCTs used in digital interventions targeting persons with type 2 diabetes, as well as the well-established AADE7 19 to unravel the effects of intervention components on HbA1c levels. These tools offer a great opportunity to handle heterogeneity across multicomponent and complex interventions. 51,53,90
In this review, we report clinically and statistically significant effects of PDA-, mobile phone-, or computer-delivered web-based interventions on HbA1c. A clinically significant HbA1c reduction is associated with lower rates of deaths, myocardial infractions, and reduced microvascular complications. 24
Similar to our results, clinically and statistically significant pooled HbA1c reductions were reported for Internet-based interactive self-management interventions 28 and mobile phone-based Internet interventions. 31 Our findings thus support the previously reported evidence on beneficial effects of web-based interventions. 38 However, we could not show a statistical significant reduction of HbA1c levels after participation in text message and telehealth interventions. Contrary to our findings, previous results of meta-analyses reported significant HbA1c reductions after participation in telehealth 39,41 and text message interventions. 42 This may possibly be due to the number of telehealth and text message interventions included in our meta-analyses, which was relatively low.
Sensitivity analyses performed by removing studies with a high risk of bias for more than three dimensions suggest that there was no change in the direction of the overall effect estimate. However, the two additional meta-analyses performed after dropping studies with an inadequate description of randomization and a high or unclear risk of bias regarding allocation concealment resulted in a lower effect size estimate. This supports the finding that studies with inadequate or unclear allocation concealment may report inflated treatment effect estimates. 91,92
Results of the subgroup analyses by duration of intervention suggest higher effect size estimates for longer intervention periods. This is likely due to the fact that it takes time for behavioral interventions to change patterns of thoughts and feelings toward behavior change and behavior itself, in turn leading to a change in HbA1c. Yet, the effect size estimate decreased 9–12 months into the intervention. This is in line with other recent meta-analysis results that reported similar effects of digital interventions on HbA1c reduction by duration. 21,28,67 However, a review by Cradock et al. reported a higher HbA1c reduction at month 3 compared with month 6 during the intervention period. 67 It should be noted though that only a small number of studies (four) were included and that baseline HbA1c levels were not taken into account in the subgroup analyses performed by Cradock et al. 67 Previous literature also suggests that more pronounced reductions of HbA1c occur among patients with higher HbA1c levels at the beginning of the intervention. 31,45,93 This was confirmed in both our subgroup and meta-regression analyses. Patients with an HbA1c level greater than 7.5% displayed higher effect estimates. Clinically, this supports the usefulness of digital interventions, particularly among patients with poor initial glycemic control.
Only interventions addressing the following two BCTs, “information about health consequences” and “instruction on how to perform behavior,” led to clinically significant HbA1c changes in patients with poorly controlled type 2 diabetes. Cradock et al. also reported a clinically significant effect of using the BCT “instruction on how to perform behavior,” 67 as did another meta-analysis reported by Avery et al. 94 Future meta-analyses, including more studies and larger study populations as well as concise intervention descriptions, are needed to validate these findings.
The results of the multivariable meta-regression analysis indicate that nine BCTs, as well as additional intervention features in the model, explained more than three-fourths of the variance in the effect size. Baseline HbA1c above 7.5% and the presence of the two BCTs “problem solving” and “self-monitoring outcomes of behavior” were associated with significant reductions in HbA1c levels. Contrary to the results of a meta-analysis by Kassavou and Sutton, our results suggest that interventions using the BCT “problem solving” had a higher beneficial pooled effect. 95 It is known that meta-regression models provide robust results when a greater number of studies and fewer covariates are taken into account. 96 Future meta-regression analyses therefore ought to pool a larger number of trials to develop relatively stable and precise meta-regression results.
Although tailoring the interventions and “feedback on outcomes of behavior” were significantly associated, these associations were inverse, which indicates that the presence of tailoring and this BCT do not lead to reductions in HbA1c levels. A systematic review of reviews by Greenwood et al. reported interventions with two-way communication, patient-generated data tracking and analysis, tailored education and individualized feedbacks were most effective. 90 There was also no evidence of an association between HbA1c levels and the use of theories for designing interventions. Although the use of theories ideally offers scientific explanations of the process of change and is helpful for linking observed changes in outcomes with active intervention ingredients, the existing evidence regarding the benefits of theory use for intervention development is mixed. 97
Our results did not suggest an association between the number of BCTs addressed in interventions and changes in HbA1c. In contrast, two previous systematic reviews demonstrated an association between a greater number of BCTs included in behavioral and self-management interventions and reductions in HbA1c levels. 67,94 The substantial variation in the breadth and depth of BCT descriptions included in the articles could partially explain this finding. Greater quality of intervention descriptions enhances reliability and validity of characterization of the multicomponent interventions and improves reliability and the power of results. 53,98
Limitations
The study has several limitations. Our search was limited to three main databases. However, during the preliminary search, we did not observe major differences in search results when using EMBASE, CINAHL and Cochrane library. Therefore, we concluded that our search in PubMed, ISI Web of Science, and PsycINFO covered the relevant articles. We also did not search in unindexed databases and gray literature.
Previous research suggests that each additional intervention increases the unspecific “attention factor” for patients. Testing a digital intervention against a standard care might therefore overestimate the specific effect of digital interventions, since the “attention factor” is not well controlled. In addition, higher dropout rates were reported from previous digital interventions. This might be due to self-selection indicating that people who like digital media stay in the interventions and people who have difficulties with digital interventions may drop out from the study, leading to overestimation of the results. However, in this review, a high retention rate was observed from individual studies.
Mapping and differentiating the intervention content to determine which BCTs were addressed in interventions rely on the quality and depth of descriptions available for various interventions. 99 In addition, it is based on a subjective judgment. We tried to minimize this limitation by taking online training in using the BCTTv1, applying consensus ratings, and using a third experienced reviewer to resolve any disagreement.
Two studies 33,34 that passed our inclusion criteria were not included in the meta-analysis. This is mainly because of two limitations related to methodology and missing values. Because the design of these studies was cluster RCT, the effect sizes and SEs were needed to be adjusted for design effect by considering intracluster correlation (ICC). This analysis is more complicated when cluster RCTs have high baseline imbalance and did not report ICC. Hence, application of ANCOVA was not feasible for these two studies. We considered change scores or final values as alternatives. However, SD for change scores in each intervention endpoint (3, 6, 9, and 12 months) for both control and intervention groups were not available from the two trials. For this reason, we did not include these studies in our meta-analysis. We suggest future interventions to report details of summary data. Future research is needed on methodological guideline for handling continuous outcomes from cluster RCTs with a high baseline imbalance.
Conclusions
In conclusion, the results of this systematic review and meta-analysis indicate that participation in digital interventions, particularly web-based interventions, favorably influences HbA1c levels among patients with poorly controlled type 2 diabetes. Intervention effects were more pronounced among patients with higher baseline HbA1c levels and greater effects were observed 6–8 months into an intervention. Moreover, the results of the meta-regression analyses suggest that baseline HbA1c >7.5% and the two BCTs “problem solving” and “self-monitoring outcomes of behavior” were associated with a reduction of HbA1c levels. Hence, considering these two BCTs in future interventions may lead to clinically meaningful reductions in HbA1c.
The effort to adjust for baseline imbalance and pre–post correlation relies on the level of detail of reporting available for individual studies. We suggest to authors of future intervention studies, particularly with baseline imbalance, to report detailed information that allows authors of systematic reviews to calculate ANCOVA effect size estimates or, ideally, to provide access to IPD.
Footnotes
Acknowledgments
We are grateful to Professor Richard D. Riley, Dr. Jochen Wilhelm, Dr. James E. Pustejovsky, Professor Vanessa Didelez, and Dr. Fleur Fritz for the methodological support provided particularly to the first author. We also acknowledge our research librarian, Lara Christianson, for her support in developing the search strategy. In addition, we are very grateful to all authors of the studies included in this meta-analysis particularly to Caroline R. Hansen, Sarah Wild, Richard Parker, Nora Kleinman, Professor Leonard Egede, Dr. Addie Fortmann, Heidi Holmen, Dr. James Ralston, Dr. Raman Khanna, and Elisa Visentin for providing us with the data we requested and simplifying our effort in handling the missing data.
Availability of Data
The data collected for this study are available from the corresponding author and can be received on request.
Authors' Contributions
M.M.K. conceptualized and designed the study, conducted the systematic literature search with the help of research librarian, performed the title and abstract screening, quality assessment, data extraction, data analysis and interpretation of the data, and wrote the article.
H.Z. participated in the conception and the design of the study and the development of the methodology, and critically revised the article for important intellectual content.
M.P. conducted the title and abstract screening, quality assessment, and participated in the draft of the article.
T.L.H. contributed to the extraction of the data and critically revised the article.
C.R.P. participated in the conception, data extraction, and critically revised the article for important intellectual content.
All authors read and approved the final version of the article.
Author Disclosure Statement
No competing financial interests exist.
References
Supplementary Material
Please find the following supplemental material available below.
For Open Access articles published under a Creative Commons License, all supplemental material carries the same license as the article it is associated with.
For non-Open Access articles published, all supplemental material carries a non-exclusive license, and permission requests for re-use of supplemental material or any part of supplemental material shall be sent directly to the copyright owner as specified in the copyright notice associated with the article.