
Abstract
Aims:
To assess predictors of glycemic control after patients with type 2 diabetes mellitus (T2DM), inadequately controlled with oral antidiabetic drugs (OADs), were initiated basal insulin (BI) in the Observational Registry of BI Treatment study in China.
Materials and Methods:
This multicenter, 6-month prospective registry study included patients, ages 18–80 years, who enrolled in secondary and tertiary hospitals, representative of the eight geographic regions in China. In this subgroup analysis of patients who completed the 6-month follow-up, relationship between several variables and glycemic control (glycosylated hemoglobin [HbA1c] <7%) at 6 months was examined using logistic regression.
Results:
Overall, 16,271 completed the 6-month visit and were included in this subgroup analysis. At 6 months, mean HbA1c was 7.4% ± 1.4%. Multivariate logistic regression analysis showed significant independent associations between a higher HbA1c control rate with frequent self-monitoring of blood glucose (SMBG) at baseline (odds ratio [OR] = 1.02; P < 0.0001), continuous use of BI (OR = 1.56; P < 0.05), and increased SMBG frequency at 6 months (OR = 1.02; P < 0.0001). Large insulin dose at 6 months [0.25–0.35 IU/(kg·day): OR = 0.64 and ≥0.35 IU/(kg·day): OR = 0.63; P < 0.05], higher HbA1c levels at baseline (OR = 0.80; P < 0.0001), longer duration of diabetes (OR = 0.97; P = 0.0002), and more OADs at baseline (2 OADs: OR = 0.81 and ≥3 OADs: OR = 0.63; P < 0.0001) were associated with a lower HbA1c control rate.
Conclusions:
The major predictors of good glycemic control after the initiation of BI therapy in T2DM patients were lower baseline HbA1c levels, consistent use of BI, frequent SMBG at baseline and increase in the frequency of SMBG, shorter duration of diabetes, and fewer OADs at baseline.
Introduction
G
Basal insulin (BI) therapy is the next option if glycemic control is not achieved by OADs. BI provides uniform insulin coverage and controls blood glucose by inhibiting hepatic glucose production between meals and during sleep. 5 Based on an individual's need, BI formulations such as short-acting insulin—insulin lispro and insulin aspart—for prandial insulin therapy; intermediate-acting neutral protamine Hagedorn; or long-acting insulin glargine or insulin detemir may be used. 5 Indeed, early insulin therapy in patients with T2DM resulted in recovery of β cell function, prevented worsening of glycemic control, reduced serious hypoglycemic episodes and the need for more than one OAD, and had a neutral effect on cardiovascular outcomes. 6,7
Despite its benefits, insulin use remains suboptimal and is delayed in the real-world setting owing to the physicians' and patients' concerns, such as fear of hypoglycemia and pain associated with injections and blood tests. 8,9 A study involving 11 Asian countries reported that initiation of insulin therapy is delayed by ∼9 years; consequently, patients develop severe hyperglycemia. 9 A large population-based study in China conducted between 2007 and 2008 reported a diabetes prevalence of 9.7%–10.6% among men and 8.8% among women. 10 Given that diabetes has become a major public health concern in China, 10 optimal treatment options are crucial. However, in China, only 25.8% of patients with diabetes reported receiving treatment, and only 39.7% of treated patients had adequate glycemic control. 11
The Observational Registry of BI Treatment (ORBIT) in patients with T2DM uncontrolled by OADs in China is a study to evaluate glycemic outcome and safety of BI in the real-world setting. The study design and baseline characteristics have been reported previously. 12 This is a subgroup analysis of the ORBIT study, with the purpose of assessing predictors of glycemic control.
Materials and Methods
Study design
ORBIT is a multicenter, observational, 6-month prospective registry study in China. Patients were enrolled during a 12-month period at secondary and tertiary hospitals representative of the following eight geographic regions: Southwest, Northwest, Middle reaches of the Yangtze River, Middle reaches of the Yellow River, Northeast, South Coast, North Coast, and East Coast, as described previously. 12 Patients provided written informed consent. The protocol was approved by the Institutional Review Boards of Peking University and of other hospitals where the study was conducted.
Patient characteristics
Patients ages 18–80 years whose T2DM was inadequately controlled with OADs, with HbA1c ≥7% measured within 3 months at the same hospital, and were willing to receive BI therapy were included in the study. Patients were excluded if they were on any type of insulin for the last 2 years, had a significant comorbidity that would prevent completion of the 6-month follow-up as judged by the investigator, or had participated in another clinical trial ≥1 month before study enrollment. Pregnant or lactating women were also excluded.
Treatment and assessment
Insulin treatment was prescribed with or without OADs. The type of OADs used during the study period was directed by the physician. Titrations of insulin dose and adjustments to the medication regimen were based on the physician's recommendation and the patient's willingness. Patients were assessed at baseline (visit 1 [V1]), 3 months (visit 2 [V2]), and 6 months (visit 3 [V3]). Patient characteristics, including baseline and 6-month fasting plasma glucose (FPG), HbA1c, and self-monitoring of blood glucose (SMBG) frequency, were documented. Further details about data collection, assessment, and sample size estimation have been published previously. 12
Note
The “staple score” was used to describe the quantity of grain intake, which is rich in carbohydrates. “1” represents 0–100 g grain per day; “2” represents 101–200 g grain per day; “3” represents 201–300 g grain per day; “4” represents 301–400 g grain per day; “5” represents 401–500 g grain per day; and “6” represents more than 500 g grain per day.
The “meat score” was used to describe the quantity of meat intake. “1” represents 0–50 g meat per day; “2” represents 51–100 g meat per day; “3” represents 101–2000 g meat per day; and “4” represents more than 200 g meat per day.
General physical activity was used to record how many days the participants took part in general physical activity (more than 30 min per day) in the past week.
Special physical activity was used to record how many days the participants took part in special physical activity (more than 30 min per day) in the past week.
Study outcomes
Because the ORBIT study was an observational registry and nonintervention study, we tried to find factors that were correlated with the final results of HbA1c (HbA1c controlled and uncontrolled) in the real world, in a retrospective manner. In this subgroup analysis, we studied the percentage of patients who achieved glycemic control (HbA1c <7%) and predictors of glycemic control in patients with T2DM who completed the 6-month follow-up period.
Statistical analyses
Continuous variables with normal distribution were summarized with descriptive statistics and presented as mean ± standard deviation (SD). Odds ratios (OR) and 95% confidence intervals (CI) for relevant variables were calculated using univariate and multivariate logistic regression models. A stepwise logistic regression method was used to adjust for age; sex; duration of diabetes; macrocomplication; microcomplication; hospital level (secondary or tertiary); body mass index (BMI; <24, 24–28, ≥28); education degree; patient resource (inpatient or outpatient clinic); current residence (rural or urban); duration of OAD treatment; type of BI at baseline; staple, vegetable, and fruit scores at baseline; levels of HbA1c, fasting glucose, insulin dose, and SMBG frequency at baseline; general and special physical activity at baseline; meat score at baseline; number of OADs at baseline and at 6 months; general change in physical activity (V3-V1); change in vegetable (V3-V1), fruit (V3-V1), and meat (V3-V1) scores; insulin switch from V1 to V3 (continue BI, stop BI, and initiate premix insulin, stop BI without taking premix insulin); insulin dose at V3; and change from V1 to V3 in SMBG frequency, special physical activity, staple score, and insulin dose titration. P value cutoffs for selection and deletion of variables in multivariate model were 0.10 and 0.15, respectively.
General physical activity, referred to physical activities such as housework, daily work, and physical exercise, was measured as days in which activity time was cumulated by more than 30 min in the last 7 days. Special physical activity, referred to specific sports such as swimming, walking, and cycling, was measured as days in which such activities were conducted in the last 7 days. SMBG frequency referred to the frequency of SMBG per month. Meat, fruit, vegetable, or staple scores ranged from 1 to 6 and were measured by consumption of food in grams in the last 7 days.
Results
Patient characteristics
Of the 19,894 participants who registered, 18,995 were eligible for the study. Among these patients, 16,271 completed the 6-month visit and were included in this subgroup analysis. As reported previously, patients were predominantly male (52.5%) with a mean ± SD age of 55.4 ± 10.4 years. 12 The mean duration of diabetes was 6.4 ± 5.3 years. Before initiation of BI, patients had a mean HbA1c level of 9.6% ± 2.0% and an FPG level of 11.7 ± 4.0 mmol/L. 12 Overall, 75.7% of patients continued BI therapy until 6 months; 6.44% discontinued BI and switched to premix insulin; and 17.91% discontinued BI and did not receive premix insulin. At 6 months, mean HbA1c was 7.4%, and HbA1c control was achieved by 40.8% of participants. The frequency of hypoglycemia was 1.61 and 2.07 episodes/patient-year at baseline and at 6 months, respectively. Demographics and baseline characteristics of these patients are shown in Table 1.
Demographics and Baseline Characteristics of Patients in Glycosylated Hemoglobin-Controlled and Uncontrolled Groups
BMI, body mass index; DBP, diastolic blood pressure; FPG, fasting plasma glucose; HbA1c, glycosylated hemoglobin; OADs, oral antidiabetic drugs; SBP, systolic blood pressure; SD, standard deviation; SMBG, self-monitoring of blood glucose; T2DM, type 2 diabetes mellitus.
Factors associated with HbA1c control
Patients who achieved HbA1c control after 6 months had a shorter duration of diabetes (5.7 ± 5.1 years vs. 7.0 ± 5.4 years) and OAD treatment (4.9 ± 4.8 years vs. 6.2 ± 5.1 years) than patients who did not achieve HbA1c control (Table 1). HbA1c and FPG levels of the HbA1c-controlled group at baseline were lower than that of the HbA1c-uncontrolled group (9.1% ± 1.9% and 11.1 ± 3.8 mmol/L vs. 9.9% ± 2.0% and 12.0 ± 4.0 mmol/L, respectively). More patients who had received 1 OAD before initiation of BI achieved HbA1c control than those in the HbA1c-uncontrolled group (50.9% vs. 42.7%). Furthermore, frequency of SMBG in the HbA1c-controlled group was higher than that in the HbA1c-uncontrolled group (5.5 ± 10.6 vs. 5.0 ± 9.6).
At the 6-month follow-up, HbA1c control (<7%) was achieved by 46.7%, 38.0%, 34.1%, and 30.8% of patients who had diabetes for 0 to <5 years, 5 to <10 years, 10 to <15 years, and ≥15 years, respectively (Fig. 1). Therefore, patients with a longer duration of diabetes had lower HbA1c control. Similarly, baseline HbA1c levels also influenced HbA1c control. The percentage of patients who achieved recommended levels of HbA1c was 51.2%, 33.6%, 29.2%, and 31.0% for baseline HbA1c levels of 7% to <9%, 9 to <11%, 11 to <13%, and ≥13%, respectively (Fig. 2). Therefore, higher baseline HbA1c levels were associated with lower HbA1c control.
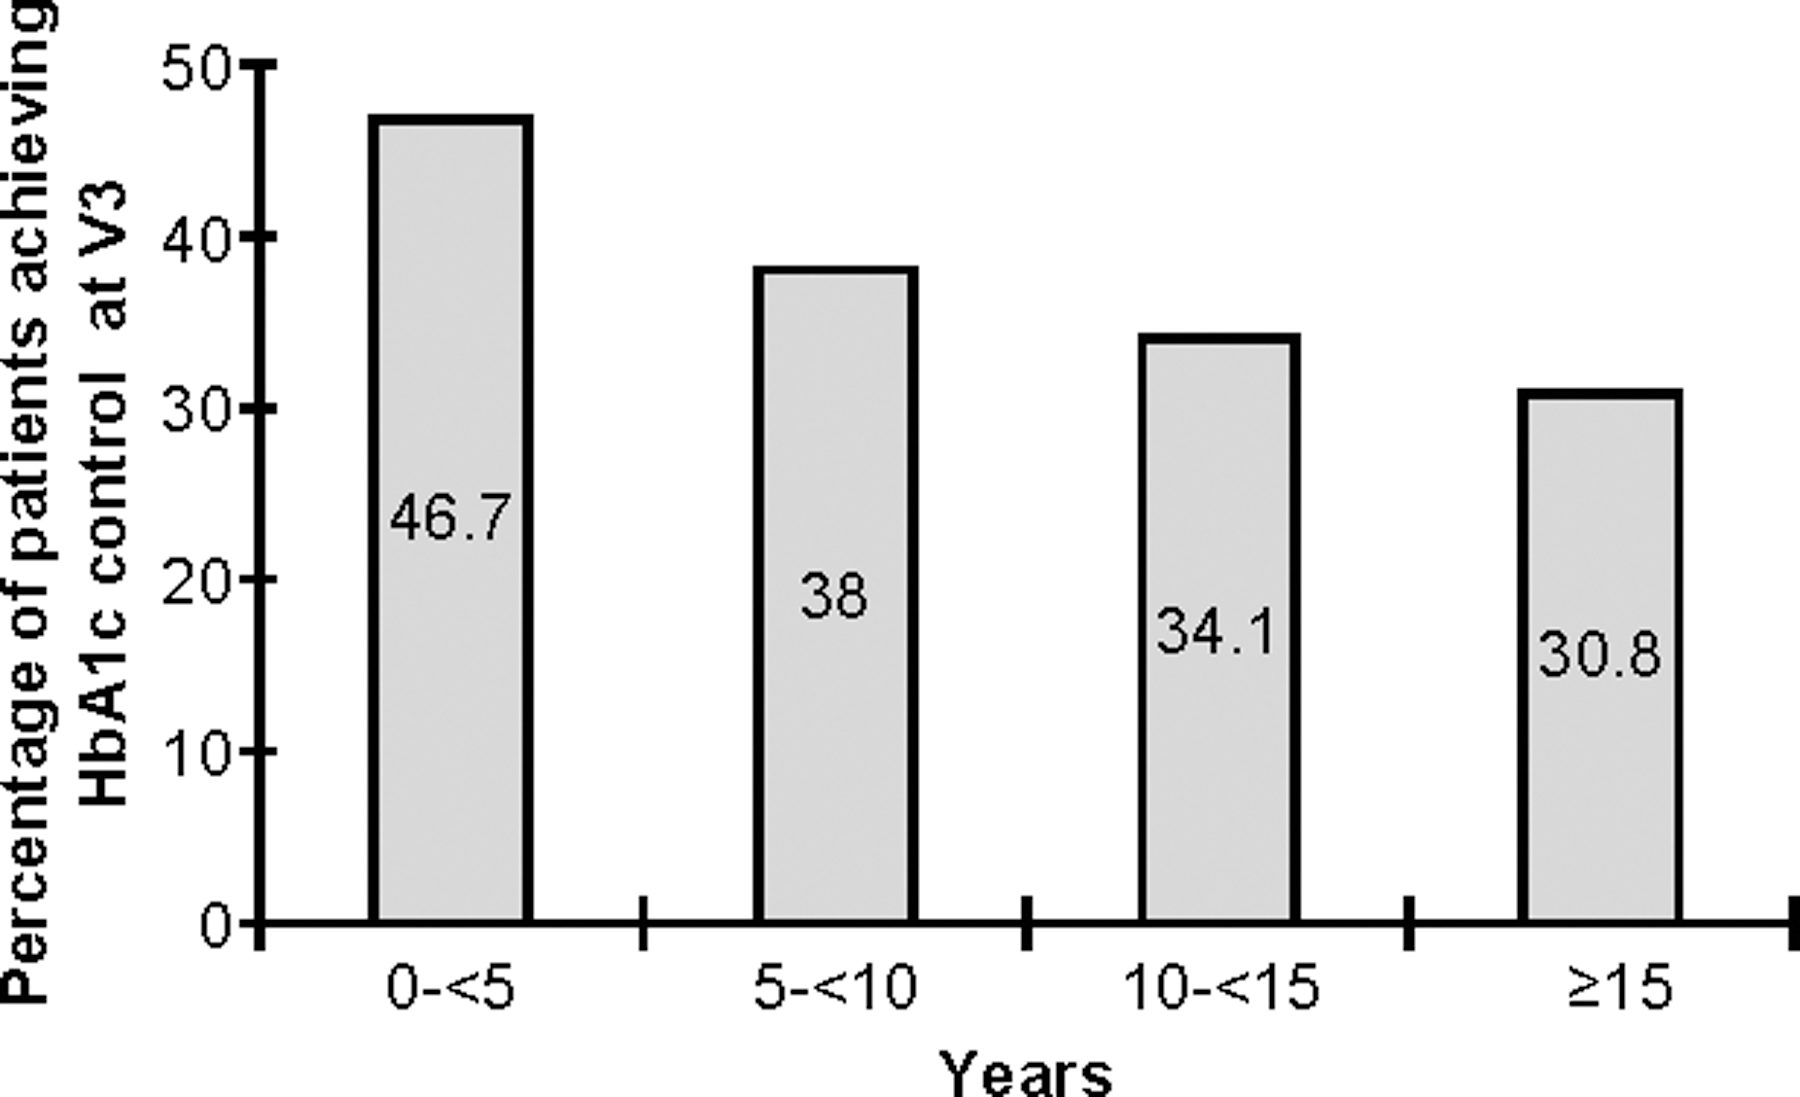
Duration of diabetes and the percentage of patients achieving HbA1c control (<7%) at V3 (6-month follow-up). HbA1c, glycosylated hemoglobin.

Baseline HbA1c and the percentage of patients achieving HbA1c control (<7%) at V3 (6-month follow-up).
Multivariate logistic regression analysis showed that a higher HbA1c control rate was associated with frequent SMBG at baseline, increased SMBG frequency at 6 months, and continuous use of BI, while a lower HbA1c control rate was associated with longer duration of diabetes, higher HbA1c, and more OADs at baseline and large insulin dose at 6 months (Table 2). In addition, we also found that two prandial injections at V1, shorter duration of OAD treatment (years), higher special physical activity at V1, increase in special physical activity from V1 to V3, higher educational level (Junior college and Bachelor's degree or higher), lower general physical activity at V1, hospital level (secondary hospital), patient resource (inpatient ward), current residence in rural area, lower BMI (≤24 kg/m2), absence of microvascular complications, and no dose titrations in the past 6 months were predictors of a higher HbA1c control rate, while the staple score change from V1 to V3 was a predictor of lower HbA1c control rate.
Factors Associated with Glycosylated Hemoglobin Control by Univariate and Multivariate Logistic Regression Models at Visit 3
BI, basal insulin; CI, confidence interval; OR, odds ratio; SE, standard error.
Discussion
Result of this subanalysis showed that initiation of insulin therapy was still being delayed resulting in many T2DM patients developing severe hyperglycemia. The baseline clinical data of this study were comparable with the First Basal Insulin Evaluation (FINE) Asia study. 9 Before initiating BI treatment, the levels of HbA1c and FPG on average were 9.6% ± 2.0% and 11.7 ± 4.0 mmol/L, respectively. Initiation of BI in poorly controlled T2DM patients with OADs provided clinically important improvements in glycemic control. After 6 months of BI therapy, the mean HbA1c was 7.4% ± 1.4% and the percentage of patients who achieved HbA1c control was 40.8%.
Results from our real-world study are in agreement with results from previous studies. A pooled analysis of data from 15 treat-to-target randomized controlled trials (RCTs) showed that adding insulin glargine to metformin, sulfonylurea, or both, decreased HbA1c from 8.8% at baseline to 7.2% at week 24. 13 The improvement of HbA1c in this ORBIT subgroup analysis appears to be greater than reported in the RCTs. In a previous registry study conducted in Taiwan, a total of 836 patients with T2DM taking OADs and with uncontrolled HbA1c were treated with BI. 14 After 24 weeks of BI treatment, HbA1c decreased from 10.1% ± 1.9% to 8.7% ± 1.7%. Only 0.7% of patients experienced severe hypoglycemia and had a low incidence of adverse drug reactions (0.4%). While the treatment was well tolerated and improved treatment satisfaction, the results underscore the need for early uptitration to achieve treatment goals. 14
Several factors can determine achievement of HbA1c targets. In this study, 75.6% of patients continued on BI therapy until 6 months. The multivariate logistic regression analysis data showed that continuous use of BI could predict a higher rate of HbA1c control. Furthermore, this study showed that lower baseline HbA1c levels resulted in better glycemic control. Among patients with baseline HbA1c levels between 7% and 9%, 51.2% achieved HbA1c control, whereas when the baseline levels were ≥9%, only 29%–34% of patients achieved the HbA1c target. Similar results were reported in a real-world study based on ambulatory electronic medical records from the General Electric Centricity database in which 13,373 patients with T2DM who initiated BI between February 2006 and August 2009 were included. 15 In that study, patients with baseline HbA1c ≤6.5% were more likely to achieve target glycemia than those with HbA1c >9% (88.4% vs. 29.0%). Moreover, in a patient-level analysis of 12 studies, low baseline HbA1c was found to be the best clinical predictor of achieving HbA1c control. 16 In agreement with results of this study, other factors influencing HbA1c control include SMBG and use of OADs.
SMBG is considered a critical component in the effective management of individuals with insulin-treated T2DM. Frequent SMBG and active titration of insulin dose result in good glycemic control. A real-world study conducted in the United States revealed that early insulin initiation in patients taking 1OAD may be clinically beneficial, resulting in better glycemic control and lower incidence of hypoglycemia without adding to costs, compared with patients taking 2 and ≥3 OADs. 17
In a real-world setting, insulin use is delayed due to the reluctance of physicians and patients. 8,9 In the current study, we found that patients with a longer duration of diabetes had lower glycemic control, suggesting that early initiation of insulin treatment is beneficial. Similarly, results of the Modality of Insulin Treatment Evaluation (MOTIV) study showed that patients with a shorter duration of diabetes achieved higher rates of glycemic control. 18
As shown in Table 2 (the data of multivariate analysis), we found that the OR of duration and baseline A1C were 0.80 and 0.97, respectively. Perhaps baseline A1C had more effect on the final results (defined HbA1c <7% as “HbA1c-controlled group” and HbA1c ≥7% as “HbA1c-uncontrolled group”).
Early initiation of insulin also ensures that patients are treated before the onset of microvascular complications. In this study, patients without microvascular complication were likely to achieve higher rates of HbA1c control compared with patients with microvascular complications. Results of the Add-on Lantus® to Oral Hypoglycemic Agents (ALOHA) observational study conducted in Japan are in agreement with the results of the current study. Insulin-naive patients without complications treated with OADs and insulin glargine had a higher chance of attaining HbA1c <7.0% than those with complications. 19
In accordance with AACE guidelines and ADA/EASD guidelines, the Chinese Diabetes Society guidelines also call for the progressive addition of more intensive therapy with T2DM as time goes by. However, the actual situation was not satisfactory. Some economic factors, including the cost of SMBG and part of the cost of drugs, could affect A1C control. Certainly “clinical inertia” is a very important factor in failing to intensify therapy. In a retrospective cohort study 20 based on 81,573 people with type 2 diabetes in the United Kingdom, we found that a substantial proportion of people remained in poor glycemic control for several years before intensification with OADs and insulin. The reasons for clinical inertia include hypoglycemia, weight gain, and impaired quality of life.
In this observational registry study, a small insulin dose at 6 months was associated with a higher HbA1c control rate. We compared the duration of diabetes, baseline HbA1c level, number of OADs, and other variables between the small insulin dose and large insulin dose groups, and found no difference between these two groups.
This was an observational study in the real world, not a randomized controlled clinical trial. The dose of BI was 0.18 U/kg at baseline, 0.20 U/kg at 3 months, and 0.21 U/kg at 6 months, so “the titration of the dose of BI was not enough.” Perhaps the physicians and patients worried about hypoglycemia and excess weight gain. There were 24.8% of participants without insulin titration, 15.3% self-titration, 40.1% physician-led insulin titration, and 19.8% combined physician- and patients-led insulin titration. As a result, 47.5% of participants were without insulin titration, 27.8% of participants decreased the dose of BI at 6 months, and only 24.7% of participants increased the dose of BI at 6 months.
Patients with a shorter duration of DM or lower BMI, after lower dose of BI treatment, did better on A1C control. It is possible that insulin sensitivity was different in the small and large insulin dose groups; however, we did not measure blood insulin levels to calculate HOMA-IR and HOMA-β.
Among the patients with BI treatment, usually the more times of prandial injections, the better effect of intensive treatment. So, we could understand that those with two prandial injections were better HbA1c controlled than one prandial injection.
However, in this study, the participants were consecutively enrolled by their physicians from either inpatient or outpatient departments of hospitals. Most participants with three prandial injections were enrolled from the outpatient department, their duration of DM was longer, and their baseline HbA1c was higher, and so, the control rate of HbA1c was lower.
The OR of rural: urban (urban was used as a referent) was 0.92 (95% CI: 0.86–0.99) by univariate logistic regression, but the OR of rural: urban was 1.15 (95% CI: 1.04–1.26) by multivariate logistic regression. After further analysis, we found that there was interaction effect between geographical region variable and rural: urban variable. In some rich areas, the East coast and Yangtze river regions, the rate of HbA1c controlled in rural was higher than urban. However, in other regions, the Yellow river, Southwest, and Northwest, the rate of HbA1c controlled in rural was lower than urban. The multivariate logistic regression analysis included much more information than the urban: rural variable, univariate logistic regression analysis.
Observational registry-based studies have a number of advantages and disadvantages compared with RCTs. The major advantages of a registry study are inclusion of a large number of patients and the ability to assess the effect of therapy under real-world conditions, which can reflect the use of treatment in clinical practice. A number of limitations should be considered with this analysis. (1) This registry study was not randomized and the characteristics of patients receiving the different treatment regimen may not be matched and could result in potential bias. (2) The titration of the dose of BI was not enough. Differences in insulin treatment among the different physicians were possible. (3) The study period was 6 months, and it was hard to draw any inferences about the long-term effects of early initiation of insulin therapy. (4) Although the sample size was large, the data were based on a Chinese population and cannot be extended to the global population.
In conclusion, lower baseline HbA1c levels, consistent use of BI, frequent SMBG at baseline and increase in the frequency of SMBG, small insulin dose, shorter duration of diabetes, and fewer OADs at baseline were the major predictors of good glycemic control after the initiation of BI therapy in patients with T2DM.
Footnotes
Acknowledgments
The study was sponsored by Sanofi-Aventis (Shanghai, China). The study was designed, executed, and analyzed at The George Institute for Global Health at Peking University Health Science Center. The authors thank Juming Lu, MD, Chinese PLA General Hospital, Beijing, China; Xiaohui Guo, MD, Peking University First Hospital, Beijing, China; Weiping Jia, MD, Shanghai Sixth Hospital, Shanghai, China; Jianping Weng, MD, The Third Affiliated Hospital of Sun Yat-sen University; Guangzhou, China; Wenying Yang, MD, China-Japan Friendship Hospital, Beijing, China; Dajin Zou, MD, The Second Military Medical University, Shanghai, China; Zhiguang Zhou, MD, Xiangya Second Hospital, Changsha, Hunan, China; and patients for their participation, without whom this study would not have been possible. Editorial services were provided by Cactus Communications and funded by George Institute for Global Health at Peking University Health Science Center. The study was funded by Sanofi-Aventis (Shanghai, China). The funder did not participate in study design or execution, drug choice, data analysis, and reporting. The study was designed, executed, and analyzed at The George Institute for Global Health at Peking University Health Science Center.
Author Disclosure Statement
No competing financial interests exist.