
Abstract
The aim of this study was to establish the effects of clinical doses of Gla-300 versus Gla-100 on suppression of glucagon, lipolysis, and ketogenesis in type 1 diabetes mellitus (T1DM). Eighteen persons with T1DM (age 40 ± 12 years, diabetes duration 26 ± 12 years, body mass index 23.4 ± 2 kg/m2, A1C 7.19% ± 0.52% [55 ± 6 mmol/mol]) were studied after 3 months of titration with Gla-300 and Gla-100 (randomized, crossover design) with a 24-h euglycemic clamp (s.c. injection of individual insulin daily doses used by subjects for previous 2 weeks, Gla-300 0.35 ± 0.08 and Gla-100 0.28 ± 0.07 U/kg). Gla-300 resulted in (1) less increase in insulin concentration for 0–12 h, but greater insulin concentration in 12–24 h (no differences for 24 h); (2) greater glucagon suppression; (3) greater prehepatic insulin-to-glucagon molar ratio, primarily in 12–24 h (ratio 1.78, 90% confidence intervals [CIs] 1.5–2.1); and (4) lower 24-h free fatty acid (0.81; 90% CI 0.73–0.89), glycerol (0.78; 90% CI 0.65–0.94), and β-hydroxybutyrate (0.72; 90% CI 0.58–0.90). Over the 24 h postinjection, as compared with Gla-100, clinical doses of Gla-300 exhibit greater suppressive effects on glucagon, lipolysis, and ketogenesis, whereas the effects on glucose metabolism are equivalent.
Introduction
Recent studies have compared the pharmacokinetics (PK) and pharmacodynamics (PD) of the long-acting (basal) insulin analogues glargine U300 (Gla-300) and glargine U100 (Gla-100) in type 1 diabetes mellitus (T1DM) at fixed insulin doses after single injection, 1 at steady state, 2 and at individual doses that persons with T1DM require daily. 3
In addition to glucose metabolism, insulin regulates several physiological pathways, such as modulation of glucagon secretion, 4 effects on lipid 5 and protein 6 metabolism, and endothelial function. 7 Only one study, investigating PK/PD of glargine and detemir at steady state in T1DM, however, has reported on the effects of long-acting insulin analogues, on regulation of alanine, lactate, and lipid metabolism. 8
The aim of this study was to establish the potential differences between clinical doses of Gla-300 and Gla-100 on suppression of glucagon, lipolysis, and ketogenesis, in a group of persons with T1DM in whom the results of glucose metabolism have already been described. 3
Materials and Methods
Subjects, study design, and methods have been previously described in detail. 3 In brief, 18 persons with T1DM (age 40 ± 12 years, diabetes duration 26 ± 12 years, body mass index 23.4 ± 2 kg/m2, A1C 7.19% ± 0.52% [55 ± 6 mmol/mol], plasma C-peptide 0.01 ± 0.01 ng/mL) were studied after 3 months of optimization of glycemic control with Gla-300 or Gla-100 (evening dosing), titrated to fasting near-normoglycemia (90–110 mg/dL), in addition to prandial rapid-acting insulin analogues (randomized, crossover study with 2 months washout period).
Subjects were studied during 24 h fasting, with the euglycemic glucose clamp at steady state of basal insulin treatment, after s.c. injection at 20.00 h of the clinical dose of Gla-300 and Gla-100 that they were on in everyday life. The study treatment was open, but blind to clamp investigators. Bedside plasma glucose (PG) and serum-free insulin concentration (FIRI) were measured by previously described methods. 3 Plasma glucagon was measured by a commercial radioimmunoassay kit (DRG Instruments GmbH, Marburg, Germany): blood glycerol, β-hydroxybutyrate, alanine, and lactate by previously described fluorimetric methods. 9 Free fatty acid (FFA) values were measured using a commercial kit (Wako NEFA C test kit; Wako Chemicals, Neuss, Germany). All parameters were measured every 2 h. The study protocol was approved by the Ethical Study Committee of Umbria Region (CEAS) and registered with EudraCT number 2015-002135-17.
The endpoint was the area under the plasma glucagon, blood FFA, glycerol, and β-hydroxybutyrate concentration curves (AUC) for 24 h, and in the second versus first 12-h postdosing time intervals with Gla-300 versus Gla-100. Another endpoint was prehepatic insulin-to-glucagon molar ratio.
Calculations and Statistical Methods
The linear trapezoidal rule was used to calculate the AUC of the parameters measured. The prehepatic insulin-to-glucagon molar ratio was calculated from the peripheral concentrations of insulin (which equals portal in the absence of endogenous secretion) and glucagon (corrected for hepatic clearance), as previously reported. 10 Fluctuation of prehepatic insulin-to-glucagon molar ratio around the average value was calculated as [(insulin-to-glucagon molar ratio Cmax − insulin-to-glucagon molar ratio Cmin/insulin-to-glucagon molar ratio Cavg)]. Point estimates of treatment ratios (Gla-300/Gla-100), with 90% confidence intervals (CIs), were calculated using ANOVA, which allowed for variation due to sequence, subjects nested within sequence, period, and treatment based on log-transformed data and retransformations. Equivalence was to be concluded if the 90% CIs for each parameter were completely contained within the interval 0.80–1.25. Data are expressed as mean ± standard deviation or geometric means (95% CI) as appropriate in tables and in text, and in figures as means and standard error. Statistical analysis was usually performed using NCSS12/PASS11 (NCSS, LLC. Kaysville, UT).
Results
Glycemic control before studies and PG concentration in euglycemic clamp studies
Glycemic control before the studies was no different with Gla-300 versus Gla-100 (A1C 6.94 ± 0.48 and 6.97% ± 0.49% [52 ± 5 and 53 ± 6 mmol/mol], respectively), mean PG was no different, and hypoglycemia did not occur in the 3 days before studies. 3 A modest amount of i.v. insulin and/or glucose was needed before the clamp (from −5 to 0 h) to normalize PG. 3 The total amount of insulin infused was lower (0.76 ± 0.55 and 1.33 ± 0.68 U of insulin), whereas glucose infused was higher (5.04 ± 5.9 and 0.79 ± 1.01 g of glucose) with Gla-300 versus Gla-100, respectively. 3 PG was 100 ± 1.2 and 101 ± 1.8 mg/dL during the 24 h clamp with Gla-300 and Gla-100, respectively. The quality of the performance of the clamp studies was quite good based on the coefficient of variation of PG measurements 3.5% ± 1.3%.
Serum-free insulin, plasma glucagon, and prehepatic insulin-to-glucagon molar ratio
The mean doses of basal insulin injected s.c. at T0 of the clamp were 0.35 ± 0.08 and 0.28 ± 0.07 U/kg with Gla-300 and Gla-100, respectively (steady-state daily doses used by subjects over the previous 15 days).
Serum insulin concentration increased less with Gla-300 versus Gla-100 over the initial 6 h, then it was comparable between 6 and 18 h, and finally was more elevated for last 6 h of the study in the interval 18–24 h. 3 (Fig. 1 and Supplementary Table S1)
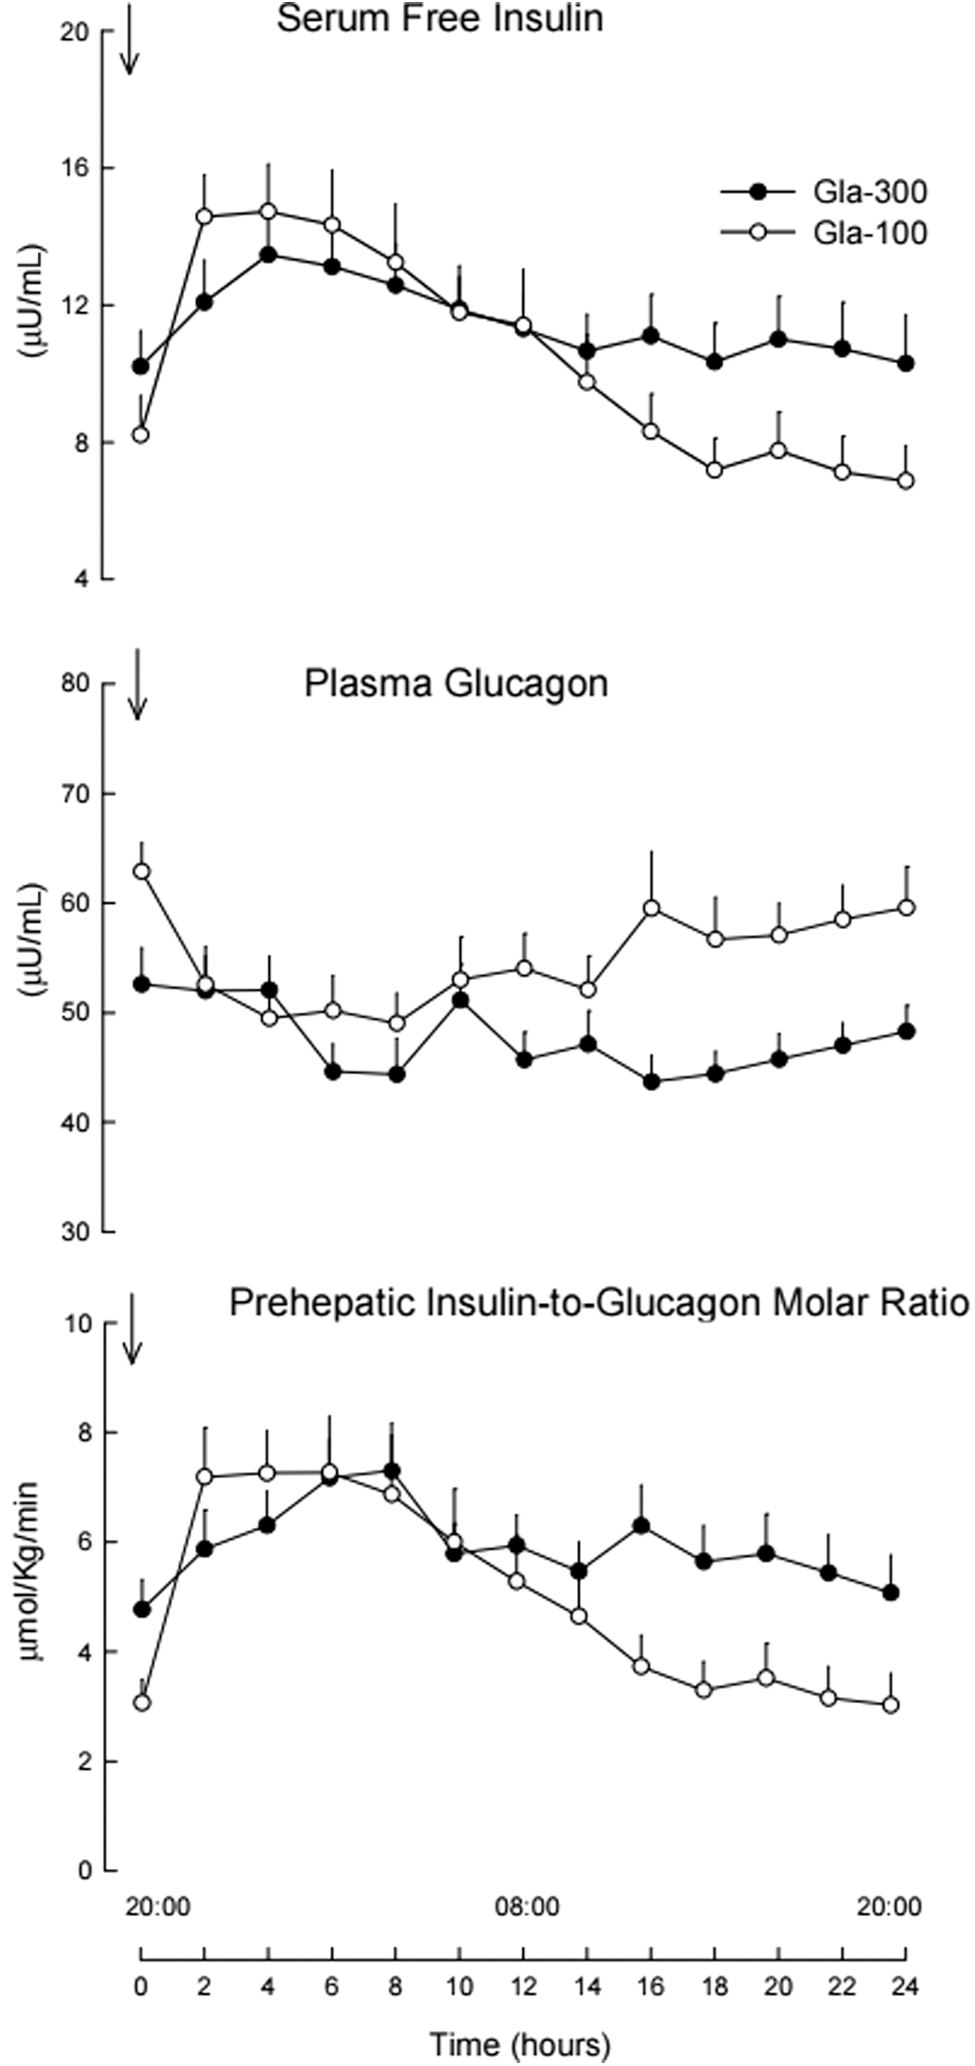
Serum-(free) insulin and plasma glucagon concentrations and prehepatic insulin-to-glucagon molar ratio during 24 h postinjection of clinical individual doses of basal insulin Gla-300 (full dots) and Gla-100 (open dots) in 18 persons with T1DM. T1DM, type 1 diabetes mellitus.
Baseline plasma glucagon at T0 was lower with Gla-300 (51 pg/mL, 44–58) versus Gla-100 (62 pg/mL, 56–62), Gla-300/Gla-100 ratio 0.82 (CIs 0.74–0.91). After s.c. insulin injection, plasma glucagon was similarly suppressed with both Gla-300 and Gla-100 for the first 12 h of study, but more so in the second 12 h postdosing with glucagon AUC 19% (13%–24%) lower with Gla-300 versus Gla-100. (Fig. 1 and Supplementary Table S1)
The prehepatic insulin–glucagon molar ratio at T0 was 70% (39%–109%) higher with Gla-300 versus Gla-100 (4.1, CIs 3.2–5.4 and 2.4, CIs 1.7–3.4 mol/mol, respectively). The prehepatic insulin–glucagon molar ratio increased to similar values with both insulins during the first 12 h, although the relative increase was lower with Gla-300. In the second 12 h of study, the prehepatic insulin–glucagon molar ratio remained more stable with Gla-300 and was 78% (50%–109%) greater than Gla-100. (Fig. 1 and Supplementary Table S1) Fluctuation of the prehepatic insulin–glucagon molar ratio was 37% lower with Gla-300 as compared with that with Gla-100.
FFA, glycerol, and β-hydroxybutyrate
At T0, with Gla-300 versus Gla-100, FFA concentrations were 40% (46%–78%) lower (244, 200–290 and 390, 320–0.490 μmol/L, respectively), β-hydroxybutyrate 70% (46%–83%) lower (60, 40–90 and 190, 140–270 μmol/L, respectively), despite lower rates of i.v. insulin infusion over the 5 h before study with Gla-300 versus Gla-100. 3 After s.c. injection of insulin, FFA values with the two insulins were similar until 12 h postdosing, after which time the increase in FFA was greater with Gla-100 versus Gla-300 until the end of the study. FFA values were 24% (14%–32%) lower at 24 h postinjection of Gla-300 versus Gla-100 (Fig. 2 and Supplementary Fig. S1 and Supplementary Table S1). A similar 24 h pattern was observed with glycerol. (Fig. 2 and Supplementary Fig. S1 and Supplementary Table S1). β-Hydroxybutyrate suppressed more within 2–4 h after s.c. injection of Gla-100, thus mimicking the pattern of FFA, and remained suppressed until 16 h. Thereafter, β-hydroxybutyrate increased more with Gla-100 until 24 h. (Fig. 2 and Supplementary Fig. S1 and Supplementary Table S1).
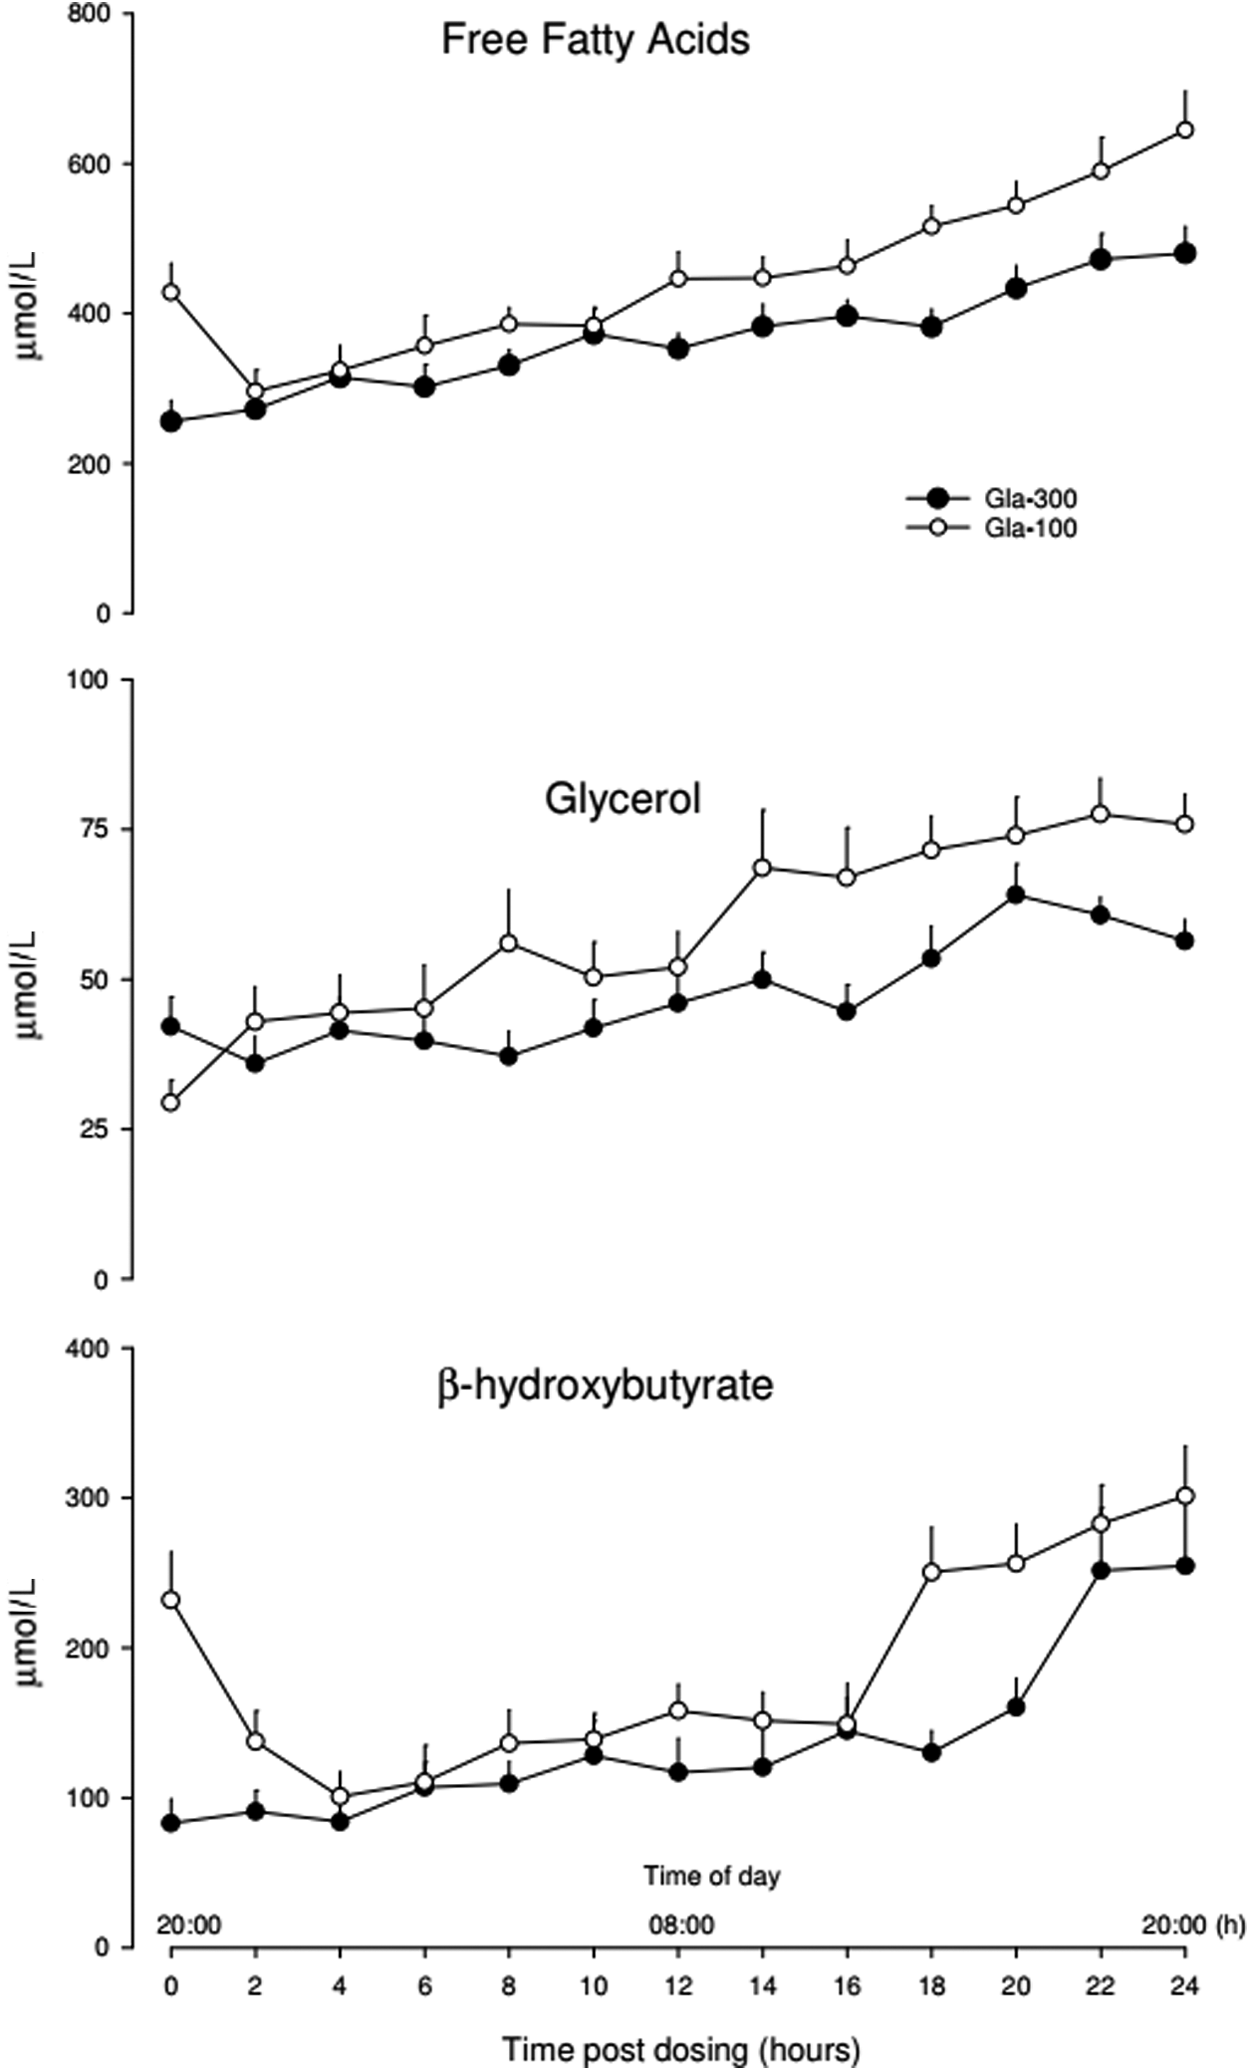
Blood FFA, glycerol, and β-hydroxybutyrate concentrations during 24 h postinjection of clinical individual doses of basal insulin Gla-300 (full dots) and Gla-100 (open dots) in 18 persons with T1DM. FFA, free fatty acid.
The overall suppressive effect on lipolysis and ketogenesis of both insulins, as assessed by the averaged ratio of FFA, glycerol, and β-hydroxybutyrate, was 21%, 15%, and 23% greater during 24 h (0–24 h), during the first 12 h (0–12 h), and during the last 12 h (12–24 h), respectively, with Gla-300 as compared with Gla-100 (Supplementary Fig. S1). The changes of FFA, β-hydroxybutyrate, and glucagon over the 24 h with Gla-300 were lower as compared with Gla-100 as directly measured by the treatment × time interaction term in the repeated measures ANOVA (two-way repeated-measures ANOVA) (treatment × time, F17,272 = 2.93, P = 0.033 [FFA]; F17,272 = 2.96, 0.021 [β-hydroxybutyrate] and F17,272 = 4.2, P = 0.002 [glucagon], all with Greenhouse–Geisser correction).
Alanine and lactate
Alanine and lactate concentrations were equivalent, with absolute values lower by ∼10% with Gla-300 versus Gla-100. (Supplementary Fig. S2 and Supplementary Table S1).
Discussion
This study demonstrates that clinical individual doses of insulin Gla-300 suppress glucagon and lipid metabolism more than Gla-100 doses over the 24 h postdosing. This result is new and is at variance with the effects observed on glucose metabolism that are equivalent for the 24 h with the two insulins. 3
The effects of Gla-300 versus Gla-100 here reported on glucagon and lipid metabolism are explained primarily by the differences in serum insulin dynamics between the two insulins. With Gla-300 serum insulin tends to be lower in first 12 h, but is higher in second 12 h postdosing (Fig. 1 and Supplementary Table S1). This translates into greater suppression of glucagon and lipid metabolism, primarily in second 12 h postdosing with Gla-300 versus Gla-100 (Figs. 1 and 2 and Supplementary Table S1). Under these experimental conditions, also glucose metabolism was more stimulated in the second 12 h postdosing with Gla-300 versus Gla-100, but interestingly the overall 24 h effect of the two insulins was similar. 3 Thus, there are differences between glucose 3 and lipid metabolism (present study), which may be explained by the well-known greater insulin sensitivity of adipose tissue versus liver glucose metabolism. This has been shown for minimal increments in serum insulin concentration in normal nondiabetic subjects, 5,11 and, likely, this is the case also in persons with T1DM on fair glycemic control, as were those of this study.
The insulin doses of Gla-300 used in this study by the T1DM persons were higher than those of Gla-100, however, resulting in similar glycemic control (A1C) as well as equivalent effects on glucose metabolism over the 24 h. 3 This is consistent with previous clinical trials wherein glycemic control was matched with the two insulins used at different doses 12 and may be explained by the need to compensate for the lower bioavailability of Gla-300 versus Gla-100 after s.c. administration. 2,13
The greater suppression of glucagon with Gla-300 versus Gla-100 was modest, as modest were the differences in insulin concentrations over the 24 h. Under these conditions, the noninvasively estimated prehepatic insulin-to-glucagon molar ratio is a more useful parameter than isolated individual concentrations of serum insulin and glucagon, to interpret liver glucose metabolism (Fig. 1). 10 In fact, it is the relative concentration of the two islet hormones that perfuse the liver through the portal route, to determine the fine physiological tuning of Endogenous Glucose Production, more than isolated individual concentrations of serum insulin and glucagon. 10
The greater suppression of glucagon and lipid metabolism with Gla-300 versus Gla-100 appears quantitatively small and one might wonder whether the magnitude of the difference would be clinically significant to patient care. Clearly, that would require a larger study with clinical outcomes. Indeed, this PK/PD study provides a rational basis for such a study.
It is tempting to speculate on the possible beneficial effects of second-generation long-acting insulins with more robust suppression of glucagon and lipid metabolism, like Gla-300 for people with T1DM. With evening dosing of Gla-300, the greater estimated prehepatic insulin-to-glucagon molar ratio accounts for lower EGP 24 h postdosing, 3 which could explain the predinner lower glucose value observed in Continuous Glucose Monitoring studies. 14,15 The greater lipid and ketone body suppression of Gla-300 over the 24 h might help reducing the risk of Diabetic Ketoacidosis in some T1DM people presenting recurrent DKA on Gla-100 or detemir, but ad hoc studies are required to prove this hypothesis. In this regard, it will be interesting to see the results of the ongoing trial with a similar question with insulin degludec versus Gla-100 and detemir. 16
In conclusion, the greater suppressive effects of clinical doses of Gla-300 on glucagon, and lipid metabolism, add to the differences shown in PK/PD, 3 and help in understanding the potentially more beneficial effects of Gla-300 versus Gla-100 in people with T1DM.
Footnotes
Acknowledgments
The authors are grateful to the persons with T1DM who have volunteered for the study for free (in Italy no payment/reimbursement for volunteers of clinical research is allowed). Clinical Trial Information: EudraCT 2015-002135-17.
Authors' Contributions
P.L. enrolled patients, performed clamps, analyzed data, reviewed/edited the article; F.P. enrolled patients, performed clamps, analyzed data, wrote the clinical protocol, and reviewed/edited the article; P. Candeloro performed clamps, laboratory assays, and reviewed/edited the article; P.C. performed clamps and reviewed/edited the article; A.M.A. performed clamps and reviewed/edited the article; C.G.F. enrolled patients, performed clamps, analyzed data, performed statistical analysis, and wrote the article; and G.B.B. provided the study concept and design, supervised the protocol development and the research, enrolled patients, and wrote the article. C.G.F. is the guarantor of this study and, as such, had full access to all the data in the study and takes responsibility for the integrity of the data and the accuracy of data analysis.
Author Disclosure Statement
P.L. has received travel grants for scientific meetings from Sanofi, Novo, Abbott, and Menarini, F.P. has received honoraria for lectures and consultations from Sanofi, Eli Lilly, and Astra Zeneca, and travel grants from Sanofi; P.C., P.C., and A.M.A. disclose no conflict of interest. G.B.B. has received honoraria for lectures and consultations from Sanofi and Menarini; C.G.F. has received honoraria for lecturing and consultations from Sanofi and travel grants from Menarini.
Funding Information
The study is an investigator initiated trial, partially funded by Sanofi.
Supplementary Material
Supplementary Figure S1
Supplementary Figure S2
Supplementary Table S1
References
Supplementary Material
Please find the following supplemental material available below.
For Open Access articles published under a Creative Commons License, all supplemental material carries the same license as the article it is associated with.
For non-Open Access articles published, all supplemental material carries a non-exclusive license, and permission requests for re-use of supplemental material or any part of supplemental material shall be sent directly to the copyright owner as specified in the copyright notice associated with the article.