
Abstract
Background:
Sodium/glucose cotransporter-2 (SGLT2) inhibitors improve glycemic control and reduce body weight by increasing glycosuria. Although a compensatory increase of food intake has been reported, the long-term effect of SGLT2 inhibitors on food intake remains unclear. This study investigated the influence of canagliflozin on calorie and nutrient intake over 1 year.
Materials and Methods:
Patients with type 2 diabetes (n = 107) were enrolled and followed prospectively while receiving canagliflozin at 100 mg/day for 12 months. Intake of nutrients was investigated by using the food frequency questionnaire. Hemoglobin A1c, body weight, and satisfaction with diabetes treatment (assessed by the Diabetes Treatment Satisfaction Questionnaire: DTSQ) were also investigated.
Results:
The baseline total energy intake was 1723 ± 525 kcal/day and it showed a persistent increase during treatment with canagliflozin, being 132 kcal higher at 6 months (P = 0.0058) and 113 kcal higher at 12 months (P = 0.0516). Intake of all three macronutrients (carbohydrate, protein, and fat) was significantly increased after 6 months of canagliflozin treatment (P = 0.0129, P = 0.0160, and P = 0.0314, respectively), but their ratio was unchanged. The DTSQ score improved significantly and both hemoglobin A1c and body weight showed a significant decrease throughout treatment (all P < 0.0001).
Conclusions:
After patients with type 2 diabetes commenced canagliflozin, their calorie intake increased without changing the ratio of the three macronutrients. Despite elevation of the calorie intake, glycemic control improved and weight loss was achieved. Satisfaction with treatment of diabetes also increased.
Introduction
Sodium/glucose cotransporter 2 (SGLT2) inhibitors suppress glucose reabsorption in the renal tubules and reduce blood glucose levels by promoting urinary glucose excretion in an insulin-independent manner. 1,2 Unlike other oral antidiabetic agents, 3 SGLT2 inhibitors are also expected to reduce body weight due to calorie loss.
In patients with type 2 diabetes receiving canagliflozin (100 mg/day), urinary excretion of glucose was reported to be ∼100 g/day. 4,5 It was reported that the decrease of hemoglobin A1c was similar in patients receiving canagliflozin alone or combined with other oral antidiabetic agents and the improvement persisted for 12 months, whereas body weight decreased by 2–3 kg in patients taking canagliflozin and weight loss was also maintained for 12 months. 6,7 Moreover, a study employing dual-energy X-ray absorptiometry showed that body fat was reduced by 2.9 kg and lean body mass by 0.9 kg after 1 year of treatment with canagliflozin (100 mg/day), whereas body fat and lean body mass increased by 1 kg in patients receiving glimepiride. 8 These findings indicate that SGLT2 inhibitors promote weight loss by increasing calorie loss in patients with type 2 diabetes, with body fat reduction leading to improvement of insulin resistance.
In a recent study, satisfaction with treatment of diabetes was improved after 14 weeks of dapagliflozin therapy and the increase of satisfaction was significantly correlated with weight loss. 9 A similar result was reported for canagliflozin. 10 These reports suggest that weight loss associated with SGLT2 inhibitor therapy may reduce the burden of treatment for patients with type 2 diabetes.
On the other hand, SGLT2 inhibitors enhance appetite in animal models of diabetes despite exerting a hypoglycemic effect. 11 –13 In humans, weight reduction with SGLT2 inhibitor therapy is less than expected from the calorie loss, and compensatory elevation of calorie intake was revealed by a mathematical model based on clinical data obtained in patients taking empagliflozin. 14 In accordance with this model, ipragliflozin caused a significant increase of appetite (evaluated by the visual analog scale score for hunger) after 2 and 8 weeks of treatment. 15 Furthermore, it was reported that sucrose intake showed a significant increase after administration of dapagliflozin to patients with type 2 diabetes for 3 months, although total energy intake and daily intake of the three macronutrients were not altered significantly. 16 These reports suggest that treatment with SGLT2 inhibitors may lead to changes of food intake and eating habits. Because well-balanced nutrition is essential for management of diabetes treatment, it is important to evaluate the effect of SGLT2 inhibitors on intake of nutrients.
To date, no studies have examined the long-term dietary effects of SGLT2 inhibitors. Therefore, we prospectively investigated the influence of canagliflozin treatment for 12 months on food intake, as well as glycemic control, body weight, and satisfaction with treatment of diabetes.
Materials and Methods
Study design
From September 2015 to November 2017, we performed an investigator-initiated, multicenter (22 sites), single-arm, open-label clinical study (CAnagliflozin Nutrition intake Assessment in Kanagawa: CANA-K), which evaluated changes of the food frequency questionnaire (FFQg), 17 –19 HbA1c, and the Diabetes Treatment Satisfaction Questionnaire (DTSQ), 9,10 in patients receiving canagliflozin (CANAGLU® tablets 100 mg) at a dose of 100 mg once daily before or after breakfast for 12 months. Outpatients in diabetes clinics in Kanagawa Prefecture in Japan who met the inclusion criteria were given written information and a verbal explanation about this study. This study started after written informed consent was obtained from all patients participating in this study. This study was conducted in accordance with the ethics principles of the Declaration of Helsinki and the ethics guidelines for medical and health research involving human subjects. This study was registered with the University Hospital Medical Information Network Clinical Trials Registry (UMIN000016993).
Subjects
Patients were eligible for this study if they fulfilled the following criteria: (1) age ≥20 years, (2) inadequate response to diet and exercise therapy with or without oral antidiabetic agents (dipeptidyl peptidase 4 [DPP-4] inhibitors, sulfonylureas, metformin, etc.) for at least 12 weeks, (3) HbA1c (National Glycohemoglobin Standardization Program) between 6.5% (49 mmol/mol) and 10.0% (86 mmol/mol), and (4) ability to answer questions about diet/exercise therapy and complete two questionnaires (the DTSQ and FFQg). The exclusion criteria were as follows: (1) use of an SGLT2 inhibitor within 6 months before providing informed consent, (2) type 1 diabetes, severe ketosis, diabetic coma, or precoma within 6 months before providing informed consent, (3) insulin and/or glucagon-like peptide 1 receptor agonist therapy, (4) severe infection, perioperative status, or severe trauma, (5) severe hepatic dysfunction, (6) moderate/severe renal dysfunction (estimated glomerular filtration rate [eGFR] <45), (7) hypersensitivity to any component of the study drug, (8) urinary tract or genital tract infection such as chlamydia, syphilis, genital herpes, and condyloma acuminatum, (9) any contraindications to oral antidiabetic agents, (10) current participation in another clinical trial, (11) women who were pregnant or breastfeeding, possibly pregnant, or planning to become pregnant, and (12) patients who were considered ineligible by the principal investigator or investigator for other reasons.
Dietary assessment
Nutrition and food intake were assessed by the FFQg, which contains questions about 29 food groups and 10 kinds of cooking designed to obtain information on the average weekly intake of each food or food group in commonly used units or portion sizes. This questionnaire also assesses activities and exercise. The amount of activity and exercise were calculated based on the types of daily activity, the amount of time spent for each activity during each day, and the amount of time spent on exercise during each week (exercises were classified into four types before calculation: normal walking, fast walking, jogging, and running). After each participant completed the questionnaire, a dietician reviewed it with the participant. The FFQg has undergone external validation by comparison with weighed dietary records for seven consecutive days in 66 subjects 19–60 years of age. 19 The correlation between the FFQg and dietary records for intake of energy, protein, fat, carbohydrate, and calcium was 0.47, 0.42, 0.39, 0.49, and 0.41, respectively. 19 Intake of 26 of the 31 nutrients assessed by the FFQg was not significantly different between FFQg and 24-h dietary records by the paired t-test. 19
Endpoints
The primary endpoint was the change in daily total energy intake investigated using the FFQg from baseline up to 12 months after the study started. To assess food intake and exercise, a survey of weekly food frequency, daily physical activity (exercise and other physical activity), and weekly exercise time (hours) was conducted by a nutritionist using FFQg.ver.4.0.
The main secondary endpoints were (1) the changes of FFQg, except for the primary endpoints (changes in the intakes of the three macronutrients and their ratios, intakes of the other nutrients, and level of activity), (2) the change of HbA1c, and (3) the change of the DTSQ score from baseline to the end of the treatment period. Satisfaction with treatment was investigated by using the DTSQ to assess therapy for diabetes and the experience of patients with their disease over a period of several weeks. The other endpoints were changes of the following items from baseline to the end of the treatment period: fasting plasma glucose, body weight, body mass index (BMI), waist circumference, and leptin.
Data on the endpoints were obtained at baseline, and after 1, 3, 6, and 12 months of canagliflozin treatment (FFQg was not assessed at 3 months).
Safety
Adverse events were coded by using the System Organ Classes and Preferred Terms in the Japanese translation of the Medical Dictionary for Regulatory Activities (MedDRA/J) version 20.1. For each adverse event, the severity, causal relationship with the study drug, and outcome were assessed.
Statistical analyses
In regard to patient characteristics, frequencies were calculated for categorical data, whereas descriptive statistics (sample size, mean, and standard deviation [SD]) were determined for numerical variables. Regarding the endpoints, descriptive statistics were calculated for the absolute values and the changes from baseline over time. Comparison between baseline and other time points for FFQg, laboratory tests, and DTSQ were performed with sequential Dunnett's test. In this analysis, the time points and individuals were included in the model with an assumption of homogeneity in error variance and covariance over time. Statistical significance was defined as P < 0.05 (two-sided) and the two-sided 95% confidence interval was also calculated. Analyses were done with SAS 9.4 software.
Results
Disposition of the patients and baseline characteristics
Among 113 patients who provided informed consent to this study, 6 were excluded for violation of the inclusion criteria or for meeting the exclusion criteria. Table 1 lists the characteristics of the remaining 107 subjects. They included 56 men (52.3%) and 51 women (47.7%), with a mean age of 55.3 years. The mean duration of diabetes was 8.9 years, mean body weight was 77.9 kg, and mean BMI was 29.2 kg/m2. In addition, the mean HbA1c was 8.0% (64 mmol/mol), mean fasting blood glucose level was 9.6 mM, and mean eGFR was 83.8 mL/min/1.73 m2.
Profile of the Patients
Data are the mean ± SD, unless otherwise indicated.
BMI, body mass index; SD, standard deviation.
Changes of total energy and macronutrient intake
The effect of canagliflozin on total energy intake and intake of the three macronutrients (carbohydrate, protein, and fat) was assessed over 12 months (Fig. 1 A–D).
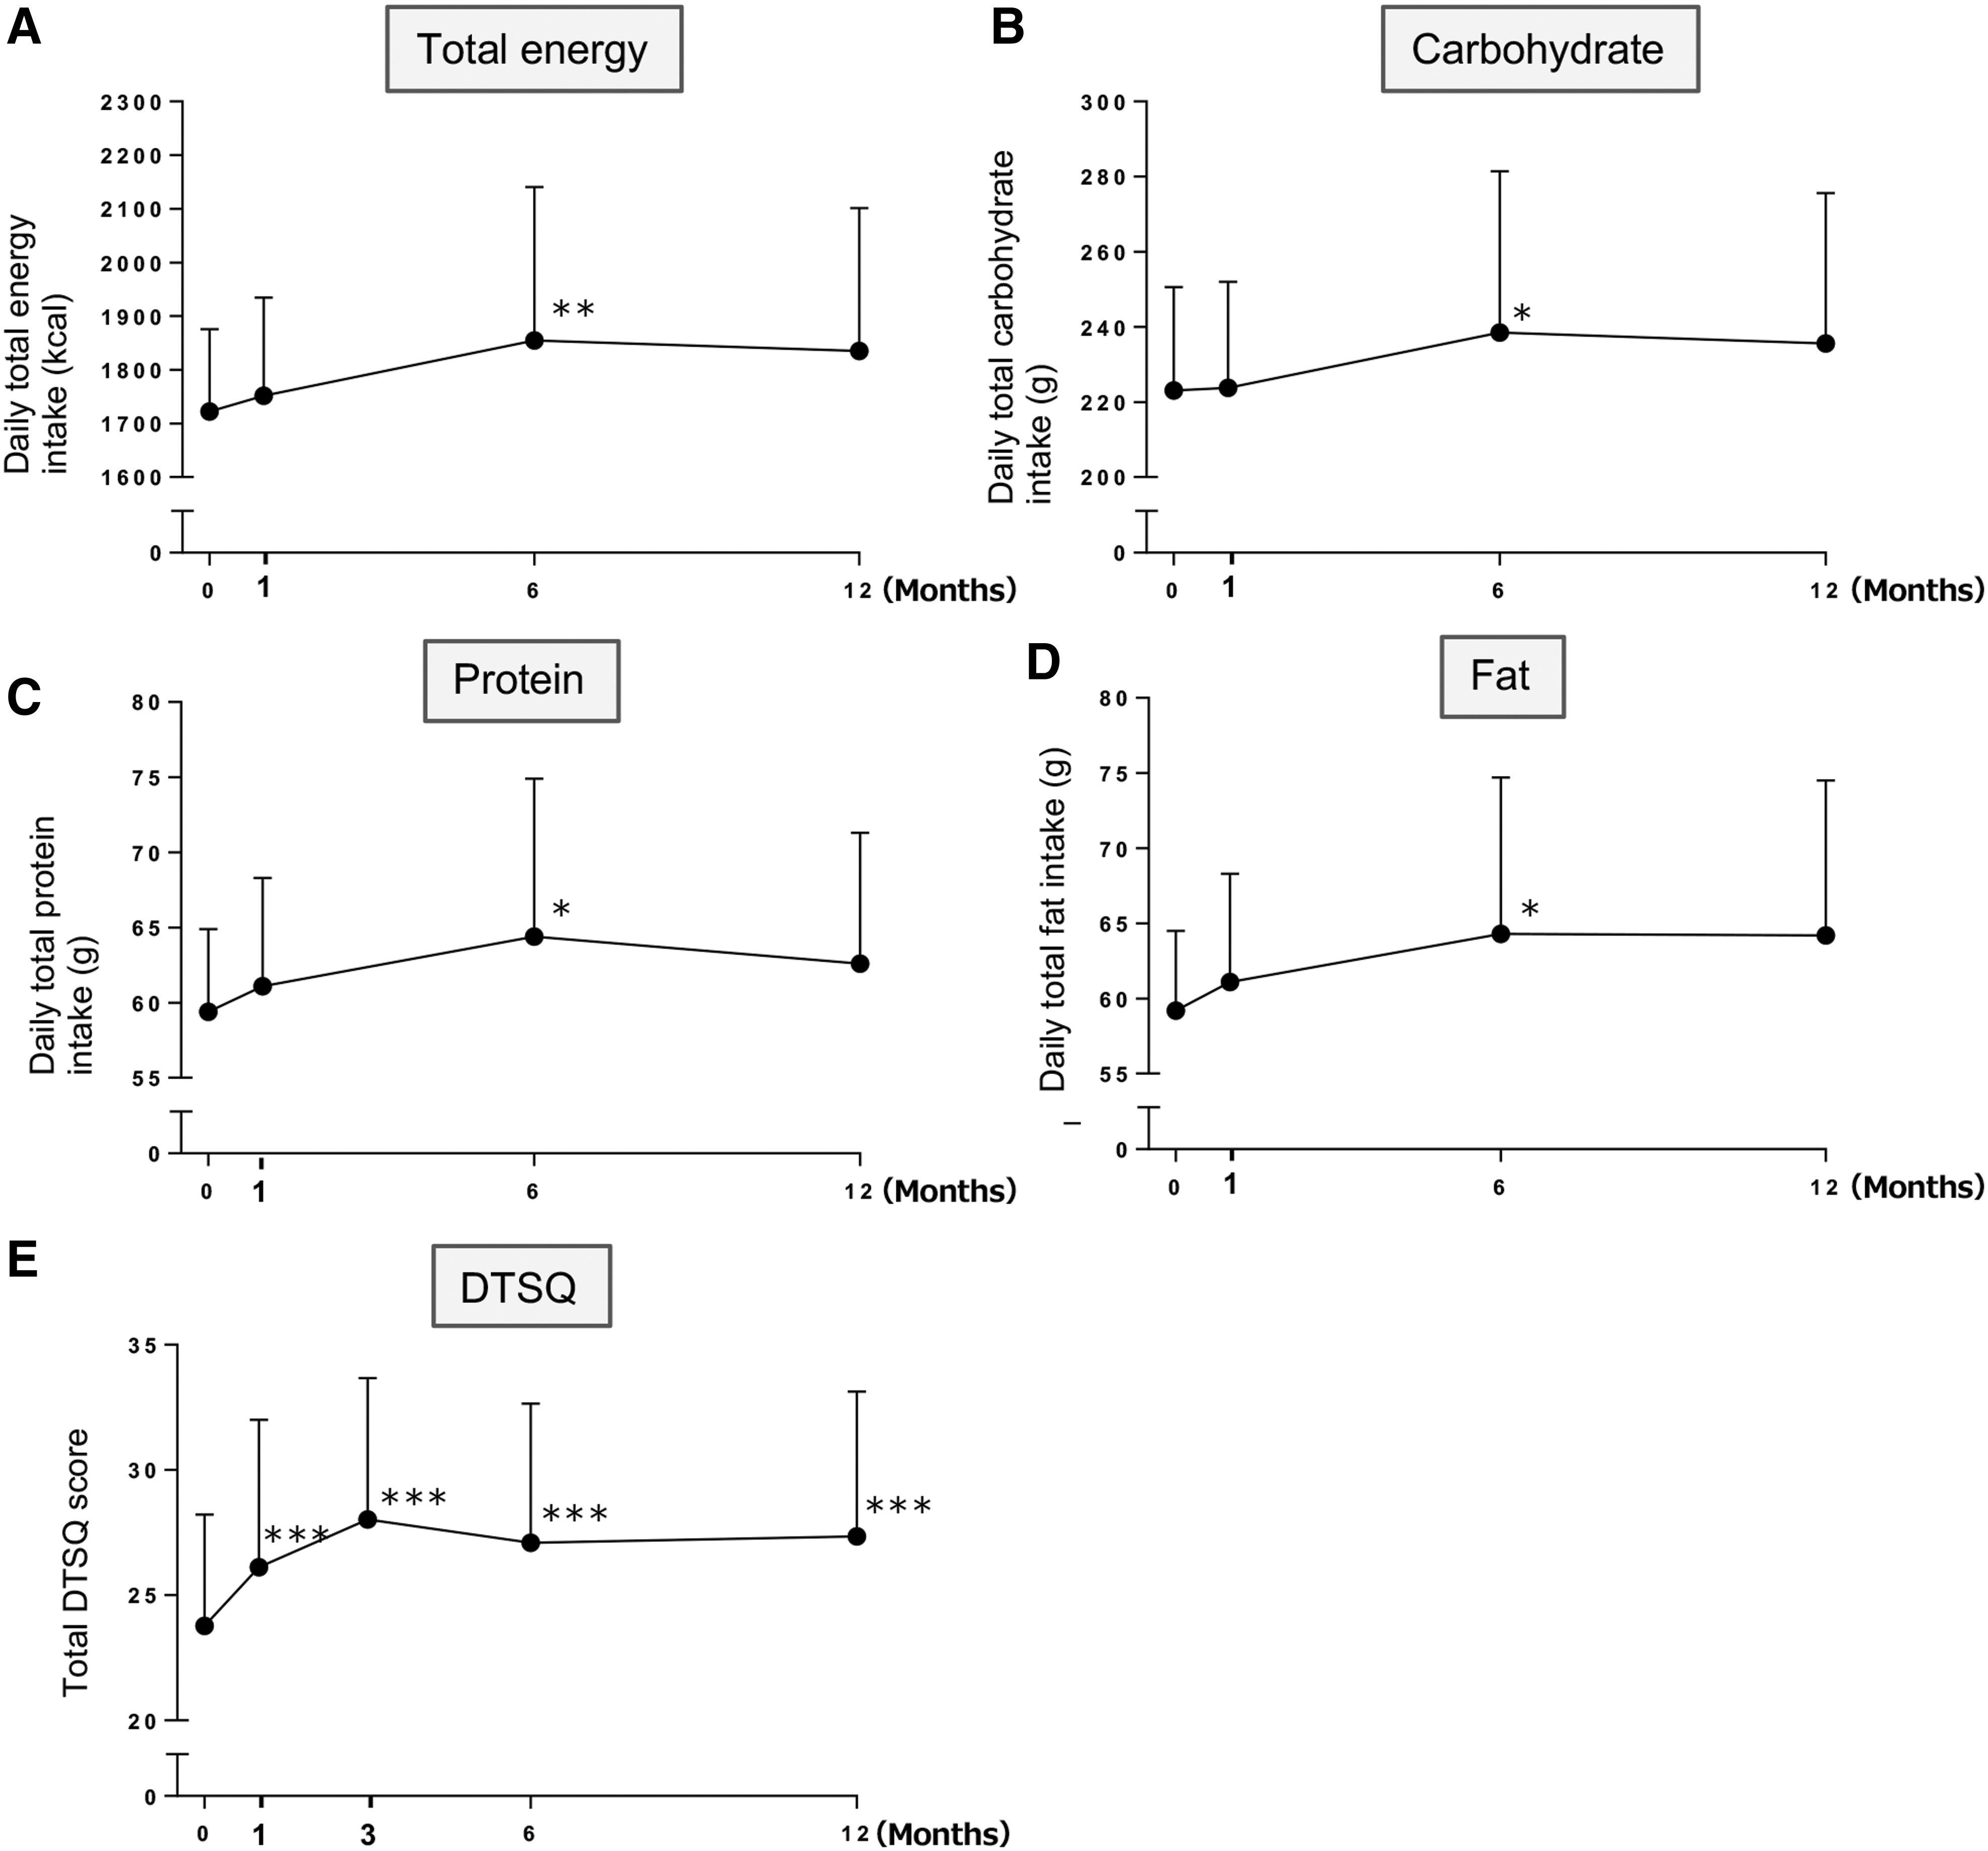
Effect of canagliflozin therapy on total energy intake
Mean total energy intake was 1723 ± 525 kcal/day at baseline and it showed a persistent increase during canagliflozin treatment (increase of 132 kcal at 6 months [P = 0.0058] and 113 kcal at 12 months [P = 0.0516]). The change of total energy intake was not correlated with parameters such as the baseline BMI or eGFR (data not shown). Intake of the three macronutrients (carbohydrate, protein, and fat) was increased after 6 months of canagliflozin treatment (increase of 15.4 g [P = 0.0129], 5.0 g [P = 0.0160], and 5.2 g [P = 0.0314], respectively). The dietary ratios (%) of carbohydrate, protein, and fat were as follows: 55.5:13.9:30.6 at baseline; 55.5:13.9:30.6 after 1 month of canagliflozin therapy; 55.4:13.9:30.7 after 6 months of canagliflozin therapy; and 55.2:13.8:31.0 after 12 months of canagliflozin therapy; No significant change of the ratio was noted at any time.
Regarding the influence on other nutrients, intake of saturated fatty acids and total fatty acids showed a significant increase after 6 months of canagliflozin administration (increase of 1.93 g [P = 0.0155] and 4.67 g [P = 0.0238], respectively), as well as after 12 months (increase of 1.95 g [P = 0.0269] and 4.61 g [P = 0.0356], respectively). In contrast, there were no significant changes in the intake of cholesterol or minerals (Table 2).
Effect of Canagliflozin on Intake of Other Nutrients (Calculated with the Food Frequency Questionnaire)
Data are the mean ± SD.
P < 0.05 versus baseline by Dunnett's step-down test.
With regard to activity and exercise, a significant increase of physical activity was noted after 6 and 12 months of canagliflozin therapy (mean ± SD: 114.11 ± 112.43 metabolic equivalent of tasks (METs)/h at baseline; 140.83 ± 125.82 METs/h at 6 months, P = 0.0088; and 141.28 ± 126.63 METs/h at 12 months, P = 0.0072).
Changes of laboratory and physical parameters
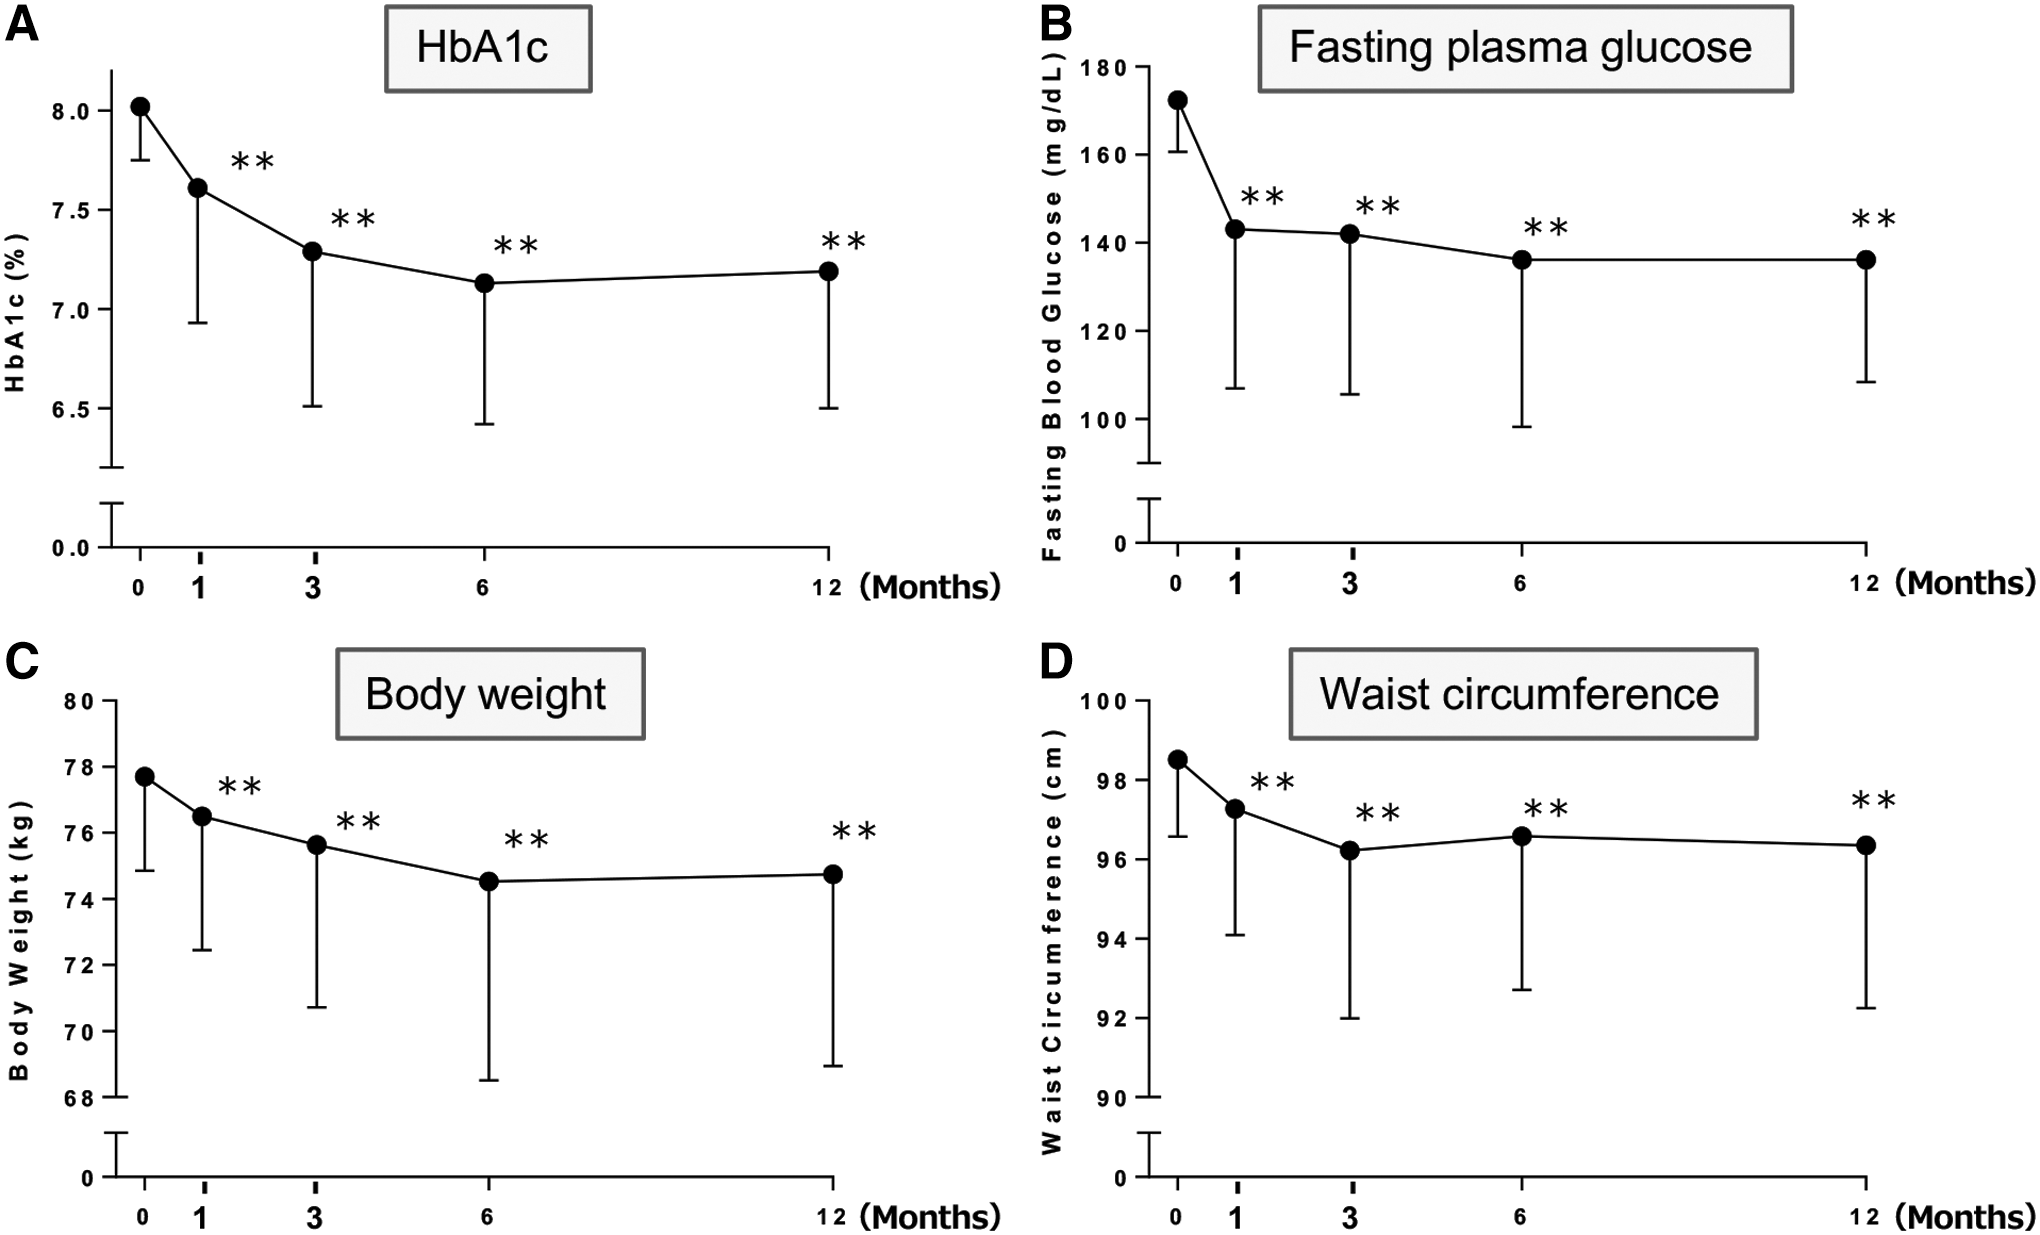
During canagliflozin therapy, significant reduction of HbA1c, fasting plasma glucose, body weight, and waist circumference were observed from 1 to 12 months of administration (Fig. 2). Leptin was decreased significantly from 1 to 6 months of canagliflozin treatment (Supplementary Table S1).
Effect of canagliflozin therapy on HbA1c
DTSQ score
The DTSQ score showed significant improvement up to 12 months of treatment with canagliflozin (23.78 ± 6.53 at baseline and 27.35 ± 5.78 at 12 months, P < 0.0001) (Fig. 1E). Improvement of glycemic control or weight loss after initiation of canagliflozin was not associated with improvement of the DTSQ score (data not shown).
Safety
A total of 56 adverse events were reported in 46 of the 107 patients (43%). The most frequent adverse events were upper respiratory tract infection in 14 patients, common cold in eight patients, polyuria and allergic rhinitis in five patients each, and vaginal candidiasis and genital pruritus in three patients each. Events considered to be related to canagliflozin (adverse reactions) included polyuria in five patients; vaginal candidiasis in three patients; genital pruritus and hunger in two patients each; and urinary urgency, constipation, and renal dysfunction in one patient each. These adverse reactions were all mild and no serious reactions were reported.
Discussion
This study showed that the mean total energy intake of patients with type 2 diabetes was increased by 132 kcal after 6 months of canagliflozin treatment and by 113 kcal after 12 months. These results were consistent with the findings of Ferrannini et al., who reported an increase of total energy intake by ∼200 kcal in patients with type 2 diabetes receiving empagliflozin, although they only estimated the relation of calorie-to-weight changes by using a mathematical model of energy metabolism. 14
The proportions of energy supplied by protein, fat, and carbohydrate in the diet of the patients in the present study were similar to those reported in elderly Japanese patients with type 2 diabetes (fat/carbohydrate: 25.4/59.5% for men and 25.8/58.6% for women) 20 and in the general Japanese population (fat/carbohydrate: 26.7/53.0% for men and 28.7/54.2% for women, 21 or 24.1/55.7% for men and 26.0/57.0% for women 22 ). In our study, assessment of nutrient intake was based on information reported by the patients. However, after the FFQg questionnaire was completed, a dietician reviewed the questionnaire with each subject to improve accuracy. Accordingly, our data on nutrient intake are clinically reasonable based on our approach.
This study revealed that daily intake of the three macronutrients (carbohydrate, protein, and fat) was increased after 6 months of canagliflozin treatment, although the ratio of these macronutrients was unchanged. It was reported that macronutrient intake was not increased after 3 months of dapagliflozin therapy, whereas sucrose intake was increased. 16 The FFQg does not evaluate sucrose intake, so further studies will be required to determine whether this increased sucrose intake was due to differences of the treatment period or the medication.
We found that the serum level of leptin decreased by ∼10% after initiation of canagliflozin therapy. It was previously reported that ipragliflozin or canagliflozin reduced serum leptin, 15,22 and this change was suggested to be associated with reduction of body fat because leptin is secreted by fat cells. Leptin is a hormone that regulates appetite by acting on the hypothalamic feeding center. 23 –25 Hence, elevation of appetite due to a decrease of leptin along with reduction of body fat may help to explain our finding that canagliflozin increased calorie intake without changing the intake ratio of the three macronutrients. Hyperphagia could compensate for loss of calories by urinary glucose excretion, thus limiting the reduction of body weight. It is important for diet therapy to provide all essential nutrients in appropriate proportions. Therefore, the appetite-inducing effect of SGLT2 inhibitors may not be problematic if it only leads to a slight increase in food consumption without dietary imbalance. On the other hand, improved glycemic control and weight loss can be expected if patients follow a strict diet while taking canagliflozin.
Treatment for diabetes should not be evaluated solely on the basis of glycemic control, 26 and we should also consider patient-reported outcomes, including patient satisfaction, health, and quality of life. In this study, the DTSQ score increased during treatment with canagliflozin. Initiation of dapagliflozin therapy was associated with an increase of treatment satisfaction, as determined by the Oral Hypoglycemic Agent Questionnaire, a quality-of-life evaluation method for patients on oral antidiabetic drugs, and this increase of satisfaction was significantly correlated with weight loss. 9 However, we found no relationship between treatment satisfaction and changes of body weight in the present study, possibly due to use of a different questionnaire. It has been suggested that the level of treatment satisfaction shown by the DTSQ is correlated with adherence to medication, 27 so the increase of the DTSQ score after initiation of canagliflozin treatment may be associated with better adherence. Gerlanc et al. also reported that the continuation rate of the weight loss program was increased in patients with weight loss of 10 pounds or more in a study on canagliflozin. They also reported that due to the weight loss, increases were observed in the achievement rate of good outcome, the interest level for self-management of diabetes, and satisfaction with canagliflozin treatment. 10 Improvement of treatment satisfaction may also promote long-term stabilization of blood glucose and reduce the risk of diabetic complications. 27
This study had several limitations. First, there was no control group and it was not a double-blind trial because this study was performed in the primary care setting and it was considered to be difficult to set an appropriate control group. Second, daily measurement of urinary glucose excretion was not performed, so detailed changes of the energy balance could not be elucidated. Third, our data suggested a relationship between the changes of total calorie intake and body weight, but further studies will be required to clarify the underlying mechanism. Fourth, the sample size for some endpoints was small, and data were not obtained at one or some of the time points in some patients. Fifth, the study population was restricted to Japanese patients. Sixth, evaluations of food intake and activity depended on patient self-reporting. The patients completed questionnaires at home. At the time of the hospital visit, a nutritionist checked the questionnaires and asked each patient about details of their answers in the questionnaires. Although the final scores in the questionnaires were determined based on the opinion of two people (the patient and a nutritionist), the values were not determined using instruments or laboratory evaluation. Therefore, the self-reported data may not have been accurate.
In conclusion, patients with type 2 diabetes showed an increase of total calorie intake with no change in the intake ratio of the three macronutrients during canagliflozin therapy. Despite elevation of the calorie intake, glycemic control improved, weight loss was achieved, and satisfaction of the subjects with treatment of diabetes also increased.
Footnotes
Author Contributions
I.M. and A.K. were involved in the acquisition and analysis of data and wrote the first draft of the article. I.M. designed the study. A.K. was involved in the statistical analysis. I.M. and A.K. performed the model analysis. All authors reviewed and edited the article. I.M. is the guarantor of this work and, as such, had full access to all the data in the study and takes responsibility for the integrity of the data and the accuracy of the data analysis.
Acknowledgments
The CANA-K study is being conducted by the Kanagawa Physicians Association. The authors would like to thank all physicians and staff members of the Association, as well as all patients participating in this research.
Author Disclosure Statement
This study was funded by Mitsubishi Tanabe Pharma Corporation. However, the sponsor had no role in study design; collection, analysis, and interpretation of data; writing of the article; and the decision to submit the article for publication.
I.M. has received research grant support from Mitsubishi Tanabe Pharma Corporation. No other competing financial interests exist.
Funding Information
This study was funded by Mitsubishi Tanabe Pharma Corporation.
Supplementary Material
Supplementary Table S1
References
Supplementary Material
Please find the following supplemental material available below.
For Open Access articles published under a Creative Commons License, all supplemental material carries the same license as the article it is associated with.
For non-Open Access articles published, all supplemental material carries a non-exclusive license, and permission requests for re-use of supplemental material or any part of supplemental material shall be sent directly to the copyright owner as specified in the copyright notice associated with the article.