
Abstract
Background:
The glycemia risk index (GRI) is a novel composite continuous glucose monitoring (CGM) metric that gives greater weight to hypoglycemia than to hyperglycemia and to extreme hypo/hyperglycemia over less extreme hypo/hyperglycemia. This study aimed at validating the effectiveness of GRI and at comparing it with time in range (TIR) in assessing glycemic quality in clinical practice.
Methods:
A total of 524 ninety-day CGM tracings of 194 insulin-treated adults with diabetes were included in the analysis. GRI was assessed according to standard metrics in ambulatory glucose profiles. Both cross-sectional and longitudinal analyses were performed to compare the GRI and TIR.
Results:
The GRI was strongly correlated not only with TIR (r = −0.974), but also with the coefficient of variation (r = 0.683). To identify whether the GRI differed by hypoglycemia even with a similar TIR, CGM tracings were grouped according to TIR (50% to <60%, 60% to <70%, 70% to <80%, and ≥80%). In each TIR group, the GRI increased as time below range (TBR)<70 mg/dL increased (P < 0.001 for all TIR groups). In longitudinal analysis, as TBR<70 mg/dL improved, the GRI improved significantly (P = 0.003) whereas TIR did not (P = 0.704). Both GRI and TIR improved as time above range (TAR)>180 mg/dL improved (P < 0.001 for both). The longitudinal change was easily identifiable on a GRI grid.
Conclusions:
The GRI is a useful tool for assessing glycemic quality in clinical practice and reflects hypoglycemia better than does TIR.
Background
The growing popularity of continuous glucose monitoring (CGM) supports the importance of CGM data for assessing the quality of glycemia, including hypoglycemia and hyperglycemia. 1,2 In comparison, monitoring glycated hemoglobin (HbA1c) does not provide a measure of hypoglycemia or glycemic variability. 3 –6
The standard CGM metrics of an ambulatory glucose profile (AGP) include the percentage time in range (TIR); percentage times in very-low-glucose hypoglycemia (VLow), low-glucose hypoglycemia (Low), high-glucose hyperglycemia (High), and very-high-glucose hyperglycemia (VHigh); and mean glucose (MG) level, as well as a glucose management indicator (GMI) and coefficient of variation (CV). 4 All these metrics should be assessed simultaneously, but it may be difficult for clinicians to interpret CGM data quickly enough in a clinical setting. 7,8
TIR has been proposed as a single representative CGM metric of glycemic control. 4 However, using TIR alone can lead clinicians to ignore other important glycemic information, including hypoglycemia. 8 Several composite metrics have been proposed to assess glycemic quality. 9 –11 However, due to complexities in calculation, most parameters are difficult to use in clinical practice. 12 –14 The glycemia risk index (GRI) is a novel composite CGM metric of glycemic risk based on 330 clinical experts' rankings of CGM tracings from 225 insulin-treated adults with diabetes. 1
The GRI assigns greater weight to hypoglycemia than to hyperglycemia and to extreme hypoglycemia or hyperglycemia than to less extreme hypoglycemia or hyperglycemia. Recent studies reported that GRI, as well as TIR, was associated with diabetic complications such as albuminuria and diabetic retinopathy in type 2 diabetes. 15,16
This study aimed at validating the effectiveness of the GRI in assessing glycemic quality in clinical practice. We aimed at identifying whether GRI could reflect the risk of hypoglycemia better than other CGM metrics, especially TIR.
Methods
Data source and study population
We used a dataset of 90-day CGM tracings from an observational cohort comprising insulin-treated adults with diabetes at Samsung Medical Center (a tertiary hospital), in Seoul, Republic of Korea, from January 2019 to December 2022. Individuals using Dexcom G5 or G6 (Dexcom, San Diego, CA) were included in the analysis. Calibration was recommended for Dexcom G5 users twice a day. For Dexcom G6 users, correction was not routinely recommended but was performed if desired. The patients visited the clinic every 90 days, and a maximum of four 90-day CGM tracings per individual (from visit 1 to visit 4) was collected, providing 1 year of CGM tracings.
Supplementary Figure S1 depicts a flow diagram of the case-selection process. Initially, 675 CGM tracings were identified. Tracings with a sensor wear time <70% (n = 76) were excluded, as were those from individuals with an estimated glomerular filtration rate <30 mL/min/1.73 m2 or an HbA1c level ≥10% and from those for whom these data points were missing (n = 75). Ultimately, 524 CGM tracings from 194 patients were used in the analysis.
This study was approved by the Institutional Review Board (IRB) of Samsung Medical Center (IRB No. 2018-07-132). All participants provided written informed consent.
CGM metrics and the GRI
The standard CGM metrics of AGPs, including the percentage of values in the 70 to 180 mg/dL range (TIR), values <54 mg/dL (VLow), values 54 to <70 mg/dL (Low), values <70 mg/dL (time below range [TBR]<70 mg/dL; VLow+Low), values >180 to 250 mg/dL (High), values >250 mg/dL (VHigh), and values >180 mg/dL (time above range [TAR]>180 mg/dL; VHigh+High), MG, GMI, CV, and the percentage of sensor wear time, were identified.
The GRI and its hypoglycemia and hyperglycemia components were calculated as: 1
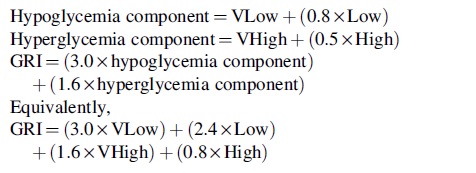
The hypoglycemia and hyperglycemia components of GRI were displayed on a two-dimensional plot called a GRI grid. The hypoglycemia component was displayed on the horizontal axis and the hyperglycemia component on the vertical axis. A set of diagonal lines divided the graph into five glycemia risk zones (A to E) according to GRI score (A: 0–20; B: 21–40; C: 41–60; D: 61–80; E: 81–100). Zone A represented the best glycemic control, and zone E the worst quality of glycemic control.
In addition, we compared GRI with other composite CGM metrics in measuring the overall quality of glycemic control, 17 including composite continuous glucose monitoring index (COGI), 18 glycemic risk assessment diabetes equation (GRADE), 13 and blood glucose risk index (BGRI). 19 The BGRI is calculated as the sum of low blood glucose index (LBGI) and high blood glucose index (HBGI). 19 The GRADE, BGRI, LBGI, and HBGI were calculated if the original blood glucose measurements were available (n = 482).
Statistical analysis
Data are presented as mean ± standard deviation for continuous variables with a normal distribution or as median (interquartile range [IQR]) for continuous variables with a skewed distribution. Categorical variables are presented as number and percentage (%). We conducted both cross-sectional and longitudinal analyses. Details of each analysis are described next.
All statistical analyses were performed in R version 4.2.2 (R Foundation for Statistical Computing,
Cross-sectional analysis
The CGM metrics of 524 tracings were compared according to TBR<70 mg/dL (<4% vs. ≥4%) by Student's t-test, Wilcoxon rank sum test, or chi-square test and were displayed on a GRI grid with the median and IQR of hypoglycemia and hyperglycemia components. These metrics were also compared according to TIR (<50%, 50% to <60%, 60% to <70%, 70% to <80%, and ≥80%).
We investigated the associations between the GRI and CGM metrics. Linear regression analyses were carried out for the GRI and TIR as well as between the GRI and CV. In addition, the GRI, hypoglycemia component, and hyperglycemia component according to quartiles of CV, TBR<70 mg/dL, MG, TIR, and TAR>180 mg/dL were compared using Jonckheere-Terpstra tests.
To identify whether the GRI differed by hypoglycemia even with a similar TIR, CGM tracings were grouped according to TIR (50% to <60%, 60% to <70%, 70% to <80%, and ≥80%). In each TIR group, TIR, GRI and its hypoglycemia and hyperglycemia components, COGI, GRADE, and BGRI were compared according to quartile of TBR<70 mg/dL using one-way analysis of variance or Kruskal–Wallis tests. P-values for trends were obtained using Jonckheere-Terpstra tests. The ratio of the index in the fourth quartile for TBR<70 mg/dL relative to that in the first quartile for TBR<70 mg/dL was also calculated. In addition, GRI was compared based on achievement of recommended hypoglycemia target level (TBR<70 mg/dL < 4% and VLow <1%) on CGM tracings in each TIR group.
Longitudinal analysis
In longitudinal analyses, CGM tracings were paired (pre- and post-). Possible combinations of paired CGMs were tracings of visits 1 and 2, 1 and 3, 1 and 4, 2 and 3, 2 and 4, and 3 and 4. We selected CGM tracings with a pre-TBR<70 mg/dL ≥ 4% and then subdivided the pairs into those showing improvement in TBR<70 mg/dL and those not showing improvement in TBR<70 mg/dL. Improvement was defined as pre-TBR<70 mg/dL > post-TBR<70 mg/dL.
Changes in the CGM metrics including GRI and TIR were compared according to improvement of TBR<70 mg/dL using paired t-test or Wilcoxon signed rank test. Similarly, CGM tracings with pre-TAR>180 mg/dL ≥ 25% were selected and compared according to improvement in TAR>180 mg/dL (defined as pre-TAR>180 mg/dL > post-TAR>180 mg/dL). In addition, we selected four subjects showing marked improvement in TBR<70 mg/dL and analyzed their CGM tracings of every visit (visits 1, 2, 3, and 4) on GRI grids.
Results
Baseline characteristics and the GRI of CGM tracings
Supplementary Table S1 lists the baseline characteristics of the 194 study participants. The mean age was 43.9 ± 15.3 years, and 83 of the 194 (43%) were male. Most of the participants (191/194, 98.5%) had type 1 diabetes (T1D), and the mean HbA1c level was 6.8% ± 0.9%. The median duration of diabetes was 9 years (IQR = 3–19). Most of the participants (185/194, 95.4%) received multiple daily insulin injections (MDIs), and nine participants (4.6%) were users of insulin pumps.
Table 1 shows the CGM metrics of the 524 CGM tracings. The mean TIR and CV were 68.6% ± 17.4% and 34.2% ± 6.1%, respectively, and the median sensor wear time was 93.5% (IQR = 87.3–96.8). The mean and median GRI score was 36.6 ± 21.4 and 32.8 (IQR = 19.1–51.9), respectively. Regarding the GRI zone, zone B was the most common (33.8%), followed by zone A (26.5%), zone C (23.7%), zone D (12.4%), and zone E (3.6%).
Continuous Glucose Monitoring Metrics According to Time Below Range Category (N = 524)
Data are presented as mean ± SD or median [IQR] for continuous variables and as number (%) for categorical variables.
P-value by Student's t-test, Wilcoxon rank sum test, or chi-square test for comparison between TBR<70mg/dL ≥ 4% and TBR<70mg/dL < 4%. P-values <0.001 are displayed in scientific notation, with values truncated at a minimum of 1.0E-50.
CGM, continuous glucose monitoring; CV, coefficient of variation; GMI, glucose management indicator; GRI, glycemia risk index; High, high-glucose hyperglycemia (>180–250 mg/dL); IQR, interquartile range; Low, low-glucose hypoglycemia (54 to <70 mg/dL); MG, mean glucose; SD; standard deviation; TAR, time above range (>180 mg/dL); TBR, time below range (<70 mg/dL); TIR, time in range (70–180 mg/dL); VHigh, very-high-glucose hyperglycemia (>250 mg/dL); VLow, very-low-glucose hypoglycemia (<54 mg/dL).
The CGM tracings were categorized according to TBR<70 mg/dL (<4% vs. ≥4%). Those of TBR<70 mg/dL ≥ 4% had a higher GRI (38.3 [IQR = 27.2–48.9] vs. 31.2 [IQR = 17.5–53.0], P = 0.032) despite a higher TIR (71.7% ± 12.5% vs. 67.7% ± 18.4%, P = 0.031). Figure 1 shows the GRI grid of 524 tracings according to TBR<70 mg/dL (<4% vs. ≥4%).

GRI grid for 524 CGM tracings. CGM, continuous glucose monitoring; GRI, glycemia risk index; IQR, interquartile range; TBR, time below range.
The AGP metrics of CGM tracings categorized by TIR (<50%, 50% to <60%, 60% to <70%, 70% to <80%, and ≥80%) are listed in Supplementary Table S2. As TIR increased, the GRI decreased (P for trend = 0.001), as did the GRI zone. However, the TIR category was not equal to the GRI zone. Excluding TIR <50%, two GRI zones per TIR group were observed.
Differences in the hypoglycemia and hyperglycemia components led to different GRI zones, even with a similar TIR. For example, in the group of TIR 50% to <60%, subjects in zone C had lower VLow (zone C: 0.2 [IQR = 0.0–0.6] vs. zone D: 2.6 [IQR = 1.8–5.2]; P < 0.001) and Low (zone C: 1.2 [IQR = 0.6–2.3] vs. zone D: 5.2 [IQR = 3.3–6.7]; P < 0.001) than those in zone D.
Associations between the GRI and other CGM metrics
To investigate the relationship between the GRI and TIR or CV, we performed linear regression analyses (Fig. 2). The GRI was strongly negatively correlated with TIR (r = −0.974, R 2 = 0.949, P < 0.001; Fig. 2A) and positively correlated with CV (r = 0.683, R 2 = 0.467, P < 0.001; Fig. 2B).

Linear regression analyses of GRI with
Figure 2A also shows that GRI increased with hypoglycemia. With the same TIR, the GRI was higher in TBR<70 mg/dL ≥ 4% than in TBR<70 mg/dL < 4%. Meanwhile, the GRI was higher in TBR<70 mg/dL < 4% with the same CV (Fig. 2B), probably because CGM tracings of TBR<70 mg/dL < 4% having CVs equal to those of TBR<70 mg/dL ≥ 4% indicate more severe hyperglycemia.
Supplementary Figure S2 depicts a GRI grid according to quartiles of CV, TBR<70 mg/dL, TIR, TAR>180 mg/dL, and MG. The GRI grid of TIR quartiles was more similar to the GRI grid of TAR quartiles or MG quartiles than to the GRI grid of TBR quartiles or CV quartiles, suggesting that TIR was more closely associated with hyperglycemia than with hypoglycemia.
This was confirmed by correlation analyses between CGM metrics (Supplementary Table S3). TIR was strongly associated with High (r = −0.884, P < 0.001) and VHigh (r = −0.914, P < 0.001), but it showed weak association with Low (r = 0.183, P < 0.001) and was not significantly associated with VLow (r = −0.059, P = 0.179).
GRI differed by hypoglycemia even with a similar TIR
To identify whether the GRI differed by hypoglycemia despite a similar TIR, CGM tracings were grouped according to TIR (50% to <60%, 60% to <70%, 70% to <80%, and ≥80%) (Table 2). In each TIR group, the GRI was assessed according to quartile of TBR<70 mg/dL.
Continuous Glucose Monitoring Metrics According to Quartile of TBR< 70 mg/d L with Time in Range of (A) 50% to <60%, (B) 60% to <70%, (C) 70% to <80%, and (D) ≥80%
Data are presented as mean ± SD. P-values <0.001 are displayed in scientific notation, with values truncated at a minimum of 1.0E-50.
P-value by one-way analysis of variance or Kruskal–Wallis test.
P-value by Jonckheere-Terpstra test.
The ratio is calculated as the mean index in Q4/the mean index in Q1.
Hypoglycemia component of GRI.
Hyperglycemia component of GRI.
GRADE and BGRI were calculated only if the original blood glucose measurements were available. (A) N = 70, (B) N = 88, (C) N = 97, (D) N = 147.
BGRI, blood glucose risk index; COGI, composite continuous glucose monitoring index; GRADE, glycemic risk assessment diabetes equation.
The GRI increased as TBR<70 mg/dL increased in every TIR group (P < 0.001 for all), whereas TIR did not differ by TBR<70 mg/dL quartile. The GRI increased as TBR<70 mg/dL and the hypoglycemia component increased, even though the hyperglycemia component decreased as TBR<70 mg/dL increased. The COGI and GRADE were also significantly different according to quartile of TBR<70 mg/dL, but BGRI were not.
When we calculated the ratio of the index in the fourth quartile for TBR<70 mg/dL relative to that in the first quartile for TBR<70 mg/dL, the ratios of the hypoglycemia component of GRI ranged from 15.0 to 22.3, whereas the ratios of COGI, GRADE, and BGRI ranged from 0.7 to 1.1.
In addition, GRI was compared based on achievement of recommended hypoglycemia target level (TBR<70 mg/dL < 4% and VLow <1%) in each TIR group (Supplementary Table S4). While TIR did not show differences according to the achievement of the hypoglycemia target, GRI exhibited significant differences in every TIR group (P < 0.001 for all). COGI and GRADE also showed differences, whereas BGRI did not.
Longitudinal analysis of the GRI
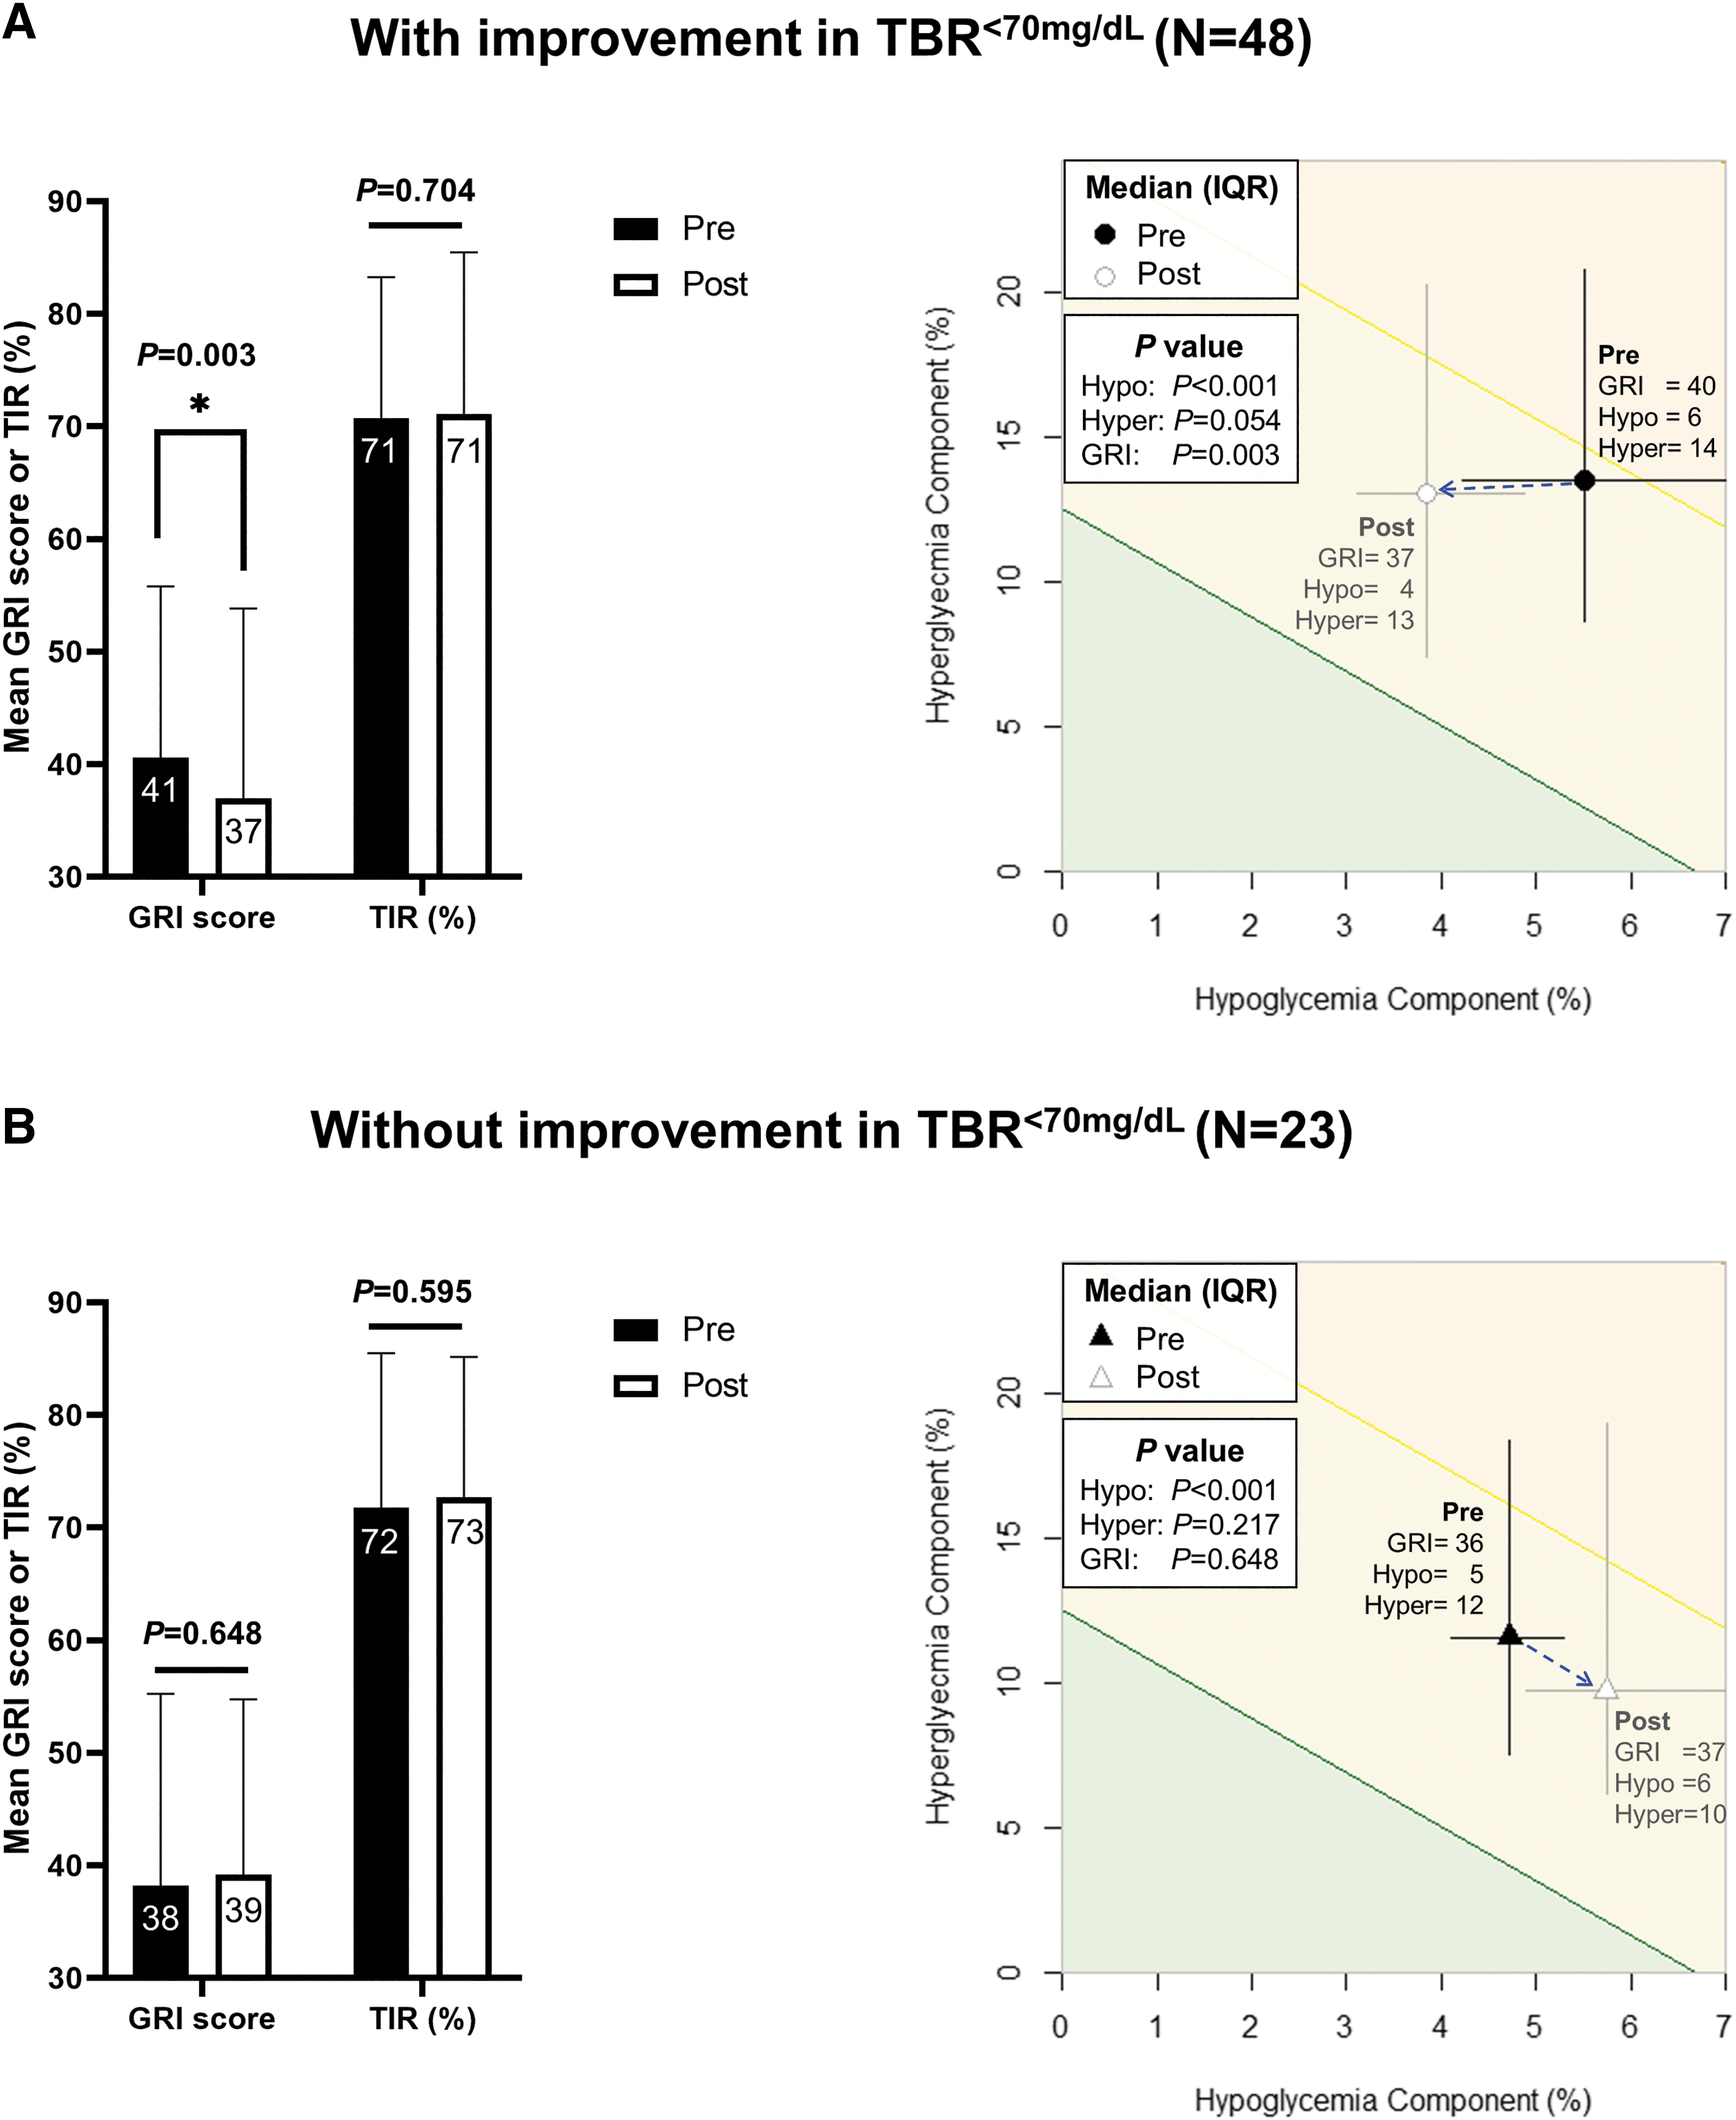
In longitudinal analyses, CGM tracings were paired (pre- and post-). The changes in CGM metrics according to improvement in TBR<70 mg/dL among CGM tracings with a pre-TBR<70 mg/dL ≥ 4% were assessed. As TBR<70 mg/dL improved (Fig. 3A and Table 3; n = 48), the GRI improved significantly from 40.6 ± 15.2 to 37.0 ± 16.9 (P = 0.003), whereas TIR did not improve (from 70.7% ± 12.5% to 71.1% ± 14.4%, P = 0.704). COGI and LBGI also significantly improved (P < 0.001 for both), but GRADE and BGRI did not.
Comparison of patients
Comparison of Continuous Glucose Monitoring Metrics in Subjects Showing Improvement in TBR< 70 mg/d L During Follow-Up (N = 48)
Data are presented as mean ± SD or median [IQR].
P-value by paired t-test or Wilcoxon signed rank test. P-values <0.001 are displayed in scientific notation.
GRADE, BGRI, LBGI, and HBGI were calculated only if the original blood glucose measurements were available (N = 40).
HBGI, high blood glucose index; LBGI, low blood glucose index.
In CGM pairs without improvement in TBR<70 mg/dL (Fig. 3B and Supplementary Table S5; n = 23), neither the GRI (from 35.7 [IQR = 27.5–45.5] to 37.5 [IQR = 29.0–49.8], P = 0.648) nor TIR (from 71.7% ± 13.7% to 72.7% ± 12.5%, P = 0.595) were significantly different. However, in the GRI grid, a significant increase in the hypoglycemia component was identified, from 4.7% [IQR = 4.1–5.3] to 5.7% [IQR = 4.9–7.3] (P < 0.001).
The GRI also reflected well changes in TAR>180 mg/dL among CGM tracings with pre-TAR>180 mg/dL ≥ 25% (Supplementary Fig. S3). Both the GRI and TIR improved as TAR>180 mg/dL improved (P < 0.001 for both).
Next, we selected four subjects showing marked improvements in TBR<70 mg/dL and traced their CGM tracings on GRI grids (Supplementary Fig. S4). All subjects received repeated education including the importance of avoiding hypoglycemia and were encouraged to use “Urgent Low Soon” alarms to warn them in advance of hypoglycemic events. In all subjects, changes in CGM metrics were easily identifiable on the GRI grids.
Discussion
In this study, we validated the effectiveness of GRI in assessing glycemic quality in clinical practice. The GRI was strongly negatively correlated with TIR and positively correlated with the CV. The GRI better reflected hypoglycemia than did TIR alone, and the longitudinal changes of CGM tracings were easily tracked by GRI grids.
TIR is a useful CGM metric for assessing glycemic quality 4,20 –24 ; however, it does not weigh hypoglycemia as more important than hyperglycemia, as do experienced clinicians (TIR = 100–VLow–Low–VHigh−High). 1 In contrast, GRI can assess both hypoglycemia and hyperglycemia by assigning more weight to hypoglycemia.
GRI also gives more weight to very-low-glucose hypoglycemia than to low-glucose hypoglycemia and more weight to very-high-glucose hyperglycemia than to high-glucose hyperglycemia. When experienced clinicians ranked the glycemic quality of CGM tracings, the GRI was more strongly correlated with the clinician ranking than TIR was (TIR: R 2 = 0.824, GRI: R 2 = 0.904; P < 0.001). 1
In our study, the GRI exhibited a strong correlation with TIR (r = −0.974) but reflected hypoglycemia better than did TIR. Although the CGM tracings of TBR<70 mg/dL ≥ 4% (which also had a higher CV) showed a strong correlation with TIR, they produced higher GRI scores compared with that of TBR<70 mg/dL < 4%, which indicates worse glycemic quality. In contrast, they showed higher TIR, which can be interpreted as superior glycemic quality if other metrics are not considered. When the GRI and TIR were compared according to TBR quartile in similar TIR groups, the GRI differed whereas the TIR did not. Moreover, GRI could differentiate whether the CGM tracings met the recommended target of TBR within similar TIR groups. In addition, the GRI demonstrated a stronger correlation with the CV (r = 0.683) than did TIR (r = −0.606).
The GRI well reflected the longitudinal improvement of hypoglycemia. As TBR improved, GRI improved significantly, whereas TIR did not. For example, in subject 4 shown in Supplementary Figure S4, TIR only improved by 3% (from 89% to 92%) as TBR improved, whereas the GRI decreased from 26 (zone B) to 13 (zone A). The GRI also well reflected the longitudinal improvement of hyperglycemia. Similarly, Karakus et al. reported that GRI prominently represented improvements in severe hypoglycemia and hyperglycemia after automated insulin delivery system initiation. 25 Benhamou et al. found that the improvement in GRI (13.2) exceeded that of TIR (5.1%) after switching from an open-loop to a closed-loop insulin delivery system. 26
In addition, GRI can be visualized on a grid, allowing clinicians and patients to easily recognize both hypoglycemia and hyperglycemia components. The advantage of a graphical display of CGM metrics was noted by Rodbard. 27 In our study, the longitudinal change of CGM tracings was more easily identified on the GRI grid than by the GRI score alone. For the pair of CGM tracings without TBR improvement (Fig. 3B), neither TIR nor GRI score showed statistically significant changes, but change was easily identified on GRI grids, showing significant worsening in the hypoglycemia component.
We compared GRI with other composite metrics that measure overall glycemic quality, including COGI, GRADE, and BGRI. The COGI and GRADE also well reflected hypoglycemia, whereas the BGRI did not. Among these metrics, the hypoglycemia component of GRI was especially sensitive to hypoglycemia irrespective of the TIR. In Table 2, the ratio of the hypoglycemia component in the fourth quartile of TBR relative to that in the first quartile ranged from 15.0 to 22.3, whereas ratios of COGI, GRADE, and BGRI ranged from 0.7 to 1.1.
Another difference between GRI and other indices is that GRI is calculated with standard CGM metrics, whereas GRADE, BGRI, LBGI, and HBGI are calculated with all observed glucose values.
Of note, the hypoglycemia component of GRI was strongly correlated with LBGI (r = 0.923, P < 0.001), and the hyperglycemia component of GRI was strongly correlated with HBGI (r = 0.973, P < 0.001). Although BGRI did not sensitively reflect hypoglycemia, LBGI did.
To the best of our knowledge, this is the first study to compare the GRI with TIR and other composite metrics in clinical practice, using both cross-sectional and longitudinal analyses. As GRI is not yet commonly used in clinical practice, our study validates its usefulness for assessing glycemia quality. We also confirmed that the GRI can be applied to Asian patients.
Another strength of this study is that analyses were based only on tracings of real-time CGM, which are generally more accurate than intermittently scanned CGM. 28 Moreover, we used a CGM data duration of 90 days with a high completeness level.
This study has several limitations. First, the percentages of hypoglycemia and extreme hypoglycemia were low in our dataset, which may not be optimal to demonstrate the advantages of GRI in reflecting hypoglycemia. Compared with CGM tracings used to develop the GRI, 1,29 –32 the proportion of the hypoglycemia component of our dataset was lower than that of the T1D MDI or T1D pump group (Supplementary Fig. S5). Nonetheless, we confirmed the effectiveness of GRI to reflect hypoglycemia with this dataset.
Second, our dataset could not represent the T1D MDI population, raising the need for subsequent studies in a large, representative population. Third, since most of the subjects had T1D, the results might be different in a population mainly composed of those with type 2 diabetes.
In conclusion, the GRI was effective for assessing glycemic quality in clinical practice. The GRI is strongly correlated with TIR but reflects hypoglycemia better than does TIR alone. Longitudinal changes in hypoglycemia and hyperglycemia can be easily identified on a GRI grid.
Footnotes
Authors' Contributions
J.Y.K., J.H.Y., and J.H.K. contributed to the design of the study. J.Y.K., J.H.Y., and J.H.K. conducted data collection. J.Y.K. conducted the analyses. J.Y.K., J.H.Y., and J.H.K. interpreted the results. J.Y.K. wrote the initial draft of the manuscript, with revisions by all authors. The final manuscript was approved by all authors. J.H.Y., J.Y.K., and J.H.K. are the guarantors of this work.
Author Disclosure Statement
No competing financial interests exist.
Funding Information
This work was supported by the Korean Endocrine Society Big Data Research Fund 2022 and a grant from the Korean Medical Device Development Fund funded by the Korea government (Ministry of Science and ICT, Ministry of Trade, Industry and Energy, Ministry of Health & Welfare, Ministry of Food and Drug Safety) (Grant No. RS-2022-00141116). The funders played no role in the design and conduct of the study, analysis, interpretation of data, review, or approval of the manuscript.
Supplementary Material
Supplementary Figure S1
Supplementary Figure S2
Supplementary Figure S3
Supplementary Figure S4
Supplementary Figure S5
Supplementary Table S1
Supplementary Table S2
Supplementary Table S3
Supplementary Table S4
Supplementary Table S5
References
Supplementary Material
Please find the following supplemental material available below.
For Open Access articles published under a Creative Commons License, all supplemental material carries the same license as the article it is associated with.
For non-Open Access articles published, all supplemental material carries a non-exclusive license, and permission requests for re-use of supplemental material or any part of supplemental material shall be sent directly to the copyright owner as specified in the copyright notice associated with the article.