




Abstract
The interaction of a novel mixed ligand copper (II) complex, [Cu(N-N)(L)(EtOH)](NO3)2 · 2H2O, in which N-N indicates 2,9-dimethyl-1,10-phenanthroline and L indicates N,N-dimethyltrimethylenediamine with calf thymus DNA was investigated by absorption, circular dichroism, voltammetric, and viscosimetric techniques. The absorption spectra of the complex with calf thymus DNA showed a marked hypochromism in the π → π* and metal to ligand charge transfer (MLCT) transitions, with no obvious red shift attributed to a partial intercalation. The intrinsic binding constant (K b) was determined as 2 × 10⁵ M−1. There was slight to appreciable changes in the relative viscosity of DNA, which is consistent with enhanced hydrophobic interaction of the methyl-substituted phen ring and partial intercalation mode of binding. Electrochemical studies showed a decrease in the peak current, which is ascribed to the strong binding between Cu (II) complex and DNA. The fluorescence spectral characteristics showed that the Cu (II) complex is able to displace the methylene blue bound to DNA, but not as complete as intercalative molecules. It is remarkable that this mixed ligand complex, in contrast to [Cu(2,9-dmp)2]+ (2,9-dmp = 2,9-dimethyl-1,10-phenanthroline), which fails to cleave DNA, has ability to cleave the supercoiled plasmid DNA.
Introduction
Therefore, to design improved drugs that target cellular DNA, to understand the mechanism of action at the molecular level, and also to investigate the effect of mixed ligands on the structure and conformation of DNA, we used a new water-soluble copper (II) complex, [Cu(N-N)(L)(EtOH)](NO3)2 · 2H2O, in which N-N indicates 2,9-dimethyl-1,10-phenanthroline and L indicates N,N-dimethyltrimethylenediamine (Shahabadi and Maghsudi, 2009), and binding studies of this potential drug complex, [Cu(N-N)(L)(EtOH)](NO3)2, with calf thymus DNA (CT-DNA) were carried out by electronic absorption spectroscopy, florescence spectroscopy, cyclic voltammetric, circular dichroic spectral, and viscosity measurements.
The biological importances of this system are as follows: (i) the existence of copper (II) ion, which is supposed to play an important role in biological systems, such as toxicity against microorganisms, especially to protozoa, fungi, and algae, and also has antiseptic properties (Malik et al., 1979); (ii) the existence of 2,9-dimethyl-1,10-phenanthroline ligand, whose complexes possess interesting anticancer properties (Papadia et al., 2005); and (iii) this system containing mixed ligands and this kind of complexes play key roles in some biological processes (Sigel, 1975).
Materials and Methods
Materials
N,N-Dimethyltrimethylenediamine (L), ethylenediaminetetraacetic acid (EDTA), Tris-HCl, NaOH, sodium dodecyl sulphate, potassium acetate, chloroform, isoamylalcohol, methylene blue (MB), dimethyl sulfoxide (DMSO), KI, MeOH, sucrose, and agarose were purchased from Merck (Darmstadt, Germany). 2,9-Dimethyl-1,10-phenanthroline was purchased from Riedel-deHaën (Hanover, Germany). RNase A was purchased from Roche (Bielefeld, Germany). Doubly distilled deionized water was used throughout the experiment. Highly polymerized CT-DNA and HEPES buffer were purchased from Sigma. Plasmid DNA (pUC18) was extracted from Escherichia coli.
Experiments were carried out in HEPES buffer at pH 7.2. Solutions of CT-DNA gave an UV absorbance ratio (260 over 280 nm) of more than 1.8, indicating that the DNA was sufficiently free of protein. The stock solution of CT-DNA was prepared by dissolving DNA in 10 mM HEPES buffer at pH 7.2. The DNA concentration (monomer units) of the stock solution (1 × 10⁻² M per nucleotide) was determined by UV spectrophotometry in properly diluted samples using a molar absorption coefficient of 6600 M−1 cm−1 at 258 nm (Kennedy and Bryant, 1986). The stock solutions were stored at 4°C and used within 4 days.
Synthesis of copper (II) complex
The Cu (II) complex [Cu(N-N)(L)(EtOH)](NO3)2 · 2H2O, in which N-N indicates 2,9-dimethyl-1,10-phenanthroline and L indicates N,N-dimethyltrimethylenediamine, was synthesized by a previously reported procedure (Shahabadi and Maghsudi, 2009). (Fig. 1)

Structure of the [Cu(2,9-dimethyl-phenanthroline)(N,N-dimethyltrimethylene diamine)(EtOH)](NO3)2 · 2H2O complex.
Analytical data (%) for CuC21H35N6O9, found (calculated): C, 44.1 (43.56); H, 6.5 (6.11); N, 14.9 (14.51). 1H NMR (200 MHz, CDCl3): aromatic dinitrogen ligand: 8.48 (d, 2H), 8.01 (s, 2H), 7.75 (d, 2H), 2.39 (s, 6H); aliphatic diamine ligand: 2.46 (s, 6H), 0.87 (t, 2H), 1.21 (t, 2H), 1.28 (q, 2H), 4.17 (br NH2). 13C NMR (200 MHz, CDCl3): aromatic dinitrogen ligand: 125.61, 127.64, 128.79, 130.95, 143.03, 157.62 (six carbon atoms of phen ligand), 25.88 (Me groups of phen ligand); aliphatic dinitrogen ligand: 22.96, 29.68, 25.88, 14.06 (three carbon atoms and Me groups, respectively).
Isolation of plasmid DNA and gel electrophoresis
A pure culture of E. coli plasmid DNA was incubated at 37°C for 12 h in a nutrient broth containing ampicillin. The broth was harvested after 12 h, centrifuged for 5 min at 4000 rpm, and decanted, and the entire medium was drained. The pellet was resuspended in 1 mL SET (sucrose, EDTA, Tris-HCl) buffer by vortexing. A 2 mL solution of NaOH and sodium dodecyl sulphate buffer was added, mixed well, kept on ice for 5 min, and then 1.5 mL of potassium acetate solution (5 M) was added and mixed immediately. After 5 min, 4.5 mL chloroform:isoamylalcohol (24:1) was added and centrifuged for 10 min at 8000 rpm at 4°C. The supernatant was collected in a new tube, 10 mL of 100% EtOH was added, and centrifuged for 5 min at 10,000 rpm. Then the pellet was washed with 5 mL of 70% EtOH, centrifuged for 5 min at 5000 rpm, and air dried. The pellet was dissolved in Tris-HCl–EDTA (TE) buffer (near 200 μL), 50 μL RNase A (1 mg/mL in TE) was added, and then incubated at 37°C for 1–2 h. The homogeneity of plasmid DNA was checked by gel electrophoresis and stored at −20°C until use. The DNA complex and the solution of plasmid DNA (control) was loaded in 0.8% agarose gel with the addition of 3 μL of loading dye (bromophenol blue). It was allowed to run for 1 h at 80 V. After electrophoresis, the gel was stained with ethidium bromide and photographed under UV light.
Instrumentation
1H NMR spectra were recorded using a Bruker Avance DPX 200 MHz (4.7 tesla) spectrometer (Bruker Rheinstetten, Germany) with CDCl3 as the solvent. The elemental analysis was performed using a Heraeus CHN elemental analyzer. Absorbance spectra were recorded using an HP spectrophotometer (Agilent 8453; Agilent, Santa Clara, CA) equipped with a thermostated bath (Huber Polystat cc1, Huber, Offenburg, Germany). Absorption titration experiments were conducted by keeping the concentration of Cu (II) complex constant (5 × 10⁻⁵ M) while varying the DNA concentration from 0 to 3.5 × 10⁻⁴ M (r i = [DNA]/[Cu (II) complex] = 0–7). Absorbance values were recorded after each successive addition of DNA solution, followed by an equilibration period.
CD measurements were recorded on a JASCO (J-810) spectropolarimeter (JASCO, Osaka, Japan) by keeping the concentration of DNA constant (8 × 10⁻⁵ M) while varying the Cu (II) complex concentration from 0 to 8 × 10⁻⁶ M (r i = [Cu (II) complex]/[DNA] = 0.0, 0.005, 0.03, 0.07, and 0.1).
Viscosity measurements were made using a viscosimeter (SCHOTT AVS 450, SCHOTT, Mainz, Germany), which was maintained at 25°C ± 0.5°C using a constant temperature bath. The DNA concentration was fixed at 5 × 10⁻⁵ M, and flow time was measured with a digital stopwatch. The mean values of three replicated measurements were used to evaluate the viscosity η of the samples. The values for relative specific viscosity (η/η 0)1/3, where η 0 and η are the specific viscosity contributions of DNA in the absence (η 0) and in the presence of the Cu (II) complex (η), respectively, were plotted against r i (r i = [DNA]/[Cu (II) complex]).
The cyclic voltammetry, linear sweep voltammetry, and differential pulse voltammetry (DPV) measurements were performed using an AUTOLAB model (PGSTAT C; Filderstadt, Germany), with a three-electrode system: a 0.10-cm-diameter glassy carbon disk as working electrode, an Ag/AgCl electrode as reference electrode, and a Pt wire as counter electrode. Electrochemical experiments were carried out in a 25-mL voltammetric cell at RT. All potentials are referred to the Ag/AgCl reference. Their surfaces were freshly polished with 0.05-mm alumina prior to each experiment and were rinsed using double-distilled water between each polishing step. The supporting electrolyte was 10 mM HEPES buffer solution (pH 7.2), which was prepared with double-distilled water. Cyclic voltametry (CV) and DPV measurements were recorded by keeping the concentration of Cu (II) complex constant (5 × 10⁻⁴ M) while varying the DNA concentration from 0 to 7.86 × 10⁻⁵ in CV measurements and from 0 to 7.88 × 10⁻⁵ M in DPV measurements. The current potential curves and experimental data were recorded on the software GPES (Ni et al., 2006; Kashanian et al., 2008).
Fluorescence measurements were carried out with a JASCO spectrofluorimeter (FP 6200). DNA (5 × 10⁻⁵ M) was pretreated with MB (5 × 10⁻⁶ M) for 30 min. Then Cu (II) complex was added to this mixture (from 5 × 10⁻⁵ to 1.5 × 10⁻⁴ M) and diluted to the volume with HEPES buffer, and after the incubation time the effect on emission intensity was measured. The samples were excited at 630 nm and emission was observed between 630 and 680 nm.
Reactions of Cu (II) complex with pUC18 (0.33 mg mL−1) were performed in TE buffer (pH 8) and the contents were incubated for 2 h at 37°C. Concentration dependence studies were performed using Cu (II) complex ratios (r i = [Cu(II) complex]/[DNA] = 0.00, 0.01, 0.03, 0.04 and 0.05). Applying 80 V for 1 h in Tris, Borate, EDTA (TBE) buffer solution with agarose gels (0.8% agarose), the DNA reactions were analyzed. Gel was stained with ethidium bromide and photographed using UV illumination. In control experiments, DMSO, KI, and MeOH were added to reaction mixtures.
Results and Discussion
Electronic spectral studies
The binding of intercalative drugs to DNA helix has been characterized classically through absorption spectral titrations, as a function of added DNA. Complex binding with DNA through intercalation usually results in hypochromism and bathchromism (red shift) due to the intercalative mode involving a strong stacking interaction between an aromatic chromophore and the base pairs of DNA. The extent of the hypochromism commonly parallels the intercalative binding strength.
The absorption spectra of the Cu (II) complex (Fig. 2) displays an intense intraligand π → π* absorption at λ = 274 nm and metal to ligand charge transfer (MLCT) band at λ = 455 nm (Shahabadi and Maghsudi, 2009).
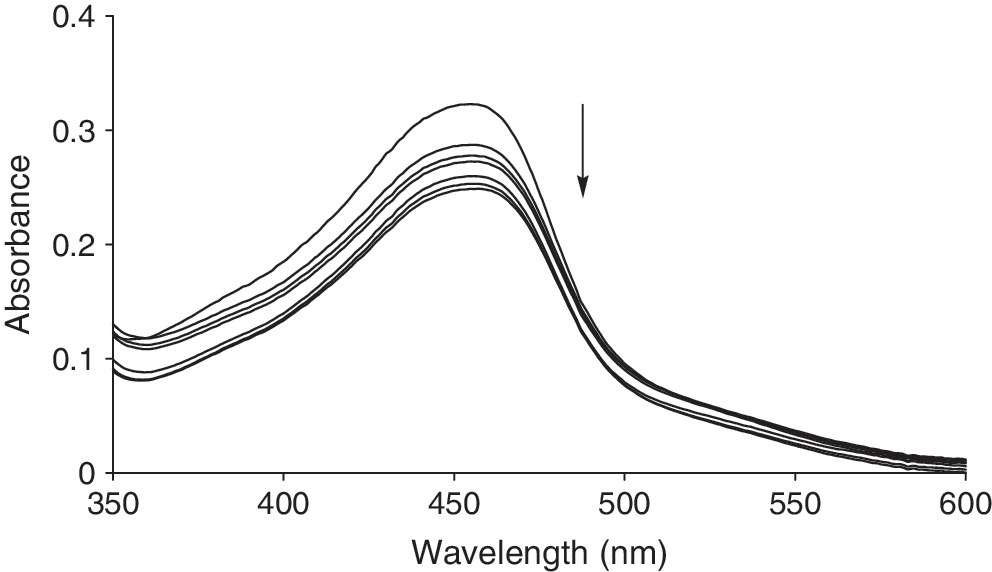
Electronic absorption spectra for the titration of 5.0 × 10⁻⁵ M Cu (II) complex with DNA (r i = 0.00, 1.5, 2, 3, 3.5, 5, and 7). Arrow shows the changes in absorbance after DNA addition.
In the presence of increasing concentrations of CT-DNA, a marked hypochromism in the π → π* and MLCT transitions is apparent with no obvious red shift. The extent of hypochromism in the spectrum at λ = 455 nm was measured using the following equation (% H = 22.97%):
A large degree of hypochromism in the spectrum in the presence of double-helical DNA is a typical characteristic of interactions between DNA and Cu (II) complex, and it arises from the strong stacking interactions between the aromatic chromophore and the base pairs. Strong intercalative binding of small molecules to the DNA are known to cause large bathochromic shifts on the spectral bands (Nair et al., 1998). Therefore, comparing the hypochromism and bathochromism of the titled complex with other complexes (Tan et al., 2005; Tan and Chao, 2007), it was found that it binds to DNA via partial intercalative mode.
To further investigate the intensity of the interaction between the Cu (II) complex and CT-DNA, the intrinsic binding constant, k
b, was calculated using the equation 1 (Wolfe et al., 1987) (Fig. 3).
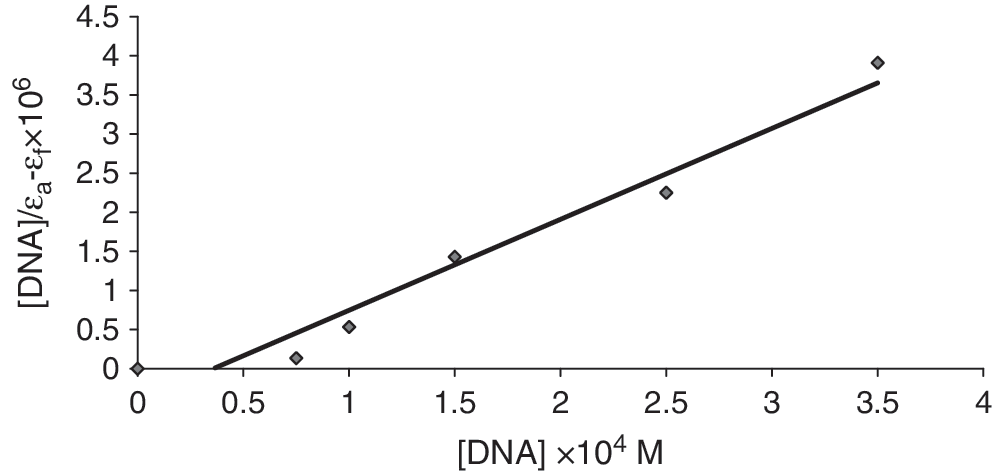
Spectrophotometric titration of Cu (II) complex at 455 nm with calf thymus DNA in HEPES buffer.
where ɛ a, ɛ b, and ɛ f are the apparent, bound, and free complex extinction coefficients, respectively. In particular, ɛ f was determined by a calibration curve of the isolated Cu (II) complex in aqueous solution, following Beer's law. ɛ a was determined as the ratio between the measured absorbance and the Cu (II) complex concentration, A obs/[Cu (II) complex]. A plot of [DNA]/(ɛ a − ɛ f) vs. [DNA] gives a slope of 1/(ɛ b − ɛ f) and a y-intercept equal to 1/K b (ɛ b − ɛ f); K b is the ratio of the slope to the y-intercept (Fig. 3).
The K
b value obtained was 2.9 × 10⁴ M−1. In comparing the intrinsic binding constant (K
b) of the Cu (II) complex with some DNA partial intercalative, such as [Cu(dpq)3](ClO4)2 (7.5 × 10⁴ M−1) (Ramakrishnan and Palaniandavar, 2008), [Cu(phen)3](ClO4)2 (9.6 × 10³ M−1) (Ramakrishnan and Palaniandavar, 2008), homodinuclear macrocyclic complex of copper(II) (4.25 × 10⁴ M−1) (Arjmand and Aziz 2009), the hexaaza macrocyclic copper(II) complex (Cu(II)
Viscosity measurements
In the absence of crystallographic structural data, hydrodynamic measurements, which are sensitive to length changes, are the least ambiguous and most critical tests for confirming a classical intercalation model in solution. A classical intercalative mode causes a significant increase in viscosity for the DNA solution because of the increase in separation of base pairs at intercalation sites and hence an increase in overall DNA length. By contrast, complexes that binds exclusively in the DNA grooves by partial and/or nonclassical intercalation, under the same conditions, typically cause less pronounced (positive or negative) or no change in DNA solution viscosity (Kelly et al., 1985; Meadows et al., 1993). To further explore the binding mode of Cu (II) complex, viscosity measurements were carried out on CT-DNA bound to varying concentrations of Cu (II) complex. The value of the relative specific viscosity (η/η 0)1/3 versus r i (r i = [Cu (II) complex]/[DNA]) was plotted in the absence and presence of Cu (II) complex (Fig. 4). The results showed that it exerts essentially no effect on DNA viscosity, which is indicative of a mode of binding involving partial intercalation.
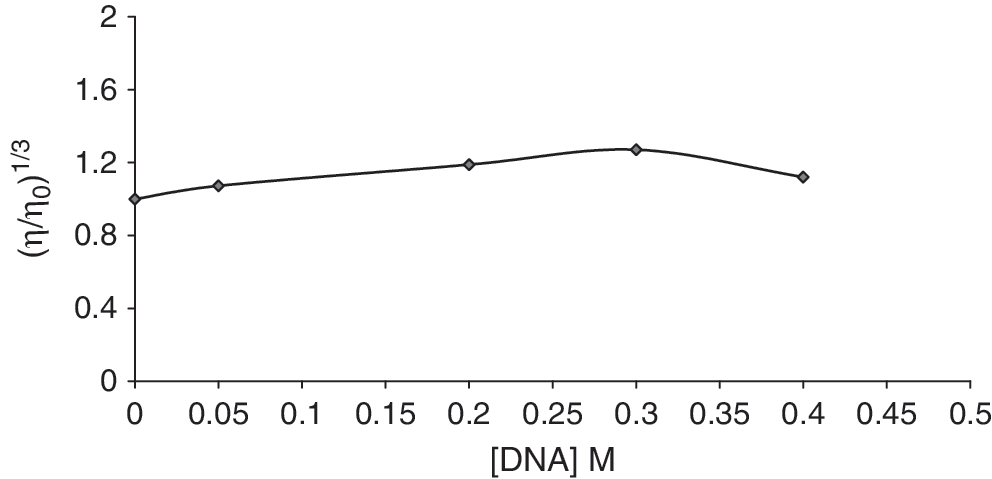
Effect of increasing amounts of Cu (II) complex on the viscosity of calf thymus DNA (5 × 10⁻⁵ M) in 10 mM HEPES buffer (r i = 0, 0.05, 0.2, 0.3, and 0.4).
In addition, some partial intercalators, such as Cu (II) tris(2,2′-bipyridine) (Arias et al., 2009), mixed ligand copper (II) maltolate complexes (Barve et al., 2009) were shown to give the same results like Cu (II) complex.
Electrochemical studies
Recently, electrochemical techniques were used as a simple and rapid method to study DNA interaction with different compounds (Kashanian and Ezzati Nazhad Dolatabadi, 2009, Mahadevan and Palaniandavar, 1998). The cyclic voltammogram of 5 × 10⁻⁴ M Cu (II) complex in the absence and presence of CT-DNA is shown in Figure 5. The cathodic peak potential (E pc) and the anodic peak potential (E pa) in the absence of DNA are 0.398 and 0.542 V, respectively. The formal potential (E 1/2), taken as the average of E pc and E pa, is 0.470 V in the absence of DNA. When CT-DNA was added to a solution of Cu (II) complex, both the anodic and cathodic peak current heights of the Cu (II) complex decreased (Fig. 5). This suggested that there existed interaction between Cu (II) complex and DNA (Liu et al., 2002; Jiao et al., 2005). The decrease in current may be attributed to the diffusion of the complexes bound to the large, slowly diffusing DNA molecule. The decrease in the peak current is ascribed to the strong binding between Cu (II) complex and DNA (Xu et al., 2008).
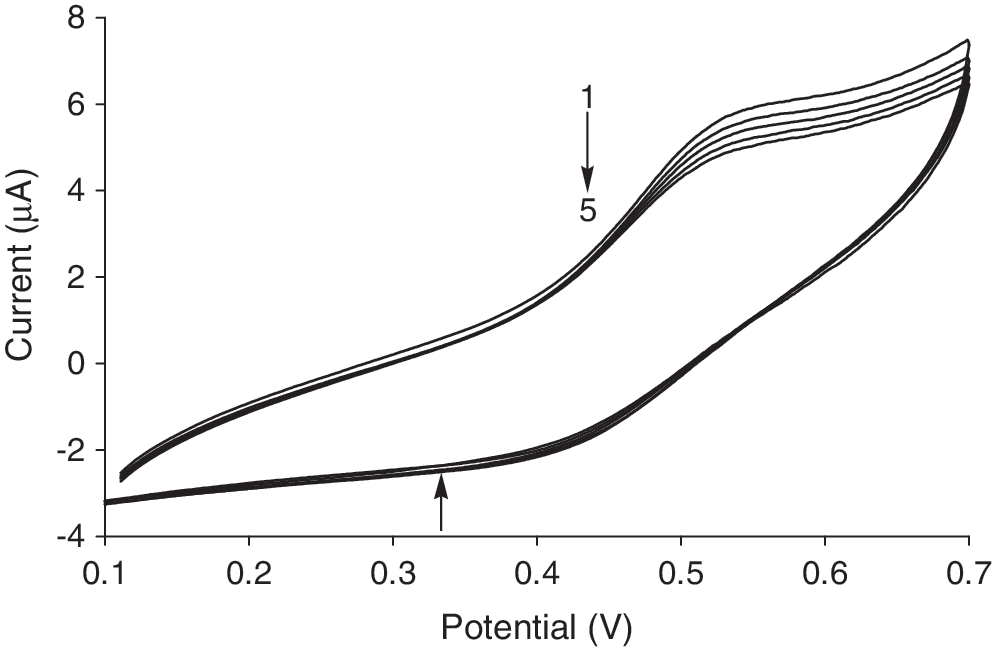
Cyclic voltammograms for Cu (II) complex in the presence of DNA at different concentrations. C Cu (II) complex = 5 × 10⁻⁴ M; C DNA = 0.00, 4.45 × 10⁻⁶, 2.67 × 10⁻⁵, 3.99 × 10⁻⁵, 7.01 × 10⁻⁵, and 7.86 × 10⁻⁵ for curves 1–5, respectively. Arrows show the changes in the cathodic and anodic peak current heights of Cu (II) complex after DNA addition.
Also the Cu (II) complex interaction with DNA at the glassy carbon electrode was followed by DPV (Fig. 6). The voltammograms indicate that the peak current of Cu (II) complex decreased as DNA was added, which was consistent with the results of cyclic voltammetry.
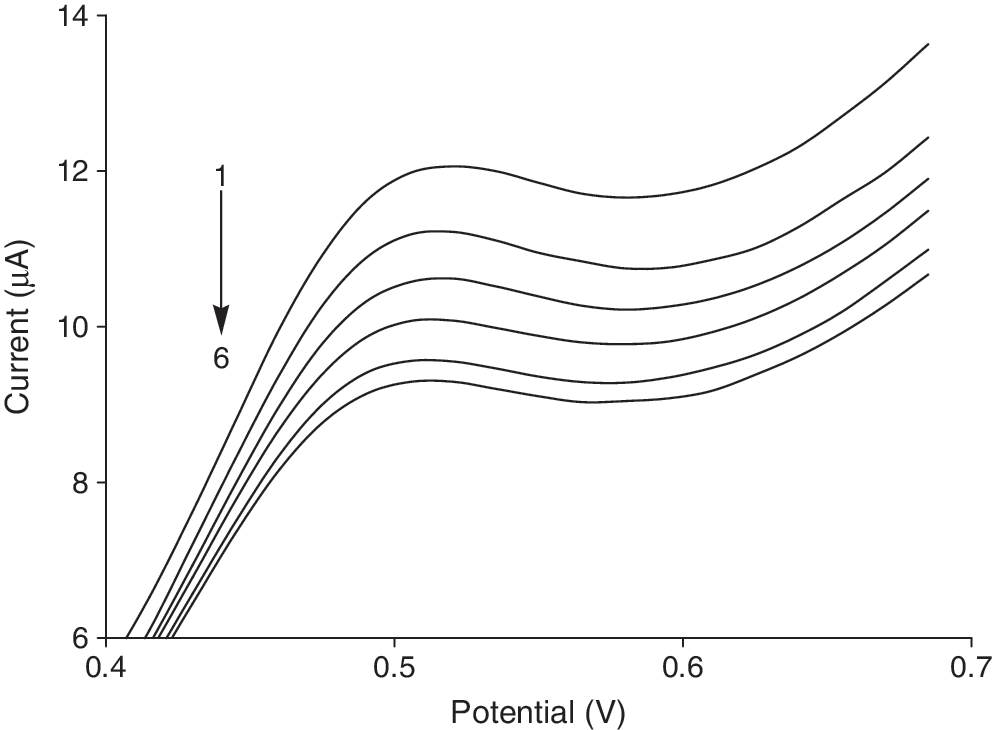
Differential pulse voltammograms for Cu (II) complex (C Cu (II) complex = 5 × 10⁻⁴ M) in the presence of different concentrations of DNA; C DNA = 0.00, 2.23 × 10⁻⁵, 3.55 × 10⁻⁵, 4.88 × 10⁻⁵, 6.5 × 10⁻⁵, and 7.88 × 10⁻⁵ M for curves 1–6, respectively.
Circular dichroic spectral studies
A solution of CT-DNA exhibits a positive band (275 nm) from base stacking interactions and a negative band (245 nm) from the right-handed helicity of DNA (Lincoln et al., 1997). Classical intercalation reactions tend to enhance the intensities of both bands because of strong base stacking interactions and stable DNA conformations (right-handed B conformation of CT-DNA), whereas simple groove binding and electrostatic interactions with small molecules show less of a perturbation or no perturbation whatsoever on the base stacking and helicity bands (Norden and Tjerneld, 1982).
The interaction between the Cu (II) complex and CT-DNA was studied using circular dichroism (CD) spectroscopy (Fig. 7). This complex showed changes in both the positive and negative bands, which are characteristic of partial intercalative interaction of the heterocyclic rings of the complex. The observed increase and decrease, respectively, in the positive and negative bands is consistent with a B to A conformational change (Rajendiran et al., 2007).
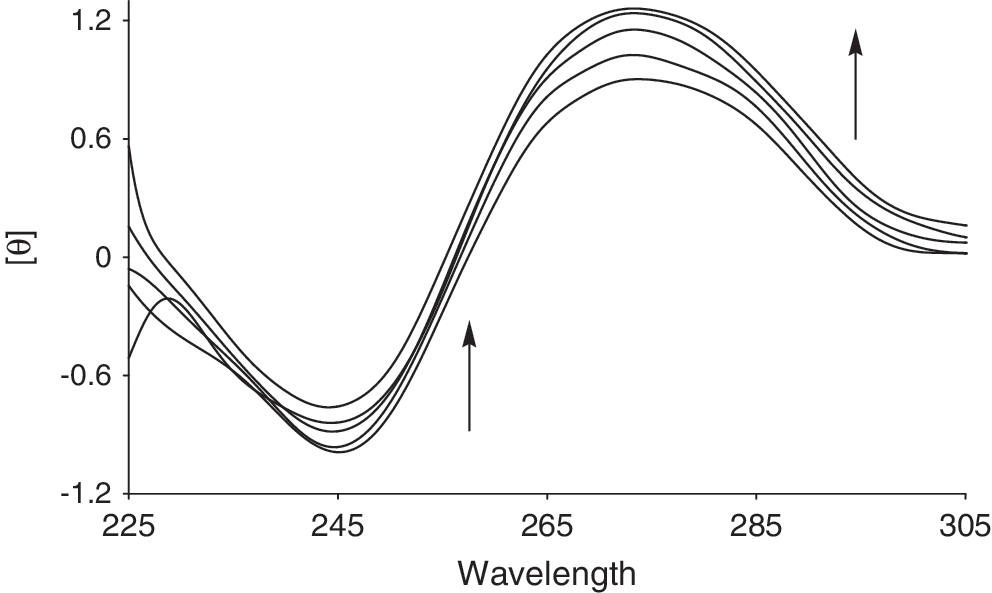
Circular dichroism spectra of DNA (8.0 × 10⁻⁵ M) in 10 mM HEPES buffer in the presence of increasing amounts of Cu (II) complex (r i = [Cu (II) complex]/[DNA] = 0.0, 0.005, 0.03, 0.07, and 0.1). Arrows show the changes after Cu (II) complex addition.
Fluorescence studies (competitive binding studies)
To further clarify the nature of the interaction between Cu (II) complex and DNA, competitive MB displacement assay studies were undertaken. The experiment involves the addition of the present complex to CT-DNA pretreated with MB as a fluorescence probe ([DNA]/[MB] = 10). Interestingly, the emission intensity of MB is quenched on adding CT-DNA. This emission quenching phenomenon reflects the change in the excited state structure in consequence of the electronic interaction in the MB–DNA complexes (Long and Barton, 1990). The emission quenching phenomenon and the hypochromic and red shift effects in the absorption spectra fit the intercalative mode of MB to DNA.
The emission spectra of the MB–DNA solutions in the presence of increasing amounts of Cu (II) concentrations (r i = 1–3) is shown in Figure 8, which clearly reveals an increase in the fluorescence intensity of the probe molecule on adding the Cu (II) complex. In the case of the highest concentration of Cu (II) complex, the emission intensity of the MB–DNA complex could not approach that of pure MB. The increase in fluorescence intensity should be due to a greater amount of free MB molecules in solution. Considering that MB molecules have been already intercalated into the DNA helix, these results indicate that some MB molecules are released from the DNA nucleobases after addition of the Cu (II) complex. That is, the formation of metal complex–DNA prevents the binding of MB. The increase in fluorescence intensity and the extent of MB release are applied to compare the strength of binding. Figure 8 shows that our complex could not release MB completely. Therefore, this experiment confirms our previous theories and reconfirms our prior evidence-based conclusions.
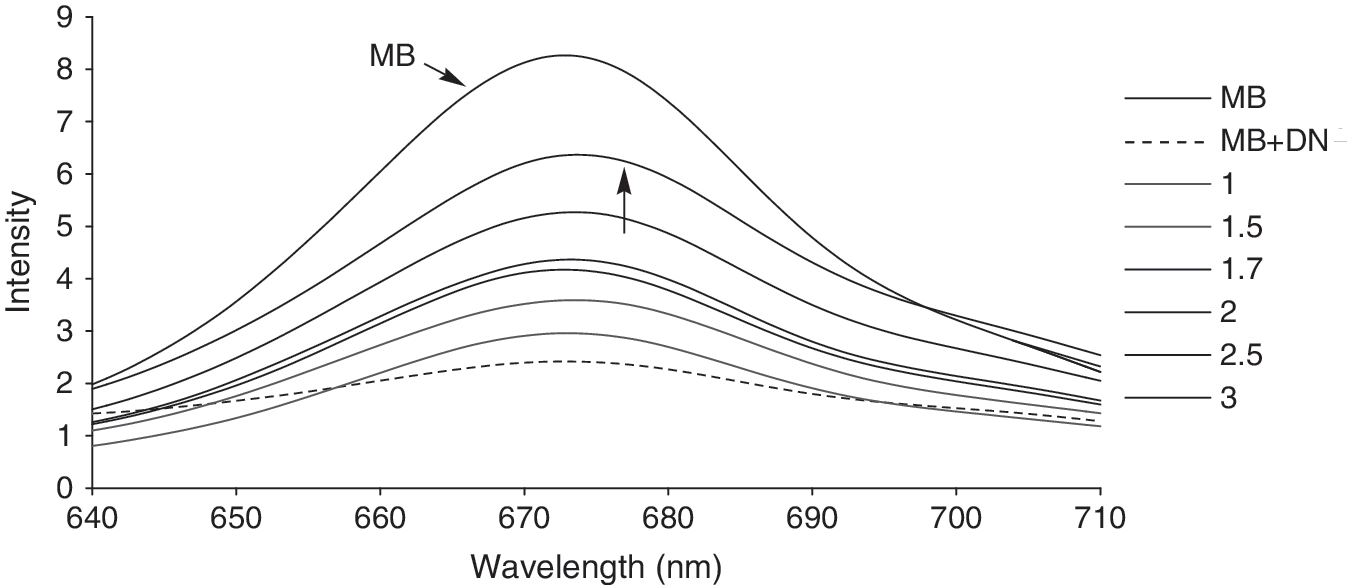
Emission spectra of MB–DNA complexes in the presence of increasing amounts of Cu (II) complex (r i = [complex]/[DNA] = 0.0 (MB + DNA), 1, 1.5, 1.7, 2.0, 2.5, and 3). MB, methylene blue. Arrows show the emission spectrum of MB solution and the changes in the DNA emission spectrum after Cu (II) complex addition.
Cleavage of pUC18 DNA Cu (II) complex
Transition metal-mediated radical production may result in efficient DNA cleavage. DNA cleavage was controlled by relaxation of the supercoiled circular form of pUC18 into the nicked circular and linear forms. When circular plasmid DNA is run on horizontal gel using electrophoresis, the fastest migration will be observed for the supercoiled form (Form I). If one strand is cleaved, the supercoils will relax to produce a slower-moving open circular form (Form II). If both strands are cleaved, a linear form (Form III) will be generated, which migrates in between.
The ability of Cu (II) complex to perform DNA cleavage is generally monitored by agarose gel electrophoresis and the pUC18 plasmid DNA is involved. Agarose gel electrophoresis is shown in Figure 9. As shown in this figure, two clear bands were observed for the control in which the Cu (II) complex was absent (lane 0). The relatively fast migration is the intact supercoil form (Form I) and the slower moving migration is the open circular form (Form II), which was generated from the supercoiled form when scission occurred on its one strand (Patra et al., 2005; Gao et al., 2006). The Cu (II) complex at different concentrations is able to perform cleavage of pUC18 plasmid DNA (lanes 1, 2, 3, and 4; Fig. 9). The amount of Form I diminished gradually and partly converted to Form II, whereas the intensity of the Form II band increased as the concentration of the Cu (II) complex increased. It is obvious that the Cu (II) complex has ability to cleave the supercoiled plasmid DNA and this cleavage system does not require addition of any external agents. In control experiments, radical scavengers such as DMSO, KI, and MeOH were added to the reaction mixtures, which did not show any apparent effect on the DNA cleavage activity. These observations suggested that DNA cleavage reaction did not proceed via radical mechanism and indicated the hydrolytic nature of the cleavage. Further studies on the reaction mechanism are in progress.
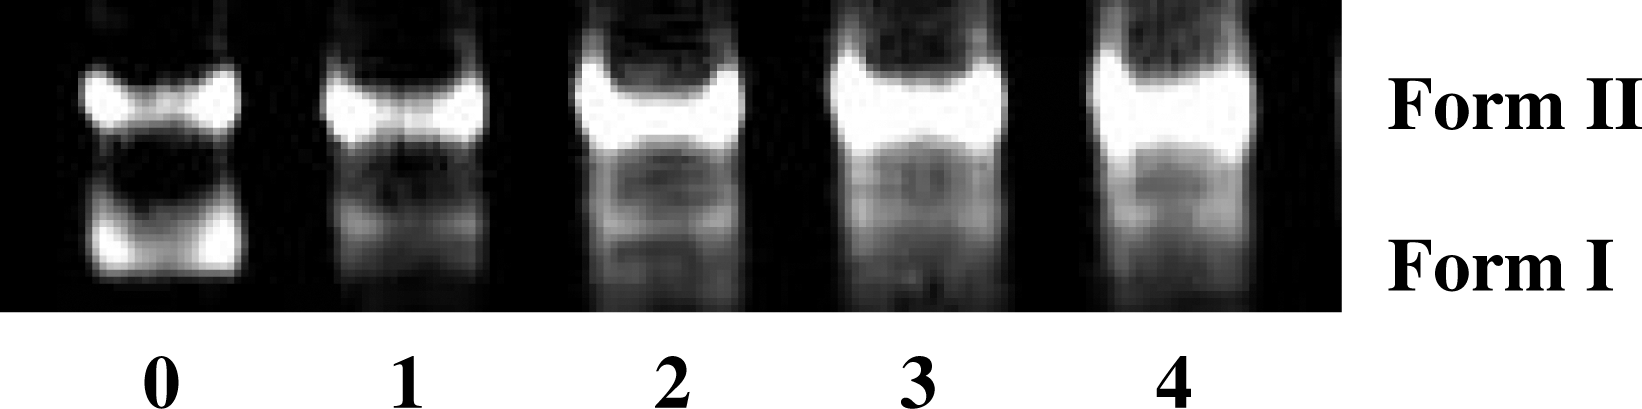
Cleavage of pUC18 DNA in the presence of increasing amounts of Cu (II) complex (r i = [Cu(II) complex]/[DNA] = 0.00, 0.01, 0.03, 0.04, and 0.05): lane 0 was DNA alone (r i = 0.00), lane 1 (r i = 0.01), lane 2 (r i = 0.03), lane 3 (r i = 0.04), and lane 4 (r i = 0.05).
Conclusion
We examined the interaction of a water-soluble Cu (II) complex to CT-DNA and found sufficient evidence for its binding mode. We view this as a significant finding because of the ubiquitous medical roles found for phenanthroline ligands. 2,9-Dimethyl substitution strongly interferes with the partial intercalation of the complex and the results of this study prove it again. The main finding is that this mixed ligand complex, in contrast to [Cu(2,9-dmp)2]+ (2,9-dmp = 2,9-dimethyl-1,10-phenanthroline), which fails to cleave DNA (Sigman et al., 1979), has ability to cleave the supercoiled plasmid DNA and it could be useful in molecular biology and drug design.
Footnotes
Acknowledgment
The financial support from Razi University Research Center is gratefully acknowledged.
Disclosure Statement
No competing financial interests exist.