




Abstract
The interaction of native calf thymus DNA with tartrazine in 10 mM Tris–HCl aqueous solution at neutral pH 7.4 was investigated. Tartrazine is a nitrous derivative and may cause allergic reactions, with a potential of toxicological risk. Also, tartrazine induces oxidative stress and DNA damage. Its DNA binding properties were studied by UV–vis and circular dichroism spectra, competitive binding with Hoechst 33258, and viscosity measurements. Tartrazine molecules bind to DNA via groove mode as illustrated by hyperchromism in the UV absorption band of tartrazine, decrease in Hoechst–DNA solution fluorescence, unchanged viscosity of DNA, and conformational changes such as conversion from B-like to C-like in the circular dichroism spectra of DNA. The binding constants (K b) of DNA with tartrazine were calculated at different temperatures. Enthalpy and entropy changes were calculated to be +37 and +213 kJ mol−1, respectively, according to the Van't Hoff equation, which indicated that the reaction is predominantly entropically driven. Also, tartrazine does not cleave plasmid DNA. Tartrazine interacts with calf thymus DNA via a groove interaction mode with an intrinsic binding constant of 3.75 × 10⁴ M−1.
Introduction
Tartrazine (Fig. 1) (also known as FD & C Yellow No. 5, C.I. No. 19140, Food Yellow No. 4) is principally trisodium 5-hydroxy-1-(4-sulfonatophenyl)-4-(4-sulfonatophenylazo)-H-pyrazol-3-carboxylate. Tartrazine is an orange-colored, water-soluble powder (Tanaka et al., 2008). As mentioned earlier, tartrazine is a mono azo pyrazolone dye. It is mainly used to color soft drinks, juices, cookies, ice creams, sauces, mustard, snacks, decoration and coatings, flavored processed cheese, drugs, and cosmetics (shampoos, colognes, toothpastes, and soaps) (Mehedi et al., 2009). Synthetic dyes contain azo (N = N) functional groups and aromatic ring structures, so they are harmful to human health (Al-Degs, 2009).
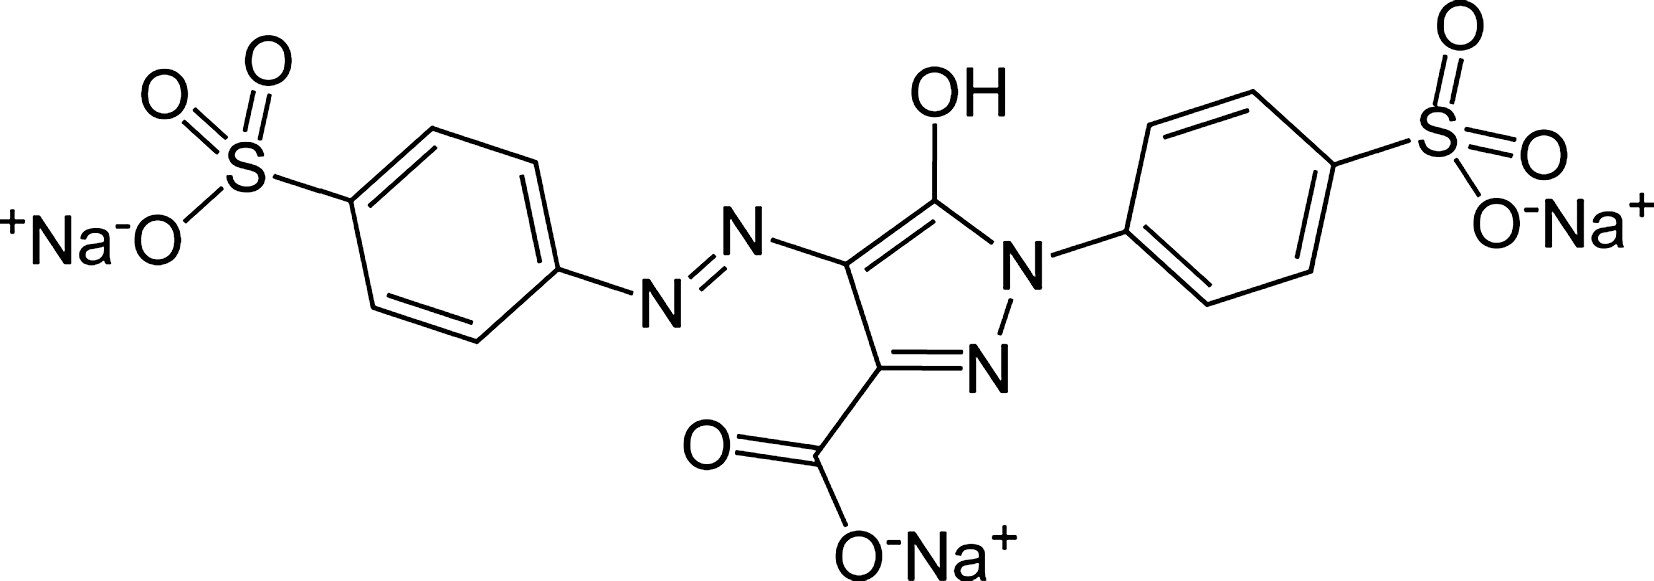
Structure of trisodium 5-hydroxy-1-(4-sulfonatophenyl)-4-(4-sulfonatophenylazo)-H-pyrazol-3-carboxylate (tartrazine).
Tartrazine has been implicated as the food additive most often responsible for allergic reactions, chiefly affecting atopic individuals. Studies have demonstrated tartrazine-related hyperactivity in children and also its ability to induce DNA damage in the colon of mice at doses close to the acceptable daily intake (Rowe and Rowe, 1994). In addition to hyperactivity, other behavioral changes, for example, restlessness and sleep disturbance, have been reported to be associated with the ingestion of tartrazine in some children. These effects have been shown to be dose related (1–50 mg/child) (Tanaka, 2006). DNA damage has also been reported for tartrazine at 2000 mg/kg, 24 h after administration, whereas other food dyes, for example, sunset yellow, did not yield a statistically significant increase in DNA damage in colonic cells (Poul et al., 2009). Prolonged use of this dye increased the number of gastric mucosa lymphocytes and eosinophils in Wistar rats (Mehedi et al., 2009). Tartrazine induces chromosomal aberrations in the fibroblast cells of Muntiacus muntjac, bone marrow cells of mice and rats, and chromosomes of Allium cepa (Mpountoukas et al., 2010). Tartrazine causes changes in hepatic and renal parameters (significant increase in alanine transaminase [ALT], aspartate transaminase [AST], alkaline phosphatase [ALP], urea, creatinine, total protein, and albumin), and can induce oxidative stress by formation of free radicals (Amin et al., 2010). According to behavioral toxicity studies reported by Sobotka et al., tartrazine exerted minimal neurobehavioral effects (only neuromotor development in females) in rats (1.0%–2.0% in the diet). The acceptable daily intake for human is 0–7.5 mg/kg body weight (Tanaka et al., 2008).
Small molecules can react with DNA via covalent or noncovalent interactions. There are several sites in the DNA molecule where binding can occur: (i) between two base pairs (full intercalation), (ii) in the minor groove, (iii) in the major groove, (iv) on the outside of the helix, and (v) electrostatics binding (Kashanian and Ezzati Nazhad Dolatabadi, 2009). In the present study, we investigated the interaction of native calf thymus DNA (CT-DNA) with tartrazine in 10 mM Tris–HCl aqueous solution at neutral pH 7.4.
Material and Methods
Chemicals and materials
Highly polymerized CT-DNA and Tris–HCl were purchased from Sigma Co. NaOH, potassium acetate, chloroform, isaoamylalchol, and agarose were purchased from Merck. Tartrazine was purchased from Fluka. All solutions were prepared using double-distilled water. Tris–HCl buffer solution was prepared from (Tris–(hydroxymethyl)-amino-methane–hydrogen chloride) and pH was adjusted to 7.4. Tartrazine stock solution (10−3 M) was prepared by dissolving an appropriate amount of the compound in Tris–HCl buffer. Plasmid DNA (GPFN1) was extracted from Escherichia coli. Solutions of CT-DNA gave an UV absorbance ratio (260/280 nm) of more than 1.8, indicating that the DNA was sufficiently free of protein. The DNA concentration per nucleotide was determined by absorption spectroscopy using a molar absorption coefficient (ɛ) of 6600 M−1 cm−1 at 260 nm (Vaidyanathan and Unni Nair, 2002; Kashanian et al., 2008; Rao et al., 2008; Sasmal et al., 2008). The stock solutions were stored at 4°C and used within 4 days.
Physical measurements and instrumentation
The UV–vis spectra for DNA–tartrazine interactions were obtained using a Cary (UV 100 Bio) spectrophotometer. Absorption titration experiments were conducted by keeping the concentration of tartrazine constant (5 × 10⁻⁵ M) while varying the DNA concentration from 0 to 4.5 × 10⁻⁴ M (r i = [DNA]/[tartrazine] = 0.00, 1, 2, 4, 6, 8, and 9). Solutions of DNA and tartrazine were scanned in a 0.5-cm (1-mL) quartz cuvette.
For viscosity measurements, a viscosimeter (SCHOT AVS 450) was used, kept at 25°C by a constant temperature bath. Flow time was measured with a digital stopwatch; the mean values of two replicated measurements were used to evaluate the viscosity (η) of the samples. The data were reported as (η/η 0) versus the [tartrazine]/[DNA] ratio, where (η 0) is the viscosity of the DNA solution alone. Viscosity values were calculated from the observed flow time of CT-DNA–containing solution corrected from the flow time of buffer alone (t 0) as η = (t – t 0)/t 0 (Lawrence et al., 2006; Li et al., 2007).
Circular dichroism (CD) measurements were recorded on a JASCO (J-810) spectropolarimeter by keeping the concentration of DNA constant (8 × 10⁻⁵ M) while varying the tartrazine concentration from 0 to 5.6 × 10⁻⁵ M (r i = [tartrazine]/[DNA] = 0.0, 0.3, 0.7). Fluorescence intensities were measured using a Cary luminescence spectrometer with the following setting: 350 nm as excitation wavelength and 480 nm as emission wavelength. In the competitive binding studies, concentrations of DNA and Hoechst 33258 were kept constant (5 × 10⁻⁵ and 5 × 10⁻⁵ M−1, respectively) while varying the tartrazine concentration from 0 to 0.5 × 10⁻⁵ M−1.
Gel electrophoresis studies
For cleavage studies, first, plasmid DNA was isolated as follows: pure culture of Escherichia coli-containing plasmid DNA was incubated at 37°C for 12 h in nutrient broth containing kanamycin. The broth was harvested after 12 h, centrifuged at 4000 rpm for 5 min, and decanted and the entire medium was drained. The pellet was resuspended in 1 mL of SET (sucrose, ethylenediaminetetraacetic acid, and Tris–HCl) buffer by vortexing. Appropriate concentration of NaOH and sodium dodecyl sulfate buffer were added to make a final concentration of 10% (v/v), mixed well (without vortexing), and incubated on ice for 5 min. Then, 1.5 mL of potassium acetate solution (5 M) was added and mixed immediately. Following a 5-min incubation on ice, 4.5 mL chloroform:isoamylalchol (24:1) was added to the extraction mixture and the resulting solution was centrifuged for 10 min at 8000 rpm at 4°C. The supernatant was collected in a new tube, 10 mL of 100% EtOH (kept at room temperature) was added, and the solution was centrifuged for 5 min at 10,000 rpm. The pellet was washed with 5 mL of 70% EtOH (kept at room temperature), centrifuged 5 min at 5000 rpm, and dried. The pellet was dissolved in TE (Tris–HCl and ethylenediaminetetraacetic acid) buffer (nearly 200 μL), 50 μL RNase A (1 mg/mL in TE) was added, and then the mixture was incubated at 37°C for 1–2 h. The homogeneity of plasmid DNA was confirmed by gel electrophoresis (Kashanian et al., 2010b). DNA was stored at −20°C until use. Reaction of tartrazine with GPFN1 plasmid DNA (0.02 molar) was performed in TE buffer (pH 8). The contents were incubated for 3 h at 37°C. Concentration dependence studies were performed using different tartrazine ratios (r i = [tartrazine]/[DNA] = 0.00, 0.05, 0.10, and 0.25). Electrophoresis was conducted at 80 V for 1 h in Tris/Borate/EDTA (TBE) buffer solution using 1% agarose gels to analyze DNA. The gel was stained with ethidium bromide and photographed using UV illumination.
Results
Electronic spectral studies
Observations of hypochromism and red shift are associated with binding of small molecules to the DNA helix due to the intercalative mode as it involves a strong stacking interaction between an aromatic chromophore of the molecule and the base pairs of DNA (Nafisi et al., 2007; Liu et al., 2009). To examine tartrazine binding to DNA base pairs, spectroscopic changes in UV–vis was monitored (and followed by measuring the absorbance at 260 and 426 nm) after either adding increasing amounts of DNA to a fixed concentration of tartrazine (5 × 10⁻⁵ M) (Fig. 2A) oradding increasing amounts of tartrazine to a fixed concentration of DNA (5 × 10⁻⁵) (Fig. 3). Addition of increasing amounts of CT-DNA to the tartrazine solution showed hyperchromism of the absorption bands. Absorption spectra of DNA increased upon increasing the tartrazine concentration. This is a typical hyperchromic effect. Therefore, these results indicate damage to the DNA double-helical structure after tartrazine binding. The intrinsic binding constant K
b was determined from the spectral titration data using the following equation:
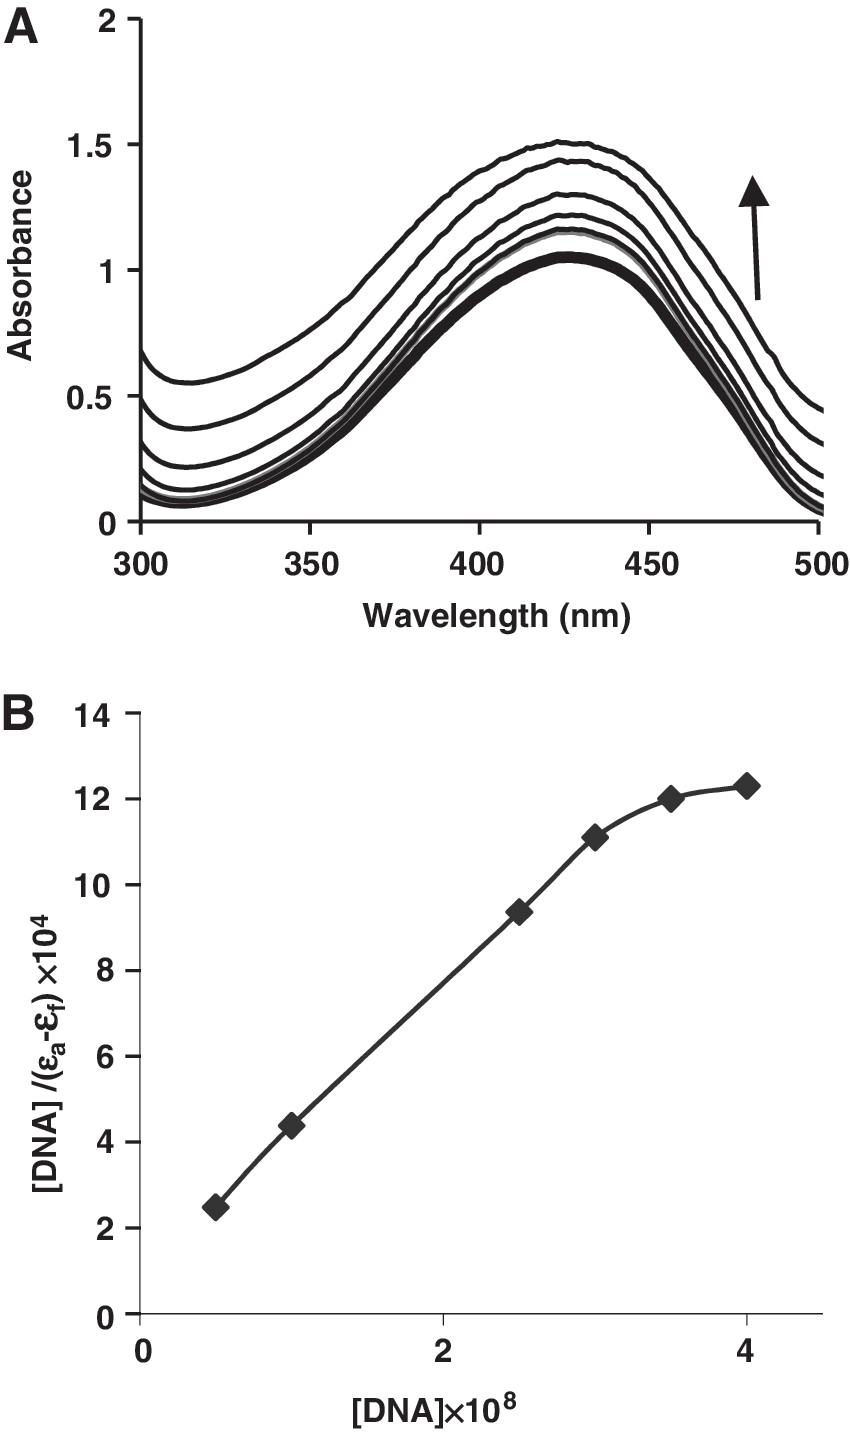
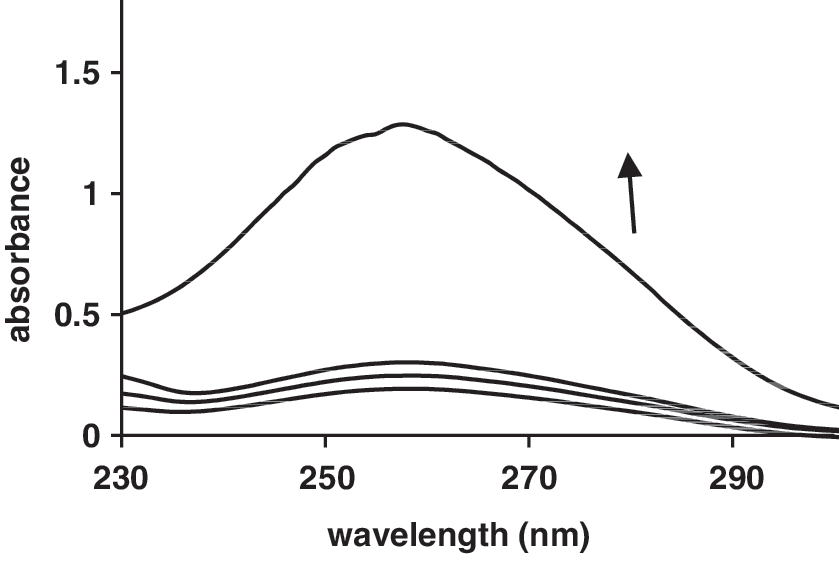
UV/vis spectra of DNA (5 × 10⁻⁵ M) with tartrazine in 0.01 M Tris–HCl buffer (pH 7.4) with r i = [tartrazine]/[DNA] = (0.0, 0.5, 1, 2).
where [DNA] is the concentration of DNA in base pairs; the apparent absorption coefficient ɛa, ɛf, and ɛb correspond to A obsd./[M], the extinction coefficient of the free compound, and the extinction coefficient of the compound when fully bound to DNA, respectively. In plots of [DNA]/(ɛa – ɛf) versus [DNA], K b is given by the ratio of slope to the intercept (Fig. 2B) (Xu et al., 2008). The intrinsic binding constant K b of tartrazine was calculated to be 3.75 × 10⁴ M−1.
Influence of DNA denaturation
Denatured DNA was produced by heating a CT-DNA solution at 100°C for 5 min, followed by rapid cooling in an ice bath to 0°C before being brought back to room temperature (Kashanian et al., 2010a). Two mL of 5 × 10⁻⁵ M tartrazine was transferred into cuvettes and absorbance titration recorded after adding native CT-DNA (2.5 × 10⁻⁴ M) and denatured CT-DNA (Fig. 4). This dye interacted with both native and denatured DNA; however, it is notable that the increase in the absorbance intensity of tartrazine binding denatured DNA is more than that of tartrazine binding native DNA.
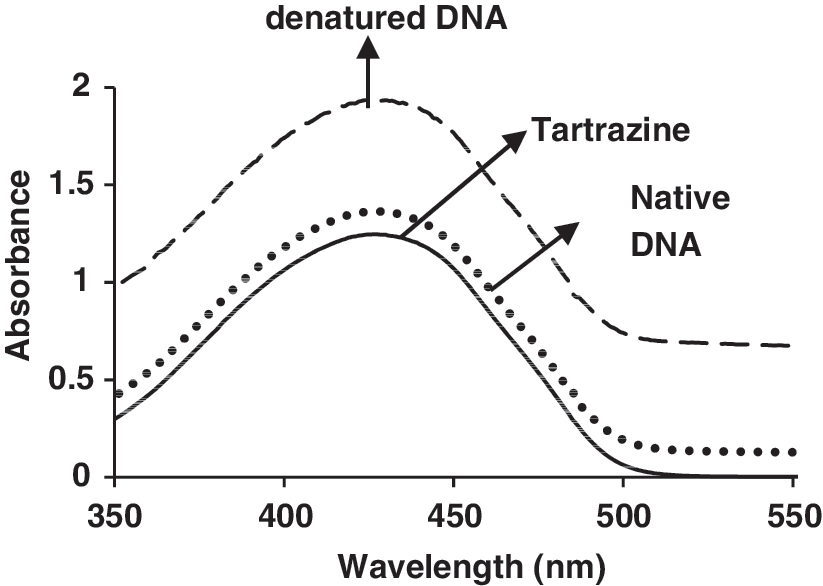
UV/vis spectra of tartrazine (5.0 × 10⁻⁵ M) with native and denatured DNA in 0.01 M Tris–HCl buffer (pH 7.4) with r i = [DNA]/[tartrazine] = 5.
Competitive binding between Hoechst 33258 and tartrazine for DNA
No luminescence was observed for tartrazine upon excitation either in aqueous solution or in the presence of CT-DNA. To investigate the mode of tartrazine binding to DNA, a competitive binding experiment was performed. Hoechst 33258 binds strongly to the minor groove of double-stranded B-DNA with specificity for AT-rich sequences (Kakkar et al., 2002). The interaction of Hoechst 33258 with DNA in pH 7.4 Tris–HCl was characterized by the fluorescence spectra (Fig. 5), fluorescence emission spectra are significantly enhanced by increasing the DNA concentration (Guan et al., 2006). The decrease in Hoechst–DNA solution fluorescence after addition of tartrazine was observed (Fig. 6).
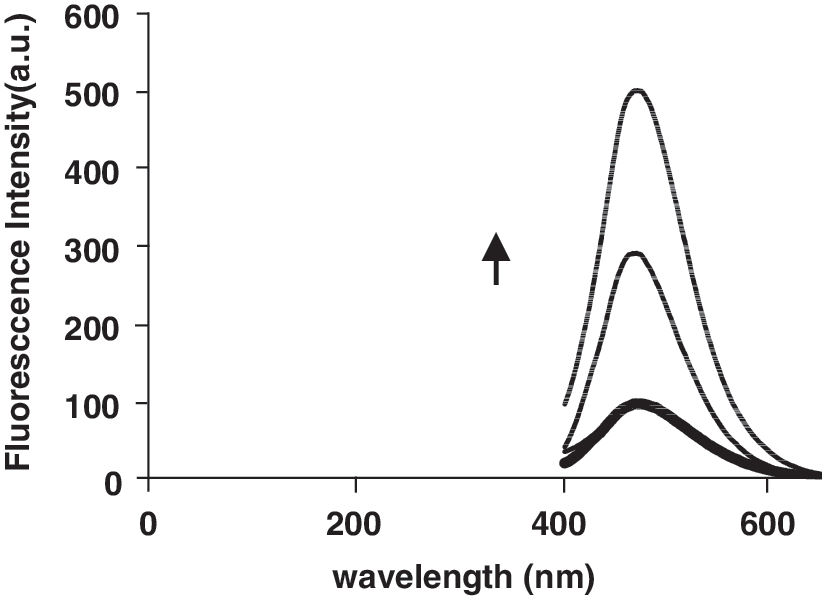
Fluorescence spectra of Hoechst 33258 in the absence and presence of increasing amounts of DNA (r i = [DNA]/[Hoechst 33258] = 0.0, 0.1, 0.2, 1, 1.6).
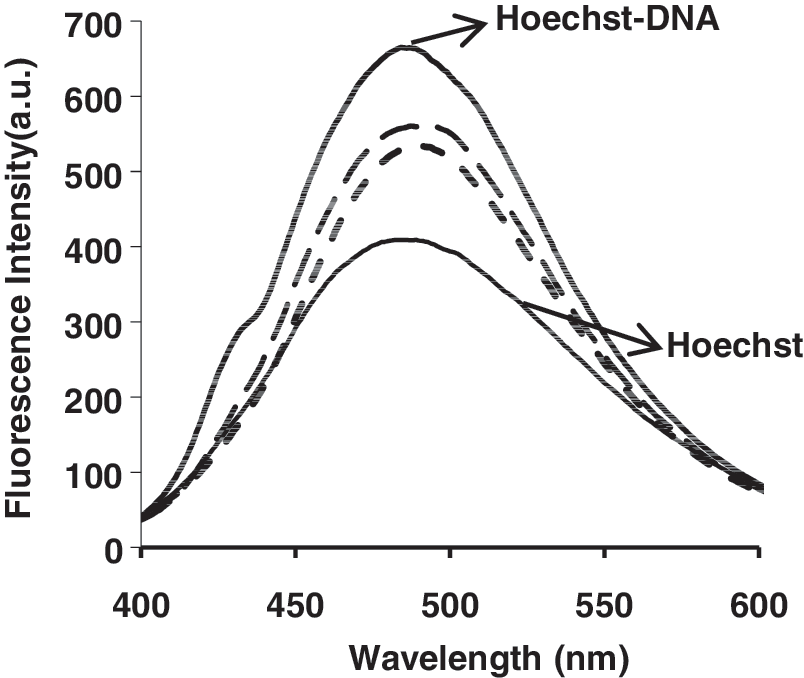
Emission spectra of the Hoechst–DNA complex in the presence of increasing tartrazine in aqueous solution at room temperature.
Viscosity study
Figure 7 shows the relative viscosity of DNA in the presence of varying amounts of tartrazine. Tartrazine induces relatively small changes in DNA viscosity.
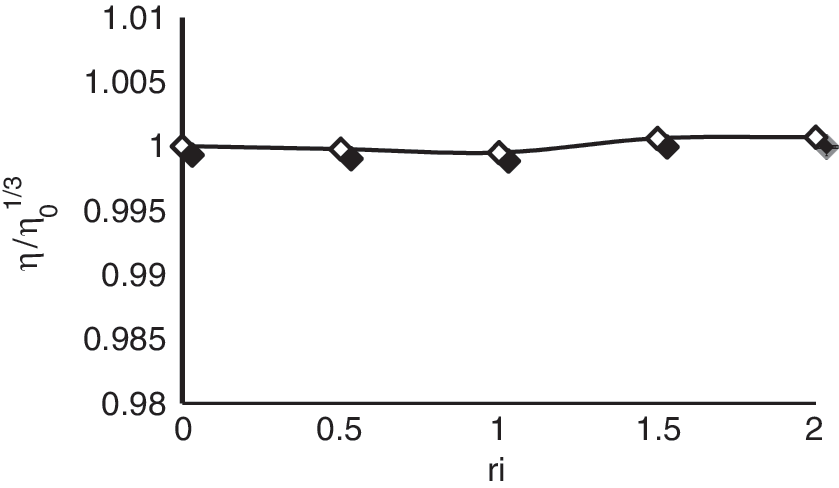
Effect of increasing amounts of tartrazine on the viscosity of CT-DNA (5 × 10⁻⁵ M) in 0.01 M Tris–HCl buffer (pH 7.4) (r i = 0.0, 0.5, 1, 1.5, and 2).
CD spectral studies
A solution of CT-DNA exhibits a positive band (275 nm) from base stacking interactions and a negative band (245 nm) from the right-handed helicity of DNA. The interaction of tartrazine with DNA induces a change in the CD spectrum of the B-DNA. The intensities of both the negative and positive bands decreased significantly (shifting to zero), as indicated in Figure 8.
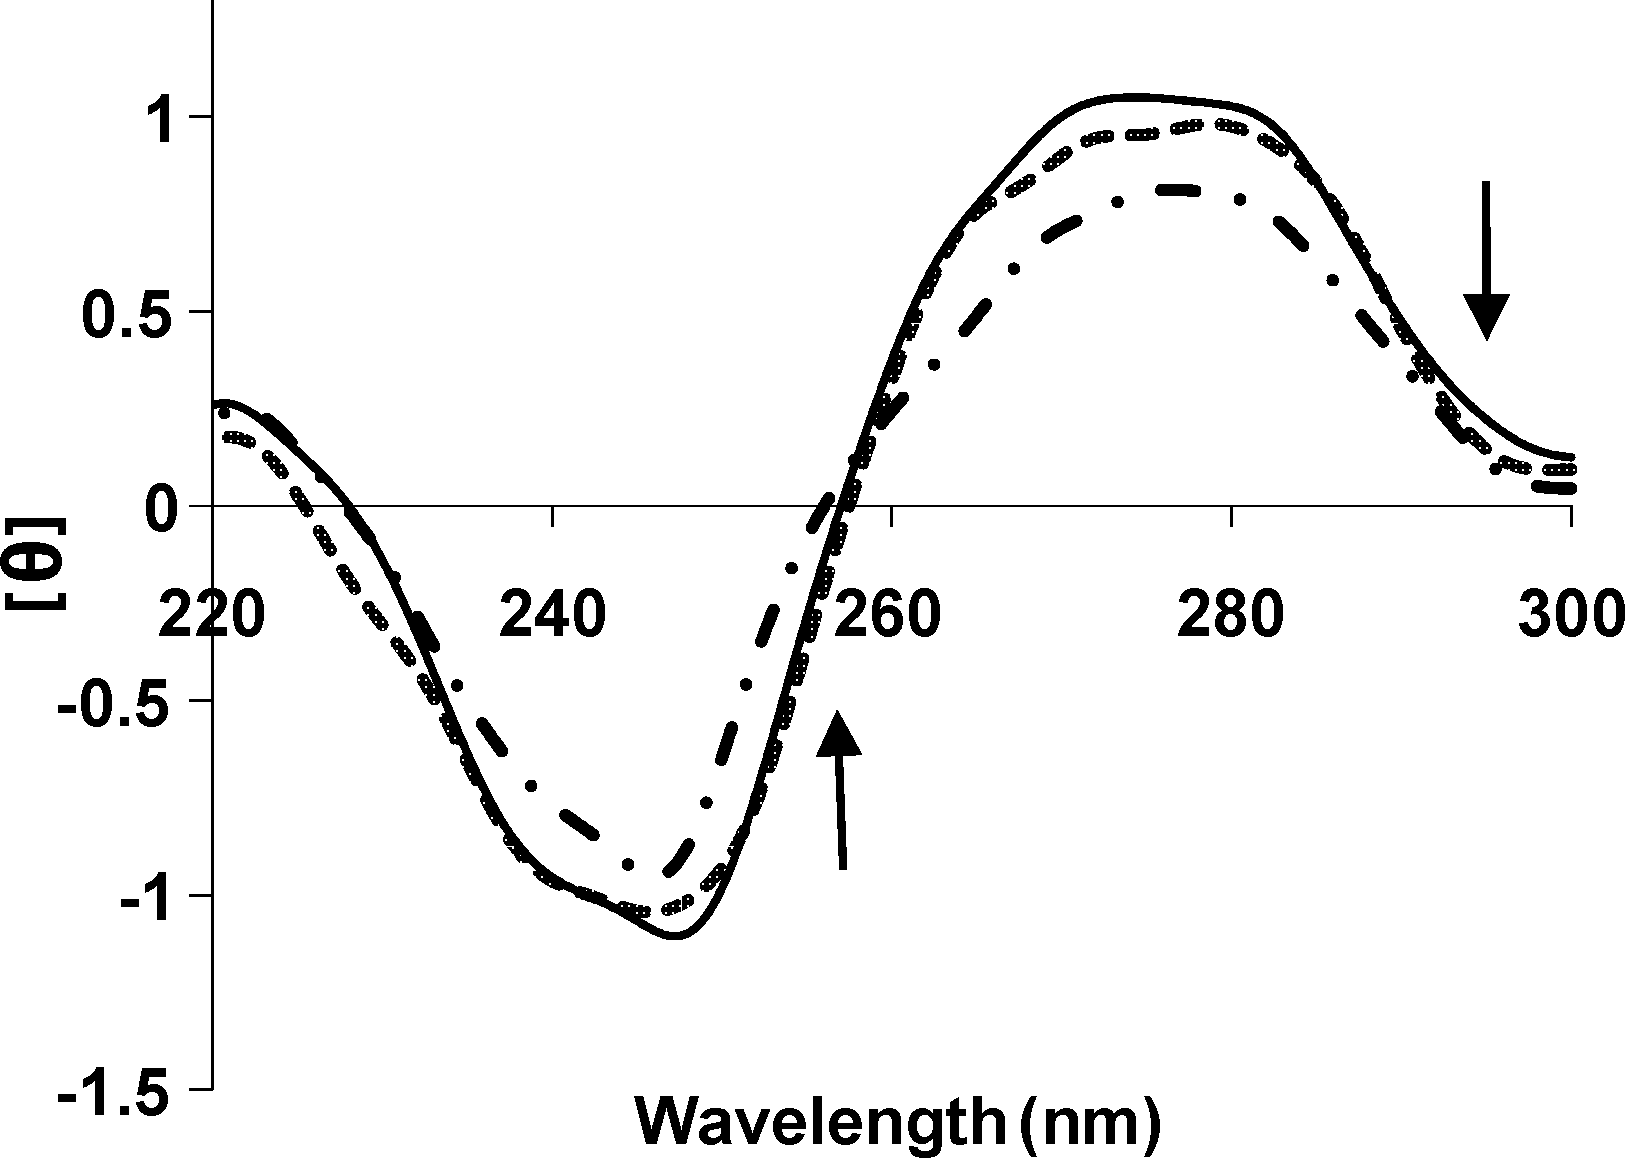
Circular dichroism spectra of DNA (8.0 × 10⁻⁵ M) in 0.01 M Tris–HCl buffer, in the presence of increasing amounts of tartrazine (r i = [tartrazine]/[DNA] = 0.0 [solid], 0.3 [dashed], 0.7 [dash-dotted]).
Thermodynamic parameters of the tartrazine–DNA complex interaction
By measuring the temperature dependence of the binding constant, thermodynamic studies of the interaction between tartrazine and DNA were carried out. Gibbs free energy was determined from the binding constant according to the following relationship:
where R and T are the gas constant and the absolute temperature, respectively. The results are shown in Table 1. The binding enthalpy was calculated from a plot of temperature dependence of the binding constant according to the Van't Hoff relationship:
By plotting lnK b versus 1/T (Fig. 9), ΔH 0 and ΔS 0 were determined (Asadi et al., 2004). The thermodynamic parameters, enthalpy change (ΔH 0) and entropy change (ΔS 0), were calculated to be +37 and +213 kJ mol−1, respectively. The standard free energy changes (ΔG 0) for tartrazine–DNA interactions are large and negative because of their strong association. The binding of tartrazine to DNA is an endothermic process. The positive values of ΔH 0 in the tartrazine–DNA interactions indicate a contribution of the positive entropy changes (ΔS 0) resulting in large T ΔS 0 and more negative ΔG 0, which favors the binding process (Asadi et al., 2004).
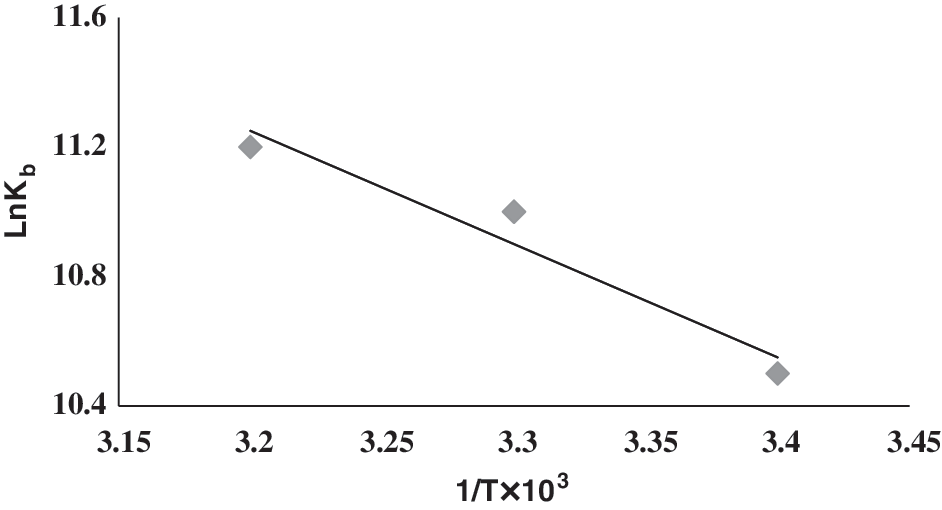
Van't Hoff plot for tartrazine–DNA complex.
Cleavage of plasmid GPFN1 DNA
Gel electrophoresis of GPFN1 DNA treated with tartrazine does not show any evidence of DNA cleavage (Fig. 10).
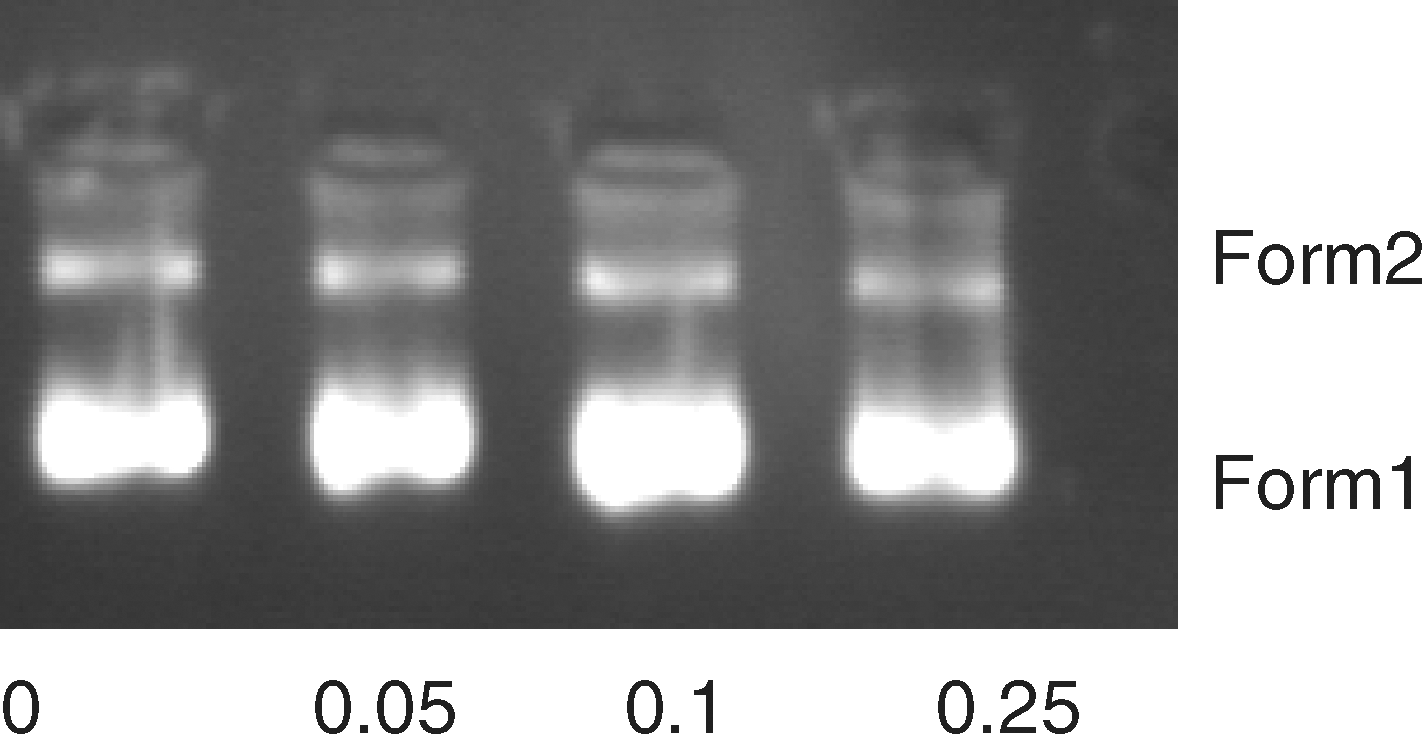
Gel electrophoresis of DNA in the presence of increasing amounts of tartrazine (r i = tartrazine/[DNA] = 0, 0.05, 0.1, 0.25).
Discussion
Various food additives, such as colors, preservatives, sweeteners, and antioxidants, are consumed in a typical diet. In the present study, tartrazine showed significant adverse effects on DNA structure parameters. According to the results from UV and fluorescence spectroscopy, viscosity, and CD spectral studies, tartrazine binds to CT-DNA with high affinity through a groove binding mode, which could cause damage. Addition of increasing amounts of CT-DNA to a tartrazine solution results in the obvious hyperchromism tendency of the absorption bands. Tartrazine interaction may occur via a surface binding mode. Amino and hydroxyl groups could form hydrogen bonds with the DNA base pairs, contributing to the overall hyperchromism (Kumar and Arunachalam, 2006; Kumar et al., 2009; Arjmand et al., 2008).
The competitive binding experiment with Hoechst 33258 indicated that tartrazine could interact as a groove binder as demonstrated by the decrease in Hoechst–DNA solution fluorescence band indicating that tartrazine has the ability to interact with DNA in the minor groove. Although Hoechst interacts with DNA with high affinity (Strekowski and Wilson, 2007), it can be replaced by tartrazine. Moreover, the K
b value obtained was lower than that of classical intercalators, whose binding constants are on the order of 106–107 (Xu et al., 2008; Arjmand et al., 2010). Comparing the intrinsic binding constant (K
b) of tartrazine with those of known DNA groove binders (Zhang et al
In addition, tartrazine shows higher affinity to single-stranded (ss) DNA in comparison with double-stranded (ds) DNA, which indicates a higher probability of hydrogen bonding in ssDNA. Also, the major contributing factor in tartrazine–DNA complex stability is entropic in origin. In the intercalation process, a planar aromatic chromophore is inserted between two adjacent base pairs in a DNA helix. Alternatively, in minor groove binding, an isohelical drug molecule binds in the minor groove of DNA, inducing less significant structural changes in the DNA. The complex formed from intercalation is stabilized by hydrophobic interactions and van der Waals forces, whereas the complex formed from minor groove binding is stabilized mainly by hydrophobic interactions (Haq, 2002). Ross and Subramanian (1981) reported that when ΔH < 0 or ΔH ≈ 0 and ΔS > 0, the electrostatic force dominates the interaction; when ΔH < 0 and ΔS < 0, van der Waals interactions or hydrogen bonds dominate the reaction; and when ΔH > 0 and ΔS > 0, hydrophobic interactions dominate the binding process. By applying this analysis to the binding system of tartrazine and CT-DNA, we determined that ΔH > 0 and ΔS > 0. Therefore, hydrophobic interactions are the main forces acting during the binding of tartrazine to CT-DNA, and the mode of binding is groove binding. Consequently, the release of water molecules or counterions results in positive enthalpy and entropy values in tartrazine–DNA interactions. Also, groove binding is predominantly entropically driven, whereas intercalation is enthalpically driven (Kashanian et al., 2010a).
Optical photophysical probes provide necessary, but not sufficient, support for a binding model. Measurements of DNA viscosity provide a critical test of binding in solution in the absence of crystallographic structural data. Intercalating agents are expected to elongate the double helix to accommodate the ligands in between the base pairs, leading to an increase in the viscosity of DNA. In contrast, molecules that bind exclusively in the DNA grooves by partial and/or nonclassical intercalation, under the same conditions, typically cause less pronounced or no change in the DNA solution viscosity (Xi et al., 2009). The relative viscosity of DNA in the presence of varying amounts of tartrazine indicates that it can bind to DNA via groove and/or surface binding mode (Jiang, 2004; Sasmal et al., 2008; Kashanian et al., 2010a).
The intensities of both the negative and positive CD bands of DNA decreased significantly (shifting to zero). This indicates that tartrazine induces conformational changes, conversion from a more B-like to a more C-like structure, within the DNA molecule (Kashanian et al., 2008, 2010a; Chen et al., 2009; Shahabadi et al., 2009). The interaction effectively screens the negative charge on N (7) base sites as well as phosphate oxygen atoms simultaneously, both along the deoxyribophosphate backbone and in the groove of the helix, to promote a transconformational change in the DNA structure. Further transformation of DNA structure proceeds by removal of water from the base sites and the grooves of the helix (Kashanian et al., 2007; Shahabadi et al., 2009). These changes are indicative of a nonintercalative mode of binding of tartrazine and provide additional support of groove binding.
Conclusions
Our results indicate that this food colorant has a toxic potential to CT-DNA in vitro and it seems that it binds directly to DNA. Our findings coincide with the data reported by Mpountoukas et al. (2010).
The tartrazine concentration used in this study (3.5 × 10⁻⁵) is much less than that currently used as a food additive. Combining our result and that of other researchers, we conclude that more attention should be paid to prevent our children from eating or drinking large amounts of food containing this colorant.
Footnotes
Acknowledgment
The financial support for this study from Razi University Research Center is gratefully acknowledged.
Disclosure Statement
No competing financial interests exist.