
Abstract
One approach to accelerate the availability of new cancer drugs is to test drugs approved for other conditions as anticancer agents. In recent years, some researchers have shown that antiviral drugs, such as ritonavir, saquinavir, and nelfinavir, inhibit the growth of over 60 cancer cell lines derived from nine different tumor types. This article studied the anticancer potential of an antiviral drug, lamivudine (LA). The interaction of LA and calf thymus DNA (CT-DNA) was studied using emission, absorption, circular dichroism (CD), and viscosity techniques. The binding constants evaluated from fluorescence data at different temperatures revealed that fluorescence enhancement is a static process that involves complex–DNA formation in the ground state. Further, the enthalpy and entropy of the reaction between the drug and CT-DNA showed ΔH<0 (−126.38±0.61 kJ mol−1) and ΔS<0 (−352.17±2.1 J mol−1 K−1); therefore, van der Waals interactions or hydrogen bonds are the main forces in the binding of LA to CT-DNA. The values of K f clearly underscore the high affinity of LA to DNA. In addition, detectable changes in the CD spectrum of CT-DNA in the presence of LA indicated conformational changes. All these results showed that groove binding is the binding mode of this drug and CT-DNA.
Introduction
Several nucleoside analogs, including lamivudine (LA) (Fig. 1), are used as antiviral drugs. The viral polymerase incorporates these compounds with noncanonical bases. These compounds are activated in the cells by being converted into nucleotides; they are administered as nucleosides, because charged nucleotides cannot easily cross cell membranes.
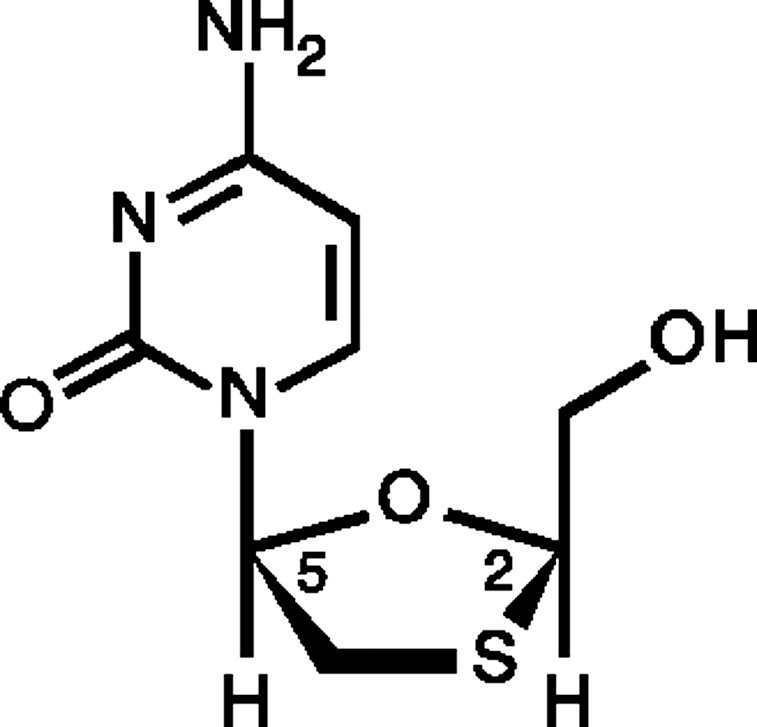
The structure of LA. LA, lamivudine.
LA has become a main therapeutic option for treating hepatitis B virus (HBV) infection (Jonas et al., 2002). Its antiviral effects against HBV have been established both in vitro and in vivo (Mckenzie et al., 1995). Clinical trials revealed that LA is effective in reducing HBV replication and in preventing the progression of chronic liver disease (Liaw et al., 2004; Asselah et al., 2005).
Many antitumor and antiviral drugs and many carcinogens act by binding within the minor groove of double-helical DNA, interfering with both replication and transcription. Several of these are quite base specific, recognizing and binding only to certain base sequences.
In this study, the interaction of LA with calf thymus DNA (CT-DNA) was investigated by (i) molecular spectroscopy methods, including ultraviolet (UV) spectrophotometry (Biver et al., 2004), fluorescence (Liu et al., 1998), and circular dichroism (CD) spectropolarimetry (Mahadevan and Palaniandavar, 1997, 1998), and (ii) dynamic viscosity measurements (Mitsopoulou et al., 2008).
Materials and Methods
Tris–HCl was purchased from Merck. Doubly distilled deionized water was used throughout. Highly polymerized CT-DNA was purchased from Sigma. LA was purchased from NC IndTech Pvt. Ltd (India).
Absorbance spectra were recorded using an HP spectrophotometer (Agilent 8453) equipped with a thermostated bath (Huber polysat cc1). Absorption titration experiments were conducted by keeping the concentration of LA constant (5×10⁻⁵ M) while varying the DNA concentration from 0 to 3×10⁻⁴ M (r i=[DNA]/[LA]=0.0, 0.2, 0.5, 0.75, 1, 1.5, 2, 3, 3.5, 4, 5, and 6). Absorbance values were recorded after each successive addition of DNA solution, followed by an equilibration period. CD measurements were recorded on a JASCO (J-810) spectropolarimeter, keeping the concentration of DNA constant (8×10⁻⁵ M) while varying the drug concentration (r i=[LA]/[DNA]=0, 0.05, 0.1, 0.15, and 0.2).
Viscosity measurements were made using a viscosimeter (SCHOT AVS 450) maintained at 25.0°C±0.5°C using a constant temperature bath. The DNA concentration was fixed at 5×10⁻⁵ M while varying the LA concentration (r i=[DNA]/[LA]=0.0, 0.1, 0.3, 0.6, and 0.9), and the flow time was measured with a digital stopwatch. The mean values of three measurements were used to evaluate the viscosity (η) of the samples. The values for relative specific viscosity (η/η 0)1/3, where η 0 and η are the specific viscosity contributions of DNA in the absence (η 0) and presence of the drug (η), respectively, were plotted against r i.
All fluorescence measurements were carried out with a JASCO spectrofluorometer (FP6200) by keeping the concentration of LA constant while varying the DNA concentration from 0 to 30×10−5 M (r i=[DNA]/[LA]=0.0, 0.5, 1.0, 1.5, 2, 3, 4, 5, and 6) at four different temperatures (279, 293, 310, and 318 K).
Standard deviations of measurements were calculated from linear regression analyses as indicated by Diem and Lentner (1970).
Results and Discussion
UV–visible spectroscopy
The application of electronic absorption spectroscopy in DNA binding studies is a useful technique. Figure 2 shows the absorption spectra of LA in the absence and presence of CT-DNA. Upon the addition of CT-DNA, the absorption band of LA at about 272 nm shows hyperchromism and is accompanied by a shift of 11 nm in λ max, from 272 to 261 nm, consistent with groove binding and leading to a small perturbation. This hyperchromism can be attributed to external contact (surface binding) with the duplex. Other studies have observed similar hyperchromism (Kashanian et al., 2007; Xu et al., 2008).
Electronic absorption spectra for the titration of 5.0×10⁻⁵ M LA with DNA (r i=0.00, 0.5, 0.75, 1, 1.5, 2, 2.5, 3, 3.5, 4, 5, and 6).
Groove-binding molecules typically have unfused aromatic ring systems linked by bonds with torsional freedom for the molecules to adopt an appropriate conformation that closely matches the helical turn of DNA grooves (Strekowski and Wilson, 2007).To illustrate this further, the intrinsic binding constant, K
b, which indicates the binding strength of the LA with CT-DNA was determined from the spectral titration data using the following equation (Pyle et al., 1989):
where [DNA] is the concentration of DNA, and ɛ f, ɛ a, and ɛ b correspond to the extinction coefficient for the free LA, for each addition of DNA to the drug, and for the drug in the fully bound form, respectively. A plot of [DNA]/(ɛ a – ɛ f) versus [DNA] gives K b as the ratio of slope to the intercept. From the [DNA]/(ɛ a–ɛ f) versus [DNA] plot (Fig. 3), the binding constant K b for the drug was estimated to be (5±0.3)×104 M−1. K b is lower than that reported for classical intercalators (for ethidium bromide, K b≈107 M−1) (Cory et al., 1985). The observed binding constant is more in keeping with groove binding, as observed in the literature (Erikson et al., 1992; Rajamanickam et al., 2000; Vaidyanathan and Nair, 2003; Lu et al., 2007).

Plot of [DNA]/(ɛ a – ɛ f) versus [DNA] for the absorption titration of CT-DNA with LA in Tris–HCl buffer. CT-DNA, calf thymus DNA.
Viscometric studies
To clarify further the interaction between the drug and DNA, viscosity measurements were carried out. Optical photophysical probes provide necessary, but not sufficient, clues to support a binding model. Hydrodynamic measurements that are sensitive to the length change (i.e., viscosity and sedimentation) are regarded as the least ambiguous tests of a binding model in the absence of crystallographic structural data. Intercalating agents are expected to elongate the double helix to accommodate the ligands in between the bases, leading to an increase in the viscosity of DNA. In contrast, complexes that exclusively bind in the DNA grooves by partial and/or nonclassical intercalation under the same conditions typically cause less pronounced or no change in DNA solution viscosity (Kelly et al., 1985). The values of (η/η 0)1/3 were plotted against [LA]/[DNA] (Fig. 4). The results revealed that the drug effect causes an increase in DNA viscosity, which is consistent with the DNA groove binding suggested above (Selvi and Palaniandavar, 2002; Xi et al., 2009).

Effect of increasing amounts of LA on the viscosity of CT-DNA (5×10⁻⁵ M) in 10 mM Tris–HCl buffer (r i=0.1, 0.3, 0.6, and 0.9).
Fluorescence studies
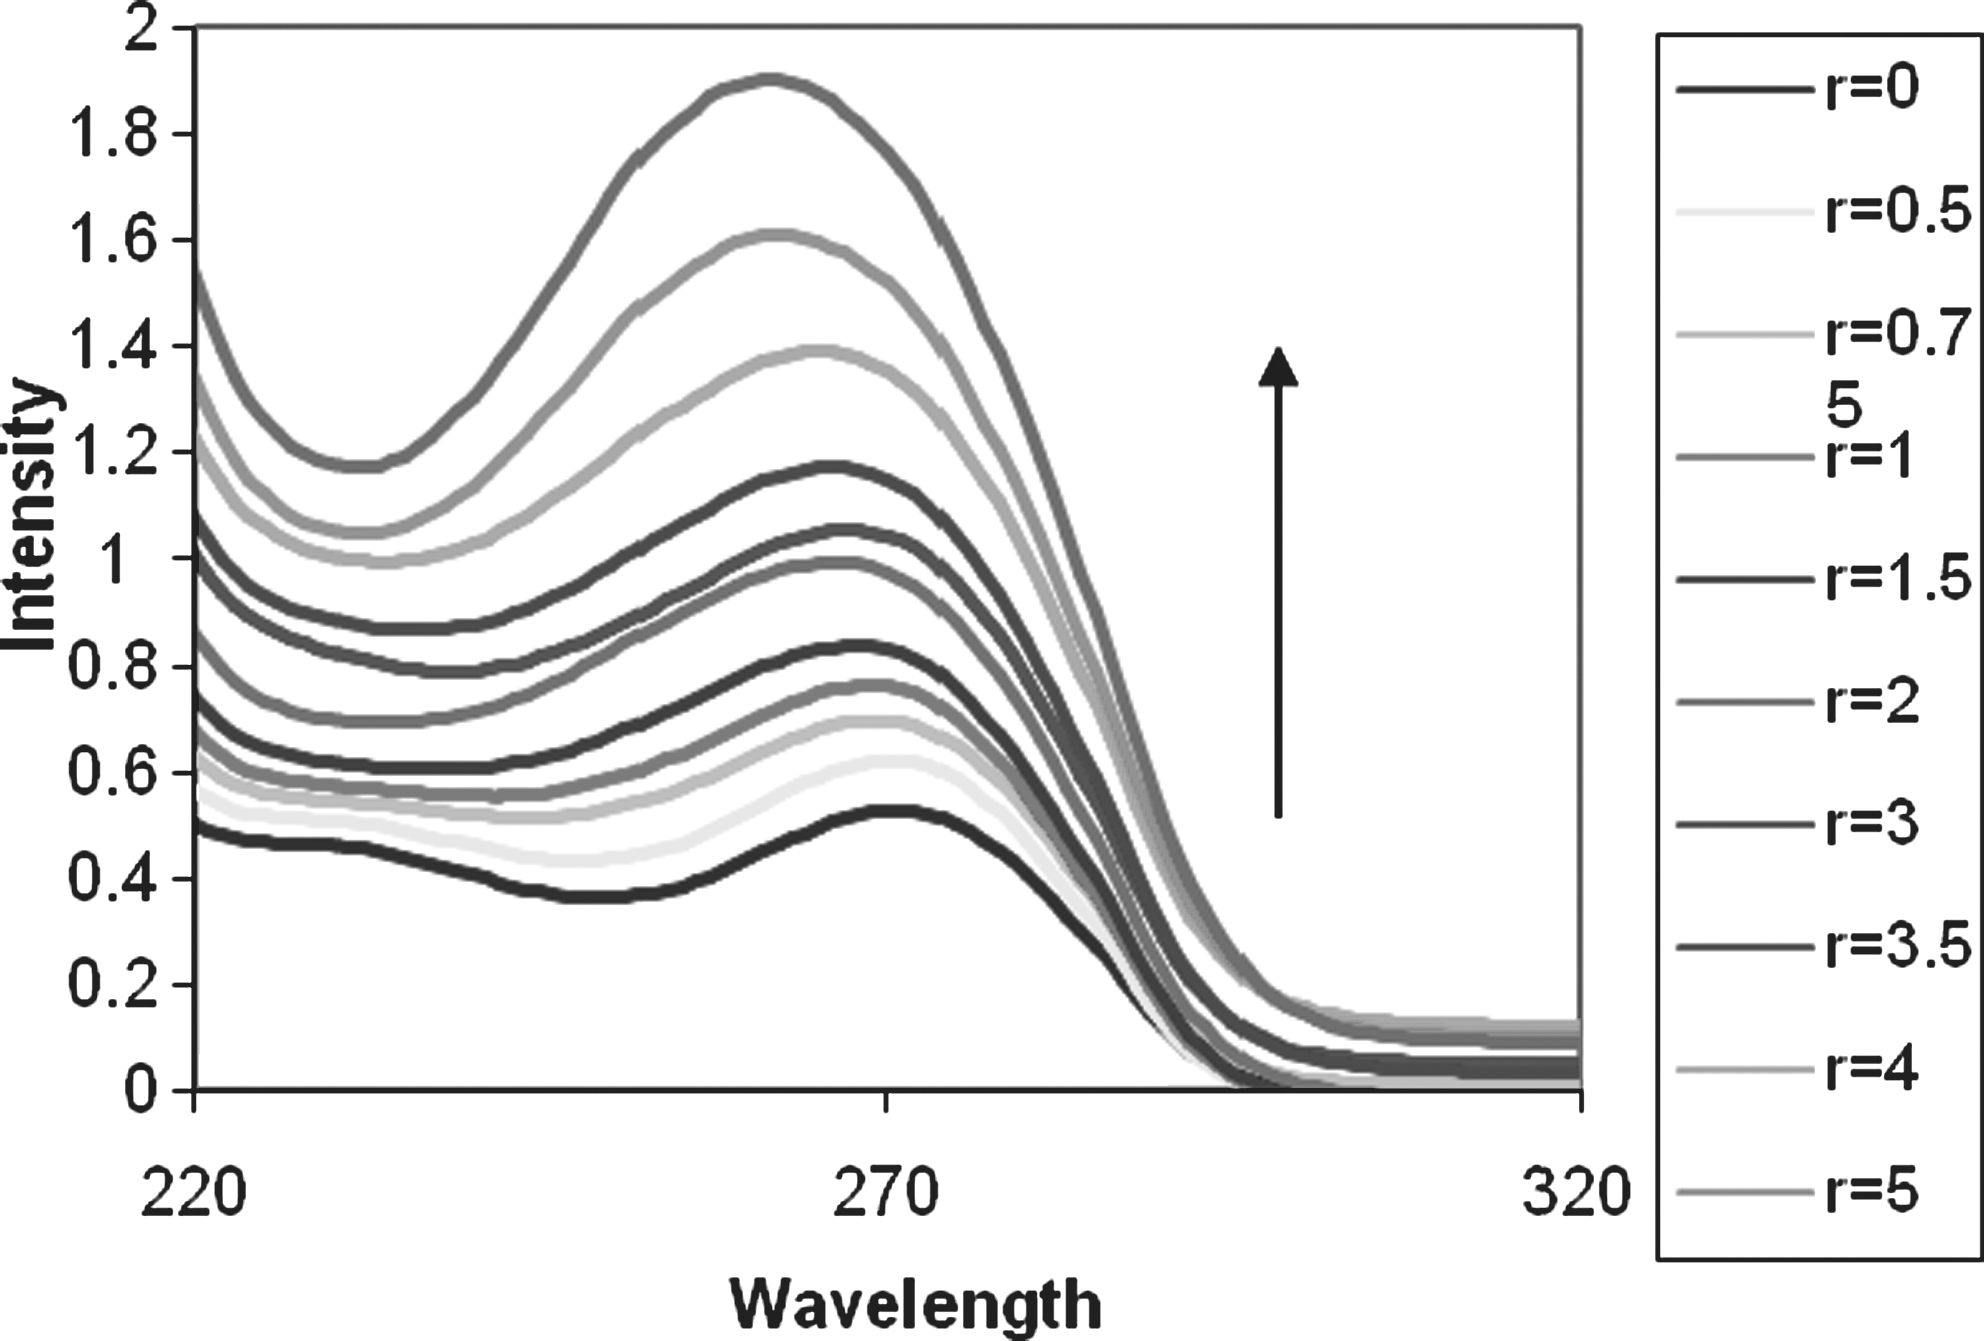
As LA is luminescent in the absence of DNA, it shows an appreciable increase in emission upon the addition of CT-DNA (Fig. 5). Figure 5 shows that a regular increase in the fluorescence intensity of LA with a shift in fluorescence emission maximum (612–613 nm) took place upon increasing the concentration of DNA at 25.0°C at a pH of 7.2. These fluorescence enhancements indicate that the LA interacted with DNA and that the quantum efficiency of LA was increased. Similar to a quenching process, the enhancement constant can be determined using Eq. 2 (Shahabadi et al., 2009):

Emission spectra of LA in Tris–HCl buffer in the absence and presence of CT-DNA. r i=[DNA]/[drug]=0.0, 0.5, 1, 1.5, 2, 3, 4, 5, and 6.
If a dynamic process is part of the enhancing mechanism, Eq. 2 can be written as follows (Shahabadi et al., 2009):
where K D is the dynamic enhancement constant (similar to a dynamic quenching constant), K B is the bimolecular enhancement constant (similar to a bimolecular quenching constant), and τ 0 is the lifetime of the fluorophore in the absence of the enhancer. The dynamic enhancement constants of LA at different temperatures were calculated using Eq. 3 (Table 1). As fluorescence lifetimes are typically near 10−8 s, the bimolecular enhancement constant (K B) was calculated from K D=K B τ 0 (Table 1). By considering the equivalency of the bimolecular quenching and enhancement constants, it can be seen that the latter is greater than the largest possible value (1.0×10¹⁰ M−1 s−1) in an aqueous medium. Thus, as a dynamic process does not initiate the fluorescence enhancement, it suggests that a static process involves complex formation in the ground state (Shahabadi et al., 2009).
Equilibrium binding titration
The binding constant (K
f) and the binding stoichiometry (n) for the complex formation between LA and DNA were measured using Eq. 4 (Eichhorn and Shin, 1968; Kennedy and Bryant, 1986):
Here, F 0 and F are the fluorescence intensities of the fluorophore in the absence and presence of different concentrations of DNA, respectively.
Table 2 shows the linear equations of log (F–F 0)/F versus log [DNA] at different temperatures. The values of K f underscore the remarkably high affinity of LA to DNA.
Thermodynamic studies
According to the thermodynamic data, interpreted as follows, the model of the interaction between a drug and biomolecule may be (1) ΔH>0 and ΔS>0, hydrophobic forces; (2) ΔH<0 and ΔS<0, van der Waals interactions and hydrogen bonds; and (3) ΔH<0 and ΔS>0, electrostatic interactions (Shahabadi and Fatahi, 2010). To elucidate the interaction of our complex with DNA, the thermodynamic parameters were calculated. The plot of ln K
f versus 1/T (Fig. 6; Eq. 5) allows the determination of ΔH and ΔS. If the temperature does not vary significantly, the enthalpy change can be regarded as a constant. Based on the binding constants at different temperatures, Eqs. 5 and 6 can estimate the free energy change:
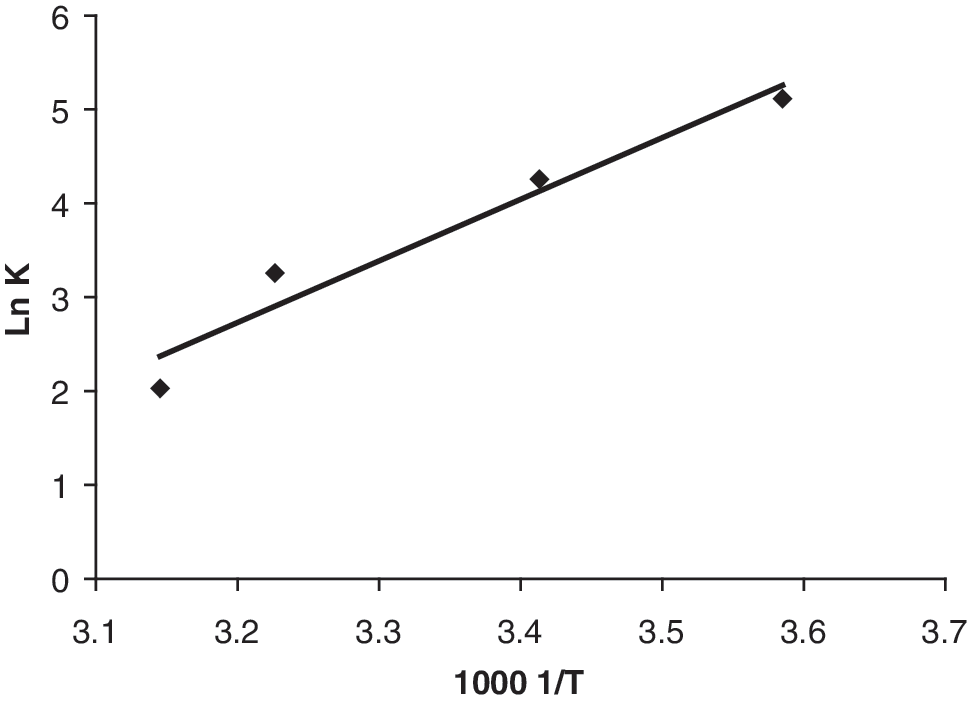
Van't Hoff plot for the interaction of LA and CT-DNA at pH 7.2.
We found that ΔH<0 and ΔS<0; therefore, van der Waals interactions or hydrogen bonds are the main forces in the binding of the LA to CT-DNA. (Table 3).
CD spectral studies
CD spectral techniques give us useful information on how the binding of the metal complex to DNA influences the conformation of DNA. The observed CD spectrum of CT-DNA consists of a positive band at 275 nm due to base stacking and a negative band at 245 nm due to helicity, which is characteristic of DNA in the right-handed B form (Johnson, 1994). Although groove binding and electrostatic interaction of small molecules with DNA show little or no perturbations on the base stacking and helicity bands, intercalation enhances the intensities of both the bands, stabilizing the right-handed B conformation of CT-DNA. Figure 7 shows the CD spectra of DNA taken after incubation of the drug with CT-DNA.

Circular dichroism spectra of DNA (8.0×10⁻⁵) in 10 mM Tris–HCl buffer, in the presence of increasing amounts of LA (r i=[drug]/[DNA]=0.0, 0.05, 0.1, 0.15, and 0.2).
The intensities of both the negative and positive bands significantly decrease (shifting to zero levels). This suggests that the DNA binding of the drug induces conformational changes, including the conversion from a more B-like to a more C-like structure within the DNA molecule (Mahadevan and Palaniandavar, 1998). These changes are indicative of a nonintercalative mode of binding of this drug and offer support of its groove binding nature (Maheswari and Palaniandavar, 2004).
Conclusion
The antiviral drug LA exhibits high binding affinity for CT-DNA. Different instrumental methods were used to investigate the interaction mechanism. The results support the notion that the drug can bind to CT-DNA. The absorption spectrum of the drug shows that as the concentration of DNA increases, a large degree of hypochromism develops in the spectrum. This hyperchromism can be attributed to external contact (surface binding) with the duplex. The observed binding constant (K b=5×10⁴ M−1) is in keeping with groove binding. The fluorescence studies showed an appreciable increase in the drug emission upon addition of DNA. The positive slope in the Van't Hoff plot indicates that the reaction between LA and DNA was enthalpy favored (−126.377 kJ mol−1). CD results showed deep conformational changes in the CT-DNA double helix upon binding with the drug. The results of viscosimetry revealed that the drug effects show a relative increase in DNA viscosity, which is consistent with DNA groove binding. This study is expected to provide greater insight into the use of antiviral drugs as anticancer drugs; further studies are in progress.
Footnotes
Acknowledgment
Financial support from the Razi University Research Center is gratefully acknowledged.
Disclosure Statement
No competing financial interests exist.