




Abstract
The aim of the present study was to develop a diagnostic set of single-nucleotide polymorphisms (SNPs) for discriminating aspirin-exacerbated respiratory disease (AERD) from aspirin-tolerant asthma (ATA) using the genome-wide association study (GWAS) data; the GWAS data were filtered according to p-values and odds ratios (ORs) using PLINK software, and the 10 candidate SNPs most closely associated with AERD were selected, based on 100 AERD and 100 ATA subjects. Using multiple logistic regression and receiver-operating characteristic (ROC) curve analysis, eight SNPs were chosen as the best model for distinguishing between AERD and ATA. The relative risk for AERD in each subject was calculated based on the relative risk of each of the eight SNPs. Ten of the original 109,365 SNPs highly associated (filtered with p<0.001 and ORs) with the risk for AERD were selected. A combination model of the eight SNPs among the 10 SNPs showed the highest area under the ROC curve of 0.9. The overall relative risk for AERD based on the eight SNPs was significantly different between the AERD and ATA groups (p=2.802E-21), and the sensitivity and specificity were 78% and 88%, respectively. The candidate set of eight SNPs may be useful in predicting the risk for AERD.
Introduction
Recently, aspirin hypersensitivity has attracted a great deal of attention because of its association with increased asthma severity, life-threatening asthma attacks, and possible remodeling of both the upper and lower airways (Mascia et al., 2005). Among asthma patients, 25% of those requiring emergency mechanical ventilation are aspirin intolerant (Picado et al., 1989; Marquette et al., 1992). Nevertheless, AERD remains widely underdiagnosed in the asthmatic population due to insufficient awareness of the relationship between aspirin ingestion and asthma exacerbation. In a multicenter study involving 500 patients in 10 European countries, 15% of the patients were unaware of their intolerance to aspirin (Szczeklik et al., 2000). In a Korean cohort study of 730 asthmatics, 35% of those diagnosed with AERD after oral aspirin challenge had no history of aspirin hypersensitivity (Chang et al., 2011). Thus, identification of aspirin hypersensitivity is essential to avoid serious complications (Picado et al., 1989; Marquette et al., 1992; Szczeklik et al., 2000; Stevenson et al., 2001; Gollapudi et al., 2004; Mascia et al., 2005).
Several noninvasive methods of diagnosing AERD have been developed. Flow-cytometric determination of basophil activation in peripheral blood has been proposed for in vitro diagnosis of NSAID hypersensitivity syndrome (De et al., 2010). The levels of galectin-10 mRNA (Devouassoux et al., 2008) and plasma eotaxin 2 (Min et al., 2005) were elevated in subjects with AERD compared with aspirin-tolerant asthma (ATA). Several more proteins are also associated with AERD (Lee et al., 2006). Urine leukotriene E4 and 9alpha, and 11beta in exhaled breath condensate showed high sensitivity and specificity for discriminating between AERD-positive and negative groups (Sanak et al., 2004). Approximately 50 genetic variants in the arachidonic acid pathway (Choi et al., 2004; Kim et al., 2005; Park et al., 2005; Park et al., 2010) and immune and inflammatory pathways (Kim et al., 2008; Oh et al., 2009; Kim et al., 2010) have been reported as risk factors for AERD. However, these single nucleotide polymorphisms (SNPs) have minor effects on the risk for AERD, and they have not been applied as diagnostic biomarkers.
Genome-wide association studies (GWASs) have been conducted to predict genetic variations across the genome that are associated with human diseases and clinical responses to drug treatments (Hirschhorn and Daly, 2005; Roses, 2008). Recently, GWASs of asthma and related phenotypes have reported several susceptibility-associated genes, including ORMDL3, PDE4D, and IL1RL1 (Moffatt et al., 2007; Gudbjartsson et al., 2009; Himes et al., 2009). In a GWAS of 109,365 SNPs in a Korean asthma cohort composed of subjects with AERD or ATA, 11 candidate genes were identified as having the greatest number of different genotypes between the AERD and ATA groups (Kim et al., 2010). Recent studies have sought genetic markers for disease phenotypes using SNPs on multiple genes (Christopher et al., 2007; Robert et al., 2007; Douglas et al., 2008; Wataru et al., 2009). This prompted us to develop a set of SNP markers for predicting AERD, using the relative risks for AERD associated with the SNPs identified in our previous GWAS study, which compared the AERD and ATA groups using a multiple logistic regression model. In the present study, candidate SNPs associated with AERD were selected from among the GWAS data, and the risks associated with each SNP as well as the overall relative risk associated with a set of candidate SNPs (Jun et al., 1998; Sistrom and Garvan, 2004) were obtained to compare the AERD and ATA groups.
Materials and Methods
Study subjects
The subjects and GWAS data were presented in our previous study (Kim et al., 2010). Briefly, Korean subjects were recruited from the Genome Research Center for Allergy and Respiratory Diseases in the Soonchunhyang University Hospital in Korea over the span of about 6 years (2003–2008). All patients met the definition of asthma as defined by the Global Initiative for Asthma guidelines (Bateman et al., 2008). The clinical characteristics of the AERD and ATA groups are compared in Table 1. An aspirin-induced decline in FEV1 of −15% to 68% was observed in all study subjects, with a significantly greater decline in the AERD subjects than in the ATA subjects (Chang et al., 2011). The percentage of predicted FEV1 and PC20 methacholine were significantly lower in the AERD group than that of predicted FEV1 and PC20 methacholine in the ATA group (p<0.001).
Values are means±SD, except as indicated.
p<0.0001.
p<0.01.
AERD, aspirin-exacerbated respiratory disease.
Genome-wide SNP genotyping and quality control
A total of 109,365 SNPs genotyped in the DNA samples of 100 AERD and 100 ATA subjects were obtained from our previous study (Kim et al., 2010). The overall call rate of individual samples was >98.0% after passing the genotype quality threshold. Owing to the relatively small number of study subjects, quality control involved exclusion of SNPs with a minimum allele frequency <0.1 for both the AERD group and the ATA group, those showing significant deviation from the Hardy–Weinberg equilibrium (<0.001). SNPs on the X and Y chromosome were also excluded from the analysis.
GWAS statistical analysis
Identification of the relationships between subjects was based on pairwise identity using PLINK 1.07 software (Purcell et al., 2007). Based on the genome-wide indentify-by-state (IBS) information calculated by PLINK, one subject was excluded. The population structure of the remaining subjects was determined, and four subjects were excluded because of low genotyping (missing genotype per subject, <10%). Allelic tests, genotype tests, and Cochran-Armitage trend tests were used to examine the association between genotypes and AERD and to calculate odds ratios (ORs) per allele. Confidence intervals (95% CI) were estimated using Chi-square tests. A quantile–quantile plot was used to evaluate overall significance of the genome-wide association results and the impacts of population stratification.
Selecting candidate SNPs for genetic markers and genetic risk factors
To select candidate SNPs for discriminating between the AERD and ATA groups, multiple logistic regression was performed using R (ver. 2.8.1;
Results
Genome-wide SNP genotyping and quality control
Two hundred Korean asthma patients were genotyped using Human-1 Genotyping BeadChip (Illumina, Inc., San Diego, CA). After stringent quality control, we obtained 94,609 SNPs. Four samples were excluded from the analysis because of low genotyping (<10%), and one sample was excluded based on genome-wide IBS information. To ensure that the AERD and AIA groups were genetically matched, multidimensional scaling (MDS) was used to exclude population outliers (Supplementary Fig. S1; Supplementary Data are available online at
CHR, chromosome number; bMAF, minimum allele frequency; cOR, odds ratio.
SNP, single-nucleotide polymorphism.
Multiple logistic regression and ROC curve analysis of the 10 selected SNPs
Using the 10 SNPs as candidate biomarkers, we performed a multiple logistic regression analysis for all elements of the power set of candidate SNPs under an additive model, and measured all AUC values of the ROC curves to select AERD-specific diagnostic marker SNPs for discriminating between AERD and ATA. First, we made 1,023 (210–1) models for all 10 SNPs and determined the p-values of the coefficients for each model. We selected models in which all p-values of the SNP coefficients were <0.05. Among the 1,023 models, 544 models were selected. Data from the 544 models for AUC values and p-values (<0.05) are presented in the Supplementary table (Supplementary Table S1). The model consisting of eight SNPs (rs139719, rs3213729, rs4501026, rs4867084, rs6659655, rs6714952, rs6911768, and rs746035) showed the best performance, with an AUC of 0.90, an asymptotic p-value of 3.432E-21, and an asymptotic 95% CI of 0.855 to 0.942. Figure 1 shows the ROC curve for the eight-SNP model.
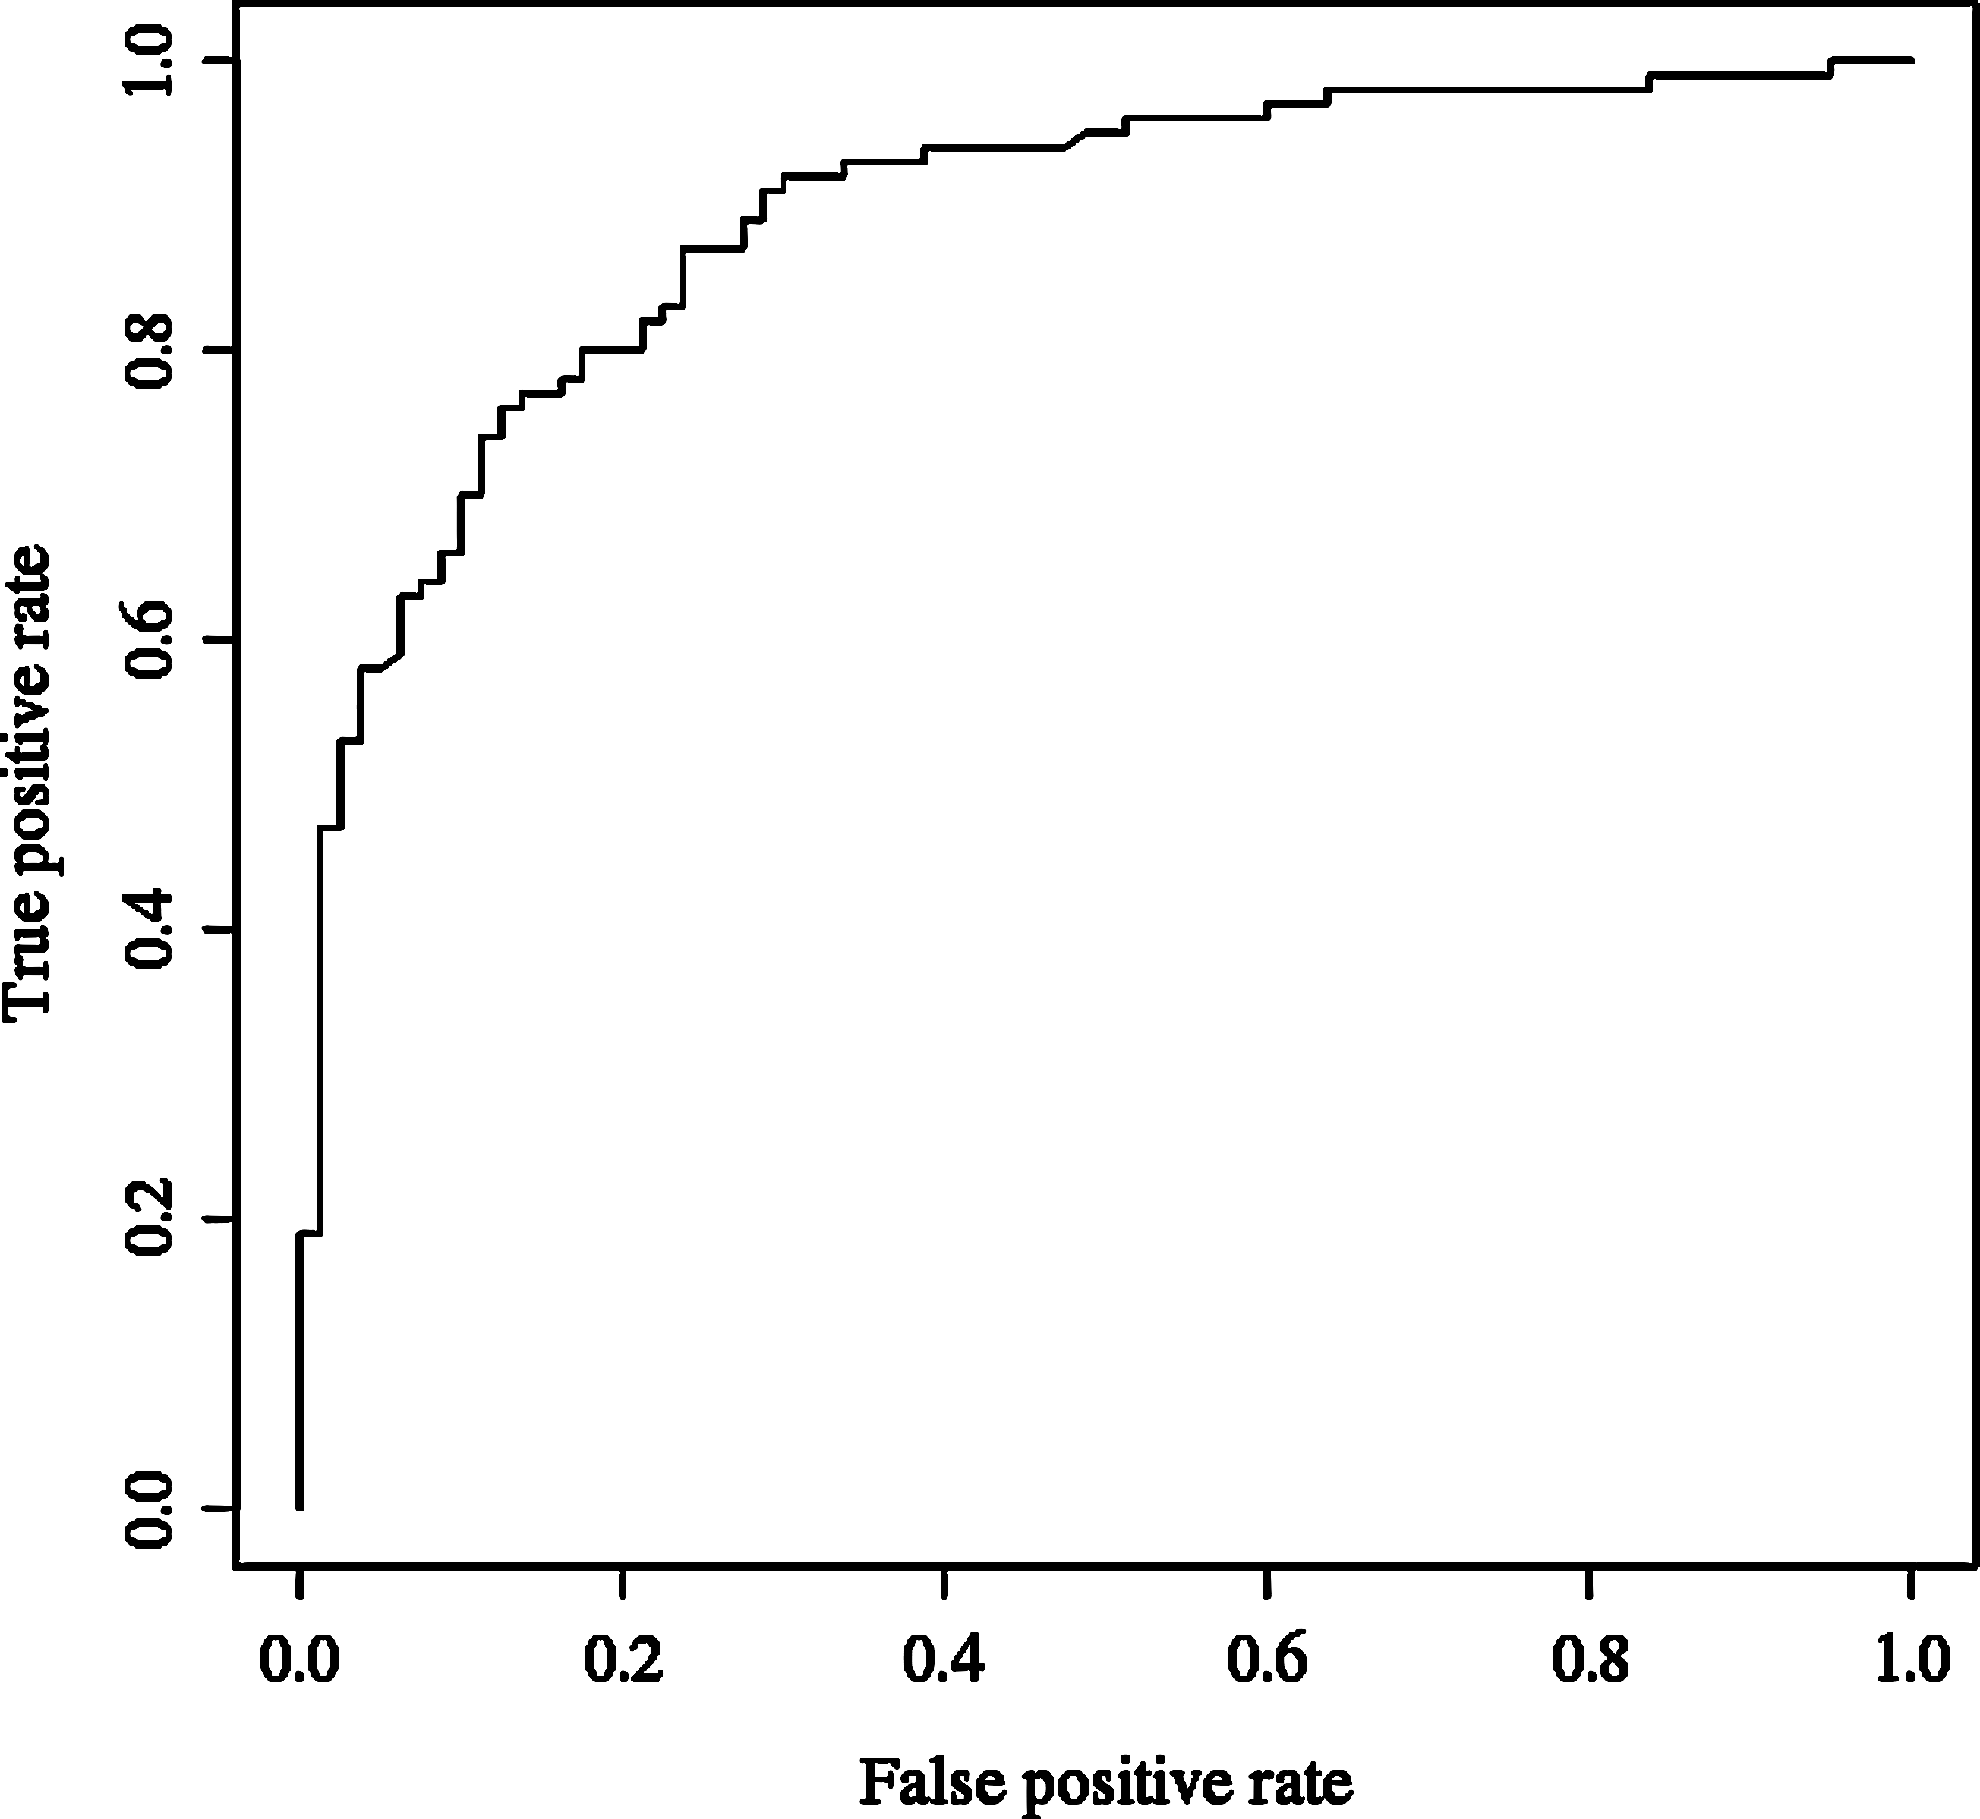
Receiver-operating characteristic curve for the best model using eight single-nucleotide polymorphisms.
Calculating genetic risk based on the eight candidate SNPs
We calculated the relative risk associated with each of the eight SNPs (Table 3), following the procedure presented by decode health (
Using the calculated relative risk for each genotype and the genotypes of the 195 samples, the overall genetic risk for AERD of each individual subject was calculated. The overall genetic risks of the samples were compared between the AERD and ATA groups using the Mann–Whitney t-test. The overall relative risk for AERD differed significantly between the two groups (p=2.802E-21), as illustrated in Figure 2.
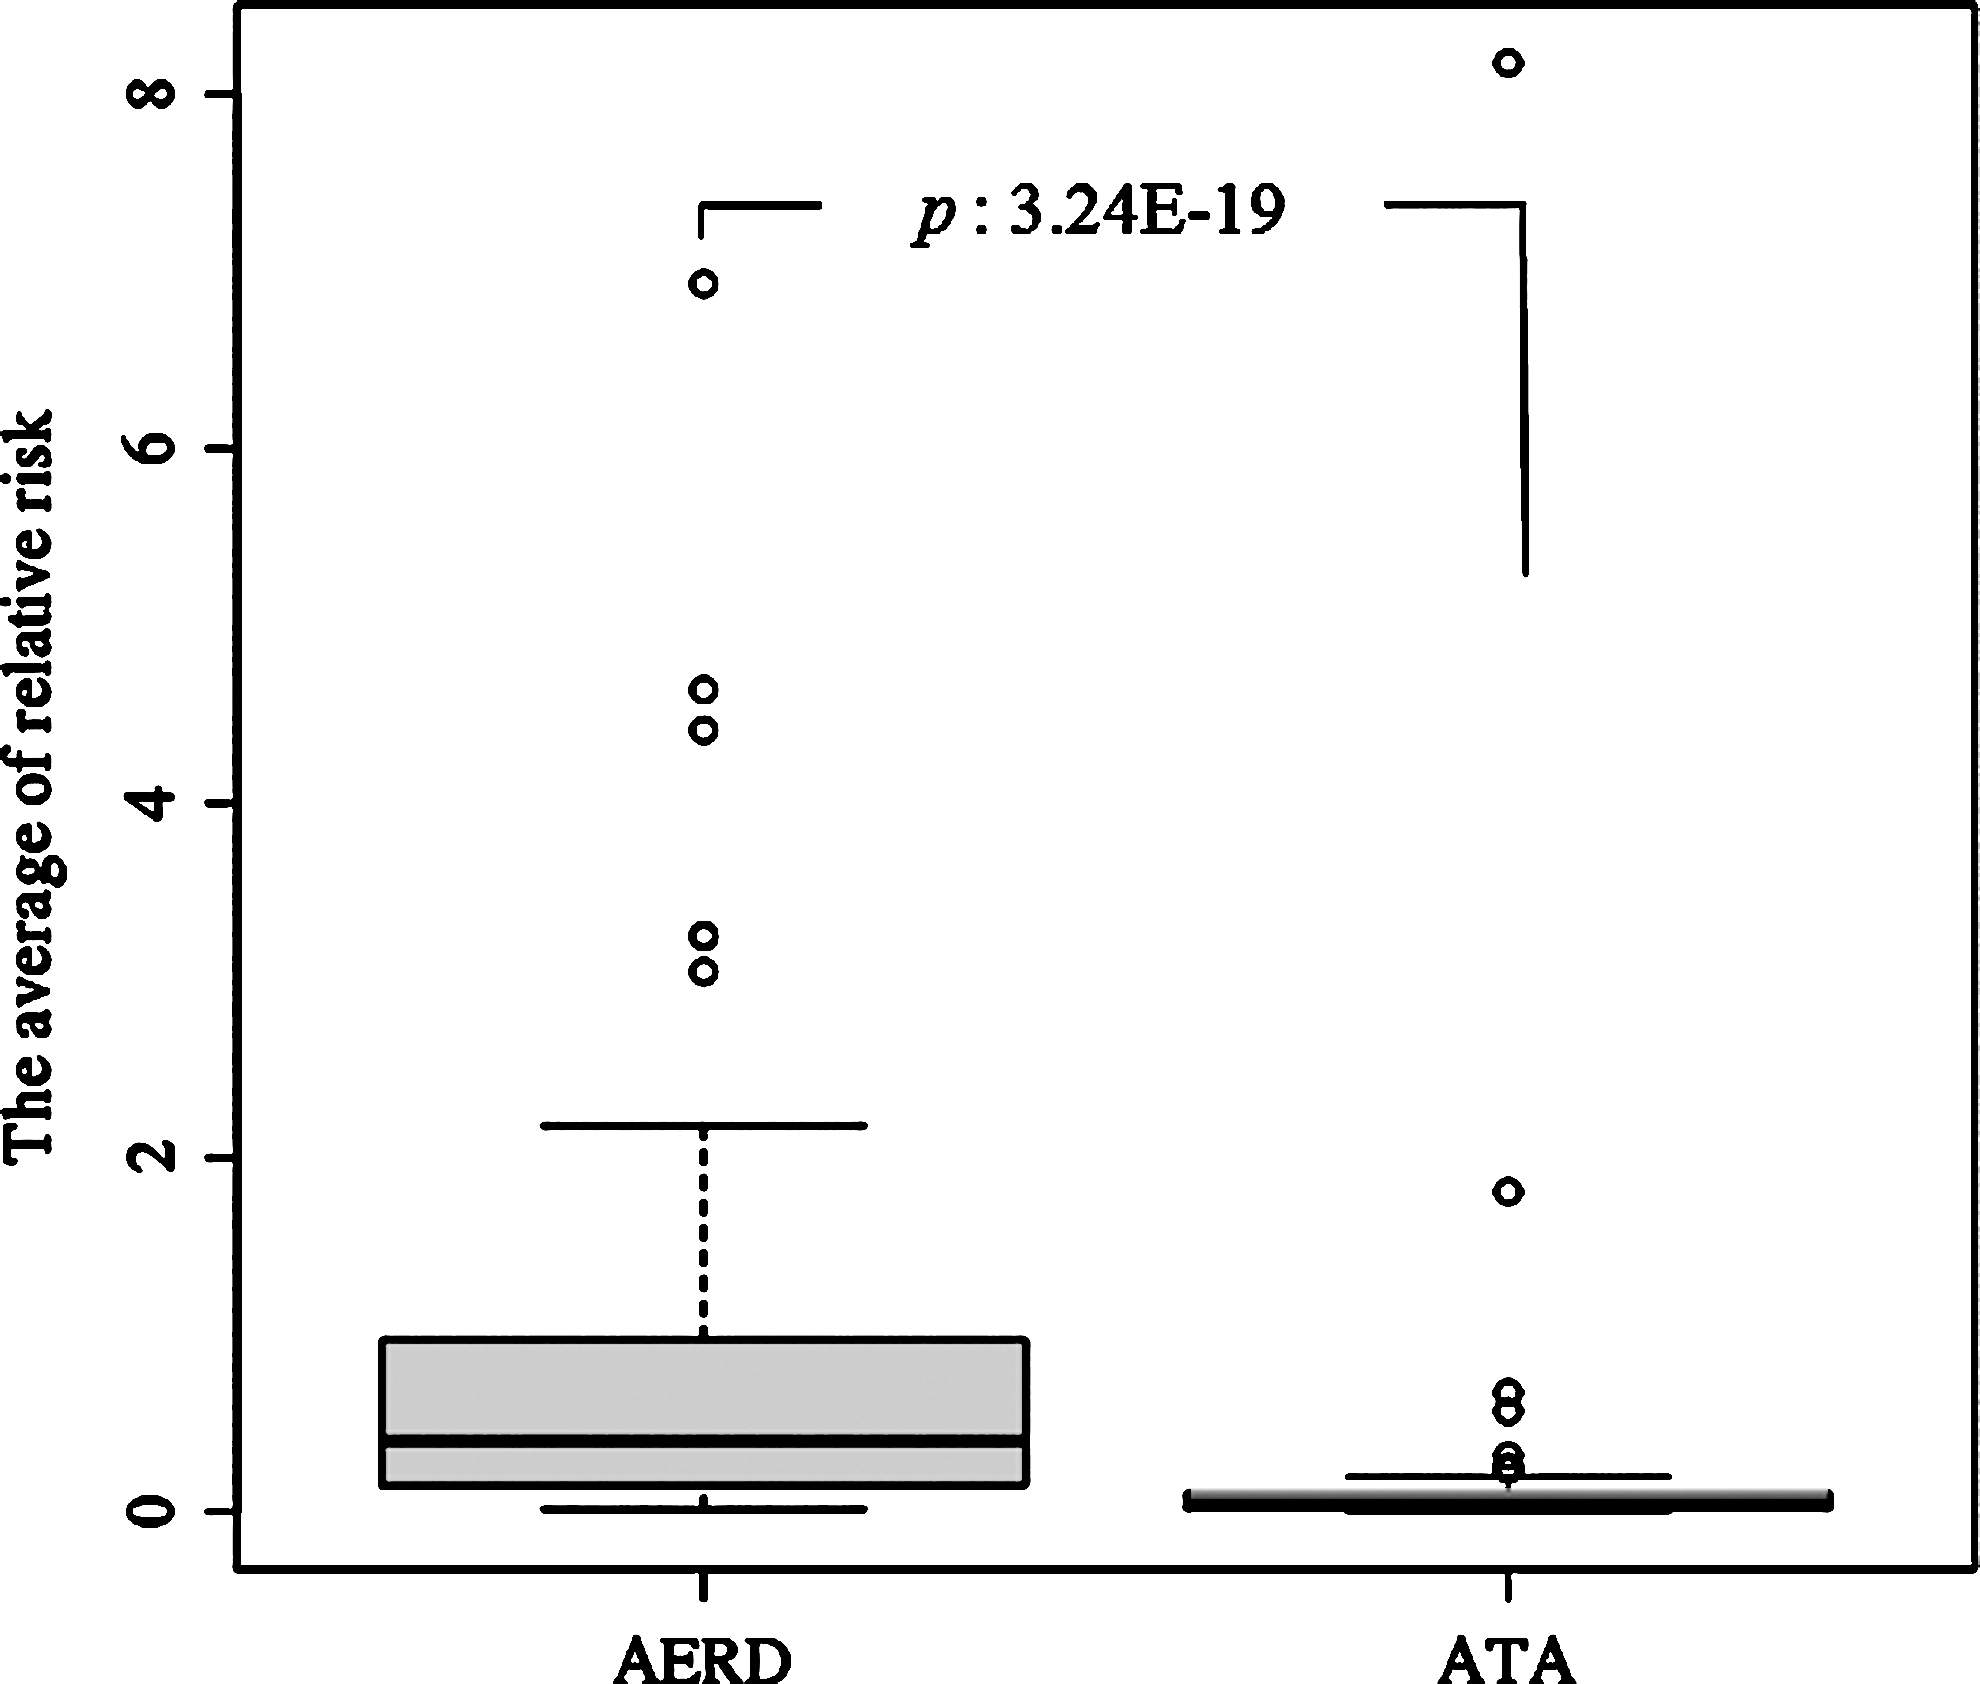
Boxplot showing the overall genetic risk for the aspirin-exacerbated respiratory disease (AERD) and aspirin-tolerant asthma (ATA) groups.
Using 195 samples, the discriminate power of the eight SNPs was determined by multiple logistic regression analysis. The sensitivity and specificity of the eight-SNP model were 78% and 88%, respectively (Table 4).
Samples with missing values were excluded: AERD, 4; ATA, 1.
Discussion
In the present study, we analyzed our previous GWAS data and identified a set of eight SNPs with sufficient discriminative power to distinguish between AERD and ATA.
From a total of 200 subjects, four were excluded because of low genotyping, and one was excluded based on genome-wide IBS information. A total of 2,725 SNPs were also excluded based on quality control. An MDS analysis plot of the 96 AERD and 99 ATA showed no evidence of population stratification, suggesting no systematic difference in allele frequencies between the two groups. To identify candidate SNPs for discriminating between the AERD and ATA groups, the GWAS data were filtered first based on p-values and then based on ORs, which represent the ratio of the odds of an event occurring in one group to the odds of the event occurring in another group (Cornfield, 1951).
Different two-candidate SNP sets (10 SNPs for each set) were selected using both Chi-square tests and multiple logistic regression method for ROC curve analysis. In the ROC curve analysis, the best AUC calculated using the 8-candidate SNPs, which selected by Chi-square and ORs was slightly better than the best AUC calculated using the 9-candidate SNPs selected by multiple logistic regression in our GWAS data (chi-square test: 0.90, multiple logistic regression: 0.89). The best model that consisted of the selected 8 SNPs showed the high discriminative power distinguishing between the AERD and ATA groups, with 78% sensitivity and 88% specificity.
In our previous study, the same data were analyzed by multiple logistic regression analysis, but only p-values, and not ORs, were used to filter the data (Kim et al., 2010). In that study, the best 11 SNPs with the lowest p-values were selected as markers for AERD. Only two of the eight SNPs identified in the present study [rs3213729 (WDR21A) and rs4867084 (PDZK3)] were among those identified in our previous study. In the previous study, polymorphisms of rs2252867 in the CEP68 gene (p=0.00007) showed the most significant correlation with AERD compared with ATA in a codominant model by the multiple logistic regression. However, rs2252867 (CEP68) was excluded in the present study, because its p-value (0.001228) was higher than the threshold (p=0.001) when we applied the qui-square test.
We calculated the relative risk for AERD associated with each of the eight SNPs. Using these values, the combined overall genetic risk of each subject was calculated. To verify the combined overall genetic risk, we applied a t-test, which showed that the risk was significantly different between the AERD and ATA groups (p=2.802E-21). This suggests that the eight SNPs have sufficient discriminating power for use as genetic markers to distinguish between AERD and ATA. In addition, the combined genetic risk of a subject based on the eight SNPs may be useful for diagnosing AERD.
The genes containing the eight SNPs identified in the present study were not directly related to the arachidonic acid pathway, which has been regarded as the basic pathway of AERD. Functional information for three of the genes containing an SNP, WDR21A (rs3213729), LINC00314 (rs4501026), and SGSM1 (rs139719), is not known, but information is available for the remaining five genes. PARK2 (rs6911768) is a stress-inducible protein involved in protecting cells from stress-induced cell death (Bouman et al., 2011) VRK2 (rs6714952), CHST11 (rs746035), and PDZK3 (rs4867084) are associated with inflammation, similar to transcription factor NF-κB and interleukins (Blanco et al., 2008; Willis et al., 2009; Plant et al., 2011). CENPF (rs6659655) may play a role in chromosome segregation during mitosis. These observations are important, given that variants in the immune and inflammatory pathways are risk factors for AERD (Moffatt et al., 2007; Gudbjartsson et al., 2009; Himes et al., 2009). The limitation of the study was the small sample size in the present study, and consideration will be given to performing a subsequent corroborative study with larger numbers of patients, which will include comparisons to a normal control population.
Conclusion
In conclusion, we analyzed our GWAS data and selected a set of eight SNPs with sufficient discriminative power to distinguish between AERD and ATA. Ten SNPs were initially selected based on p-values and ORs using PLINK software, and the final eight SNPs were selected based on ROC curve analysis and multiple logistic regression. The relative risk was calculated for the genotypes of each of the eight SNPs, and the combined overall genetic risk of each subject was calculated. The combined overall genetic risk based on the eight SNPs differed significantly between the two groups. The eight SNPs showed high discriminative power for distinguishing between AERD and ATA, and may be useful genetic markers for diagnosing AERD.
Footnotes
Disclosure Statement
No competing financial interests exist, and there was no conflict of interest in the study.
References
Supplementary Material
Please find the following supplemental material available below.
For Open Access articles published under a Creative Commons License, all supplemental material carries the same license as the article it is associated with.
For non-Open Access articles published, all supplemental material carries a non-exclusive license, and permission requests for re-use of supplemental material or any part of supplemental material shall be sent directly to the copyright owner as specified in the copyright notice associated with the article.
