




Abstract
TLR5 is responsible for the recognition of bacterial flagellin in vertebrates. In this study, we cloned the TLR5M gene of common carp using the rapid amplification of cDNA ends (RACE) method. The TLR5M cDNA was 3182 bp in length and contained a 2658-bp open reading frame, which encoded a protein of 885 amino acids (aa). The entire coding region of the TLR5M gene was successfully amplified from genomic DNA and contained a single exon. The aa sequence of carp TLR5M showed the highest similarity (84.46%) to Cirrhinus mrigala. Tissue-specific expression analysis of the TLR5M gene by quantitative real-time polymerase chain reaction revealed its broad distribution in various organs and tissues; however, the highest level of TLR5M expression was noted in the liver. TLR5M gene expression was examined after flagellin stimulation and showed highly significant (p<0.01) induction in the spleen, heart, liver and kidney. The induction of TLR5M was analyzed in various organs infected with Aeromonas hydrophila. TLR5M gene expression in the kidney and spleen was significantly (p<0.01) increased. Concurrently, modulation of TLR5M gene expression and the induction of IFN-γ, IL-1β, IL-10 and TNF-α4 were analyzed in peripheral blood leucocytes after lipopolysaccharide, concanavalin A, and flagellin stimulation. In the treated group, significant induction of these genes was noted, although the intensity varied between the tissues. These findings may indicate a crucial role for TLR5M in the innate immunity of common carp in response to pathogenic invasion.
Introduction
TLRs contain an extracellular N-terminus with a leucine-rich repeat region (LRR), a transmembrane domain and an intracellular C-terminus with a Toll/IL-1 receptor domain (TIR). The cytoplasmatic TIR domain harbors conserved amino acids (aa) that have been shown to be involved in the signaling and localization of the TLR (Slack et al., 2000; Funami et al., 2004), whereas the LRR region is involved in pathogen recognition (Bell et al., 2003). Several key teleost TLRs (TLR2, TLR4, TLR5 and others) have high structural similarity to the mammalian TLR system. However, fish TLRs also exhibit very distinct features and a high level of diversity, which is likely derived from their diverse evolutionary history and distinct environments. Unlike mammals, fish have two types of TLR5 variants: a membrane-bound form (TLR5M) and a soluble form (TLR5S). The major difference between the two is that TLR5S does not contain a transmembrane domain. Thus far, no soluble TLR5 has been found in mammalian genomes (Rebl et al., 2010). In humans, TLR5 is expressed in dendritic cells, monocytes and intestinal epithelial cells; in mice, it is expressed in splenic macrophages and dendritic cells.
TLR5 in mammals and fish has been shown to recognize flagellin, which is a component of bacterial flagella and responsible for flagellin-mediated NF-κB activation (Hayashi et al., 2001; Tsujita et al., 2004). TLR5-deficient mice lack the flagellin-induced pulmonary inflammatory response (Feuillet et al., 2006) and are more susceptible to Escherichia coli infection of the urinary tract (Andersen-Nissen et al., 2007). In mammals, TLR5 is also believed to be involved in adaptive immunity by promoting of the differentiation of helper T cells and native B cells into immunoglobulin A; thus, producing plasma cells in response to flagellin (Uematsu et al., 2008). In recent years, TLR5 gene varieties have been identified in teleosts, including Ictalurus punctatus (GenBank ID NP001124067) (Bilodeau and Waldbieser, 2005), Cirrhinus mrigala (GenBank ID AEQ92867) (Basu et al., 2012), Danio rerio (GenBank IDNM_001130595) (Jault et al., 2004), Salmo salar (GenBank ID NP001117163) (Tsoi et al., 2004), Oncorhynchus mykiss (GenBank IDNP001117680) (Mao et al., 2011), Plecoglossus altivelisaltivelis (GenBank ID AB516397) (Suzuki and Izumi), Takifugu rubripes (GenBank ID AAW69374) (Roach et al.) and Ctenopharyngodon idella (GenBank ID ACH61786) (Jang et al.).The sequence of a cDNA clone of TLR5M has not yet been reported in common carp.
In this study, we cloned and characterized the TLR5M cDNA from common carp based on an expressed sequence tag (EST) library constructed by our laboratory. Furthermore, we reported TLR5M expression changes in response to ligand exposure and Aeromonas hydrophila infection in different tissues and measured TLR5M expression levels upon stimulation with motigen and flagellin in peripheral blood leucocytes by quantitative real-time polymerase chain reaction (qRT-PCR). The study may be of potential use for further research regarding carp TLR5M gene structure, biological function and immune regulation response.
Materials and Methods
cDNA library
A cDNA library from carp peripheral blood leucocytes stimulated by lipopolysaccharide (LPS) and concanavalin A (ConA) (Lu et al., 2004a), and a cDNA library from normal carp peripheral blood leucocytes (Lu et al., 2004b) were constructed according to the provided references.
Total RNA extraction
Total RNA was extracted from the gill tissue of healthy common carp purchased from the local fish farm (Changchun, China) using Trizol (Invitrogen), according to the manufacturer's protocol. In this experiment, the total RNA was analyzed using a UV spectrophotometer, and the OD260/OD280 was 1.8–2.0. Using 1% agarose gel electrophoresis, 18S and 28S bands could be observed. Therefore, these results showed that the quality and integrity of the total RNA were good.
Acquisition of TLR5M cDNA
Our laboratory has sequenced 10,000 EST clones from the cDNA library. The clone encoding carp TLR5M was transformed and identified, and the primers M13 and T7 (supplied by TaKaRa) were used for sequencing. The sequences of primers used in the study had been shown in Table 1. The total RNA was reverse transcribed and subsequently used as a template for PCR. The full-length cDNA sequence of TLR5M was obtained using a 5′-rapid amplification of cDNA ends (RACE) kit (TaKaRa) according to the manufacturer's instructions. PCR amplifications were performed by nested PCR with specific primers to obtain specific PCR products. The forward primers (FOuter primer, FInner primer) were provided by the kit. The carp TLR5M EST sequence was also used for designing the reverse primers (ROuter primer, RInner primer) for 5′-RACE. The products were purified using an agarose gel DNA extraction kit (Roche), ligated into a pMD18-T cloning vector (TaKaRa) and transformed into E. coli DH5α competent cells (prepared in our laboratory) before sequencing (Sango, China).
EST, expressed sequence tag; RACE, rapid amplification of cDNA ends; RT-PCR, real-time polymerase chain reaction.
Total genomic DNA extraction
Total genomic DNA was extracted from carp spleen with the ChargeSwitch® gDNA kit (Invitrogen).
Acquisition of the TLR5M gene
Primer pairs (Fgenomic, Rgenomic) covering the entire open reading frames (ORFs) of carp TLR5M were designed. The TLR5M gene was amplified by PCR from total genomic DNA under the following conditions: one cycle of initial denaturation at 95°C for 3 min, followed by 30 cycles of 94°C for 30 s, 55°C for 90 s, 72°C for 90 s and a final extension at 72°C for 10 min. The PCR products were cloned and sequenced as described above. The genomic nucleotide sequences were compared with cDNA sequences to determine the exon-intron boundaries of the gene.
Sequence analysis
Nucleotide sequences were analyzed using the basic local alignment search tool (BLAST). Comparisons between aa sequences were performed using DNAMAN software and ClustalW. The TMHMM program was used to predict potential transmembrane regions.
Phylogenetic analysis
The phylogenetic tree was constructed from aa sequence alignments by the minimum-evolution method using MEGA version 4.1 software. Indels were removed from the multiple alignments for the construction of phylogenetic trees. The reliability of the trees was assessed by bootstrapping using 1000 bootstrap replications or by the interior branch method (Sitnikova et al., 1995).
Basal expression of TLR5M in different tissues
To study the basal expression of the TLR5M gene in various tissues, including the kidney, muscle, brain, spleen, gill, heart, and liver tissues, were collected separately from carp fingerlings (∼30 g), total RNA was isolated from each sample, and cDNA was prepared. qRT-PCR was carried out to analyze TLR5M gene expression, and β-actin was amplified as an internal control for qRT-PCR and to determine the concentrations of the templates. To account for individual variation, samples from three fish were collected and analyzed separately by qRT-PCR, and their mean value was considered. We designed and synthesized two pairs of primers (FTLR5M, RTLR5M; Fβ-actin, Rβ-actin) according to the full-length cDNA sequences of carp TLR5M and β-actin (GenBank ID M24113). The expression levels of carp TLR5M in different tissues were analyzed using qRT-PCR with SYBR Green dye. qRT-PCR was performed using the ABI7500 Real Time PCR System. The reaction consisted of 40 cycles, with an annealing temperature of 60°C. Additional details regarding the RT-PCR method employed are provided in the instruction manual of the two-step PCR kit (TaKaRa). Each value was analyzed for significant differences according to the sequence detection software (SDS; version 1.3.1.21) of the 7500 system. The data obtained from qRT-PCR analysis was expressed as the mean of three individual experiments±standard error. The statistical significance of differences between groups was determined by Student's t-test; p<0.05 was accepted as a significant difference.
Bacterial strains culture and flagellin purification
Bacterial strains (A. hydrophila strain Ahcs01) came from our own lab. Bacteria were grown aerobically overnight either in brain heart infusion broth (BHIB; Oxoid), or on Luria-agar (LBA). Bacteria from 1 L of BHIB grown statically (37°C, 16 h) were harvested and resuspended in 50 mL of 20 mM Tris-Cl buffer (pH 8.0). Flagella were removed from the bacterial suspension by homogenization on ice (speed 5, 5 min) with a “whirring type” blender (Kinematica). Bacteria were pelleted by centrifugation (10,000g, 4°C, 30 min), and the supernatant was filtered through a 0.2-μm (pore-size) membrane. Partially purified flagellin protein was recovered by the addition of solid ammonium sulfate to a concentration of 20%. This solution was gently agitated overnight at 4°C, and the precipitate was recovered by centrifugation (20,000g, 4°C, 30 min). The pellet was resuspended in 1 mL of 20 mM Tris-Cl buffer (pH 8.0) and dialyzed against the same buffer. Flagellin samples were separated on sodium dodecyl sulfate-polyacrylamide gels (12%) and transferred onto Hybond-C (Amersham) nitrocellulose membrane and the band corresponding to the flagellin was excised. Ice-cold acetone was added to the excised membrane to dissolve the nitrocellulose and precipitate the protein. The protein was pelleted by centrifugation (13,000g, 4°C, 10 min) and washed three times with ice-cold acetone. Residual acetone was removed under vacuum, and the purified flagellin was resuspended in 500 μL of 20 mM Tris-Cl (pH 8.0).
Expression of TLR5M during ligand exposure and bacterial challenge in different tissues
Healthy carp fingerlings (∼30 g) were divided into two groups (control and stimulated) of three fish each. For in vivo treatment, purified flagellin from A. hydrophila was diluted in sterile endotoxin-free water, and 100 mL of phosphate-buffered saline (PBS) containing flagellin (750 ng/fish) was injected intravenously (i.v.) through the caudal vein. The control group was injected with 100 mL of PBS only. For bacterial infection, each fish received an intraperitoneal (i.p.) injection of 1 mL of 50×LD50 fresh A. hydrophila (5×10⁷/mL). The control group was injected with 100 mL of PBS only. After 4 h of treatment with flagellin and 24 h of treatment with bacteria, the fish in control and treated groups were sacrificed, and kidney, muscle, brain, spleen, gill, heart, and liver tissues were collected separately in Trizol reagent and stored at −80°C until further analysis. Subsequently, qRT-PCR was carried out as described above. The data obtained from qRT-PCR analysis were expressed as the means of three individual experiments±standard error. The statistical significance of differences between groups was determined by Student's t-test; p<0.05 was accepted as a significant difference.
Expression of TLR5M in carp peripheral blood leucocytes under different stimuli
To examine the transcription of carp TLR5M, the separated carp peripheral blood leucocytes were cultivated in vitro and stimulated with LPS (50 μg/mL; Sigma) for 4 and 12 h and ConA (50 μg/mL; Sigma) for 4 and 24 h (Lu et al., 2004a, 2004b). The total RNA was extracted using a kit as described above. Subsequently, qRT-PCR was performed, and the mRNA expression levels of IFN-γ (GenBank ID JX181981), IL-1β (GenBank ID AJ245635), IL-10 (GenBank ID JX524551) and TNF-α4 (GenBank ID JX181982) in the stimulated and control groups were determined using the methods described above. The data obtained from qRT-PCR analysis were expressed as the means of three individual experiments±standard error. The statistical significance of differences between groups was determined by Student's t-test; p<0.05 was accepted as a significant difference.
Expression of TLR5M and inflammatory cytokines in carp peripheral blood leucocytes during flagellin exposure
To examine the transcription of TLR5M and inflammatory cytokines (IFN-γ, IL-1β, IL-10, and TNF-α4), the separated carp peripheral blood leucocytes were cultivated in vitro and stimulated with flagellin (10 μg/mL) for 4, 12, and 24 h. The total RNA was extracted using a kit as described above. Subsequently, qRT-PCR was performed. The data obtained from qRT-PCR analysis were expressed as the means of three individual experiments±standard error. The statistical significance of differences between groups was determined by Student's t-test; p<0.05 was accepted as a significant difference.
Results
Cloning and sequence analysis of the full-length TLR5M cDNA from common carp
The full-length cDNA of common carp was obtained using an EST library and 5′-RACE. First, we obtained a 1268-bp fragment from the EST library. Subsequently, we amplified a 2078-bp fragment using 5′-RACE PCR. As a result, a 3182-bp nucleotide sequence representing the complete cDNA of carp TLR5M was obtained. This sequence contained an ORF of 2658 bp encoding a protein 885 aa in length (Fig. 1). This sequence was submitted to GenBank and assigned the accession number KC347572. The 5′ and 3′ untranslated regions (UTRs) were 38 and 486 bp, respectively. The putative protein has a molecular mass of 101,219 u and a PI of 5.85.
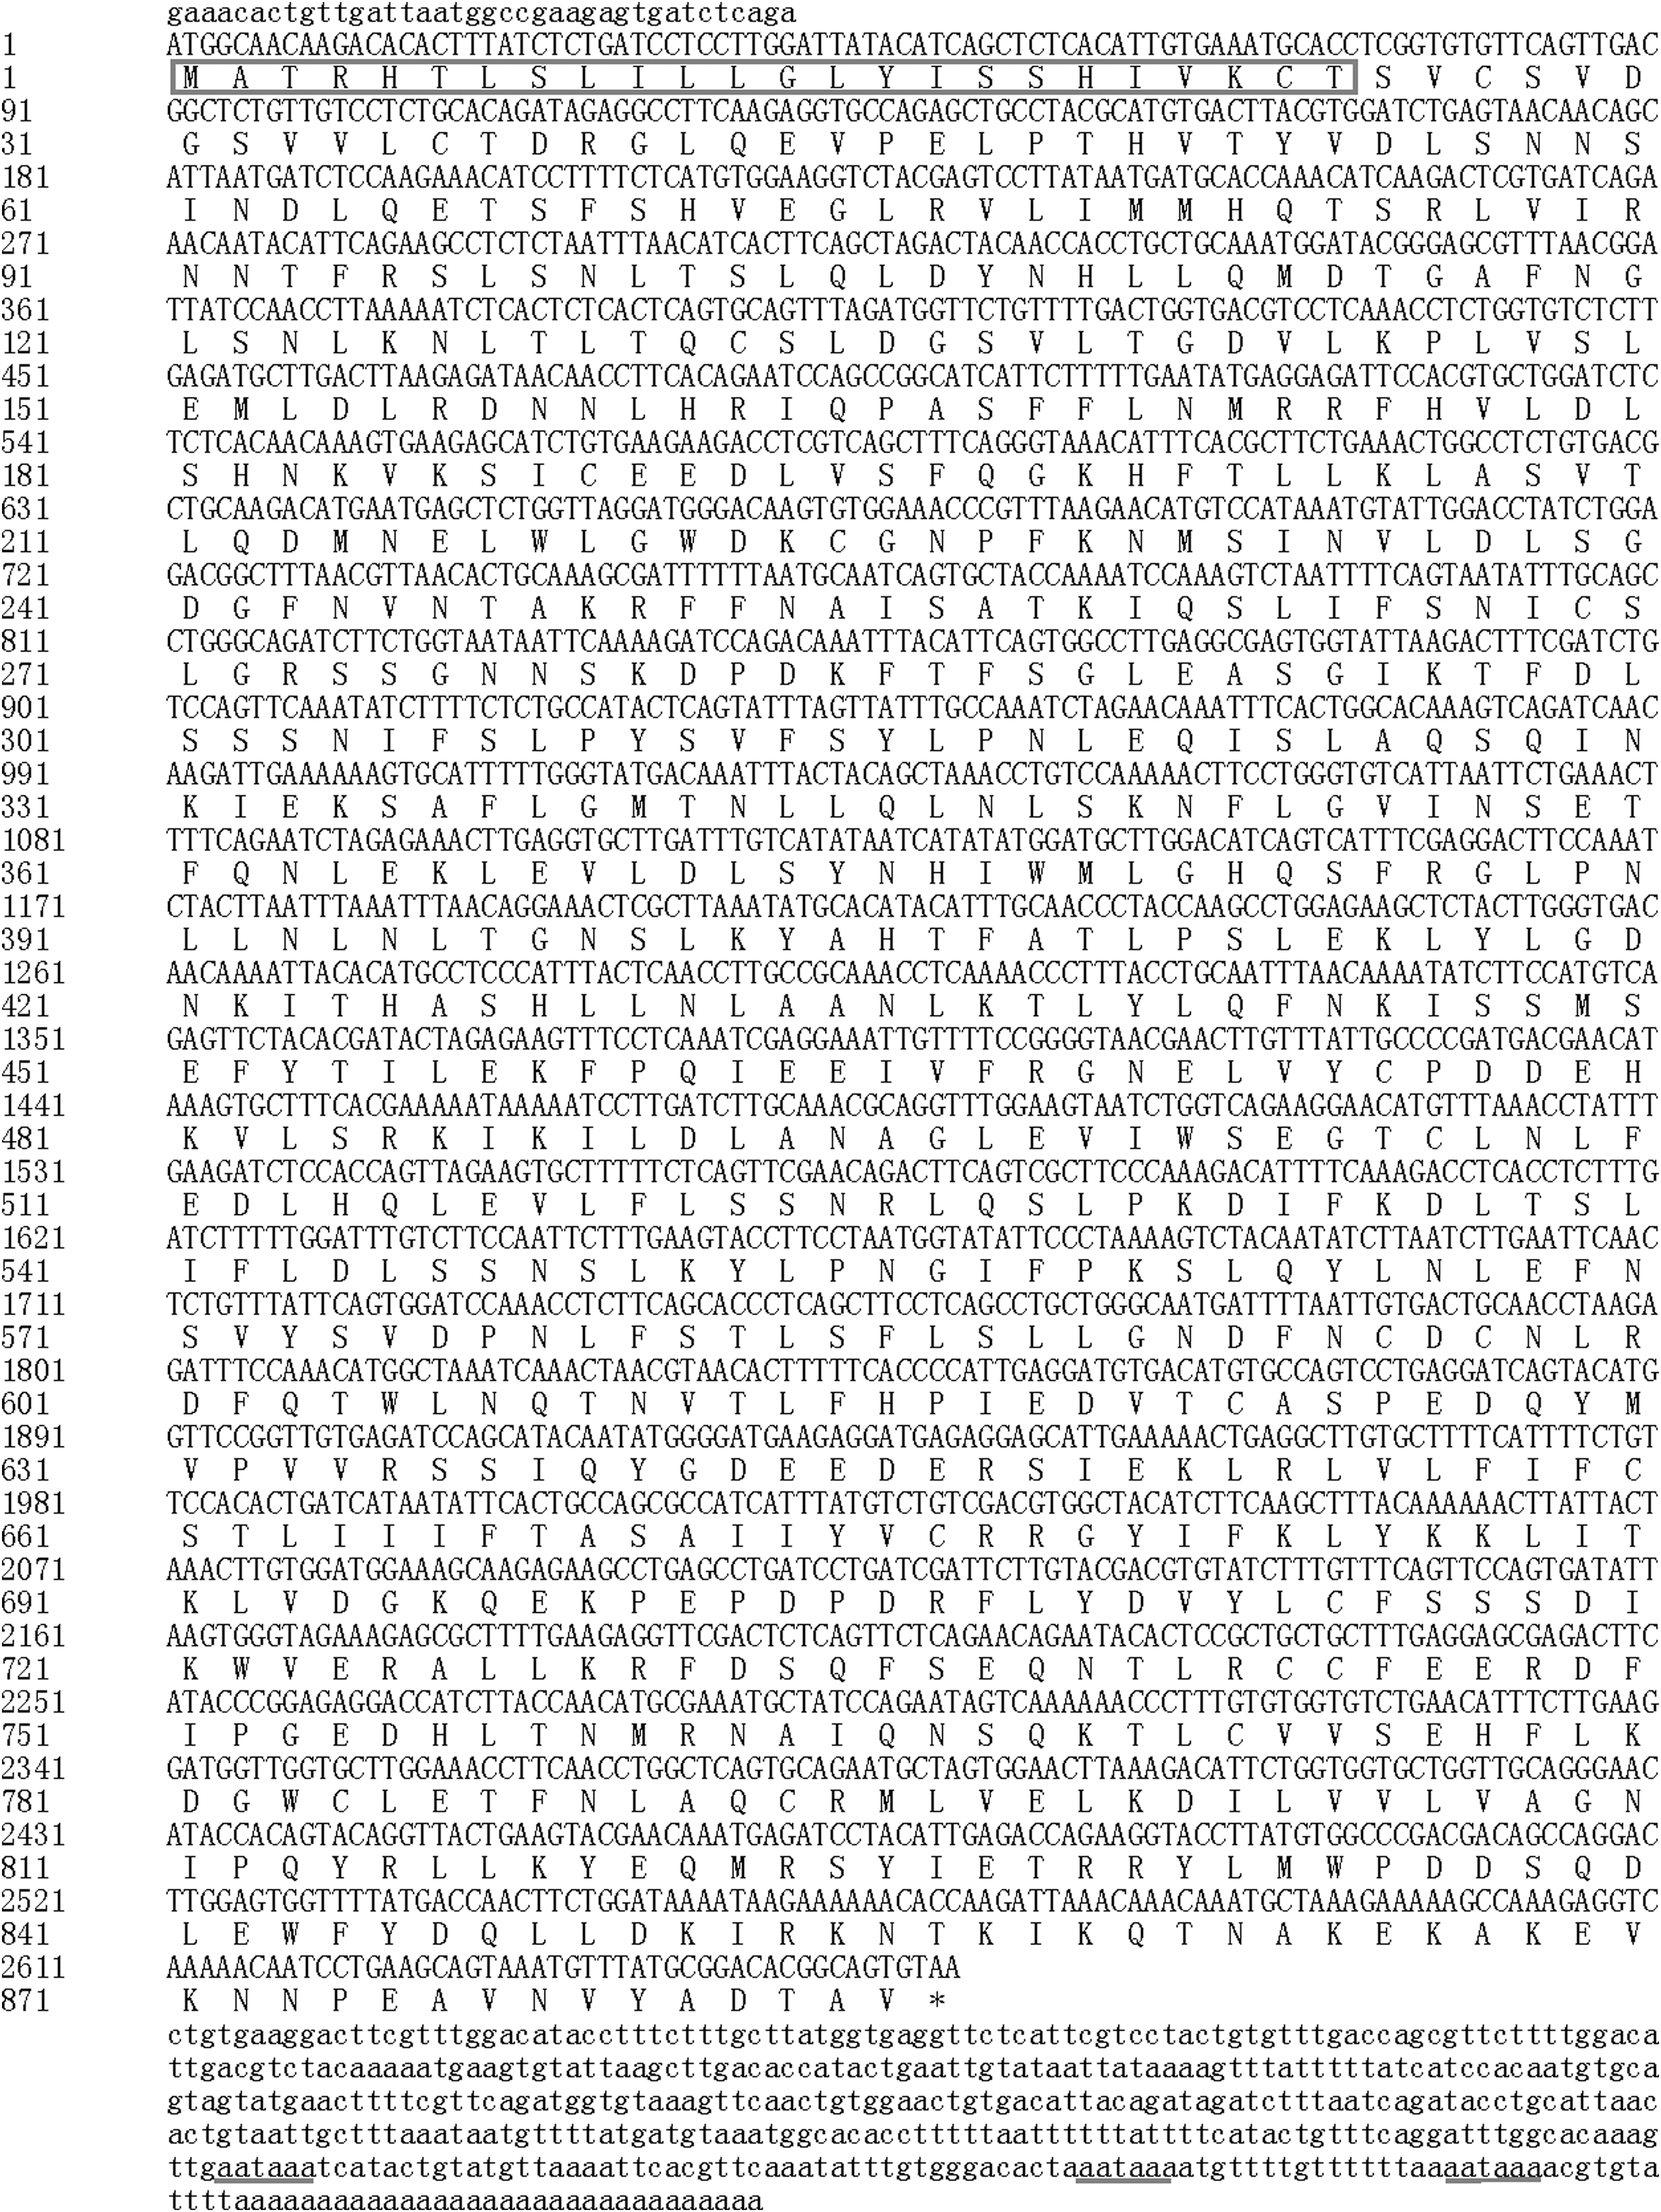
Nucleotide and deduced amino acid (aa) sequences of common carp TLR5M gene. The initiation codon is ATG, TAA is the termination codon; aa sequence of the predicted signal peptide sequence is in black frame; the polyadenylation signal (aataaa) is underlined.
Analysis of the aa sequence and structure within the putative ORF revealed a transmembrane domain at aa positions 654–676, a signal peptide sequence encompassing the first 24 aa residues of the N-terminal region and a cleavage site within Thr24 and Ser25 that produces the mature peptide. PSIPRED3.0 was used to analyze the secondary structure of the TLR5M aa sequence. The result showed that the form was 36.16% helix, 11.53% lamellar structure and 52.32% random coil. TMHMM software was used to predict phosphorylation sites. The results showed that there were three potential serine phosphorylation sites, two threonine phosphorylation sites, and four tyrosine phosphorylation sites.
The deduced aa sequence of the carp TLR5M was aligned with reported sequences using the ClustalW program. A multiple sequence alignment illustrated that the aa sequence of carp TLR5 shared 84.46% identity with C. mrigala (GenBank ID AEQ92867) and 78.74% identity with Ctenopharyngodon idellus (GenBank ID ACH61786). The carp TLR5M aa sequence shared 45.00% identity with other fish TLR5 and 34.23% identity with human TLR5.
Cloning of the carp TLR5M gene
The entire coding region of the TLR5M gene was successfully amplified from genomic DNA using primers targeted to the coding region. Comparisons of the genomic and cDNA sequences revealed that the carp TLR5M gene consisted of a single exon. Figure 2 illustrates a comparison of the genomic structures of TLR5M genes in several species, including carp.
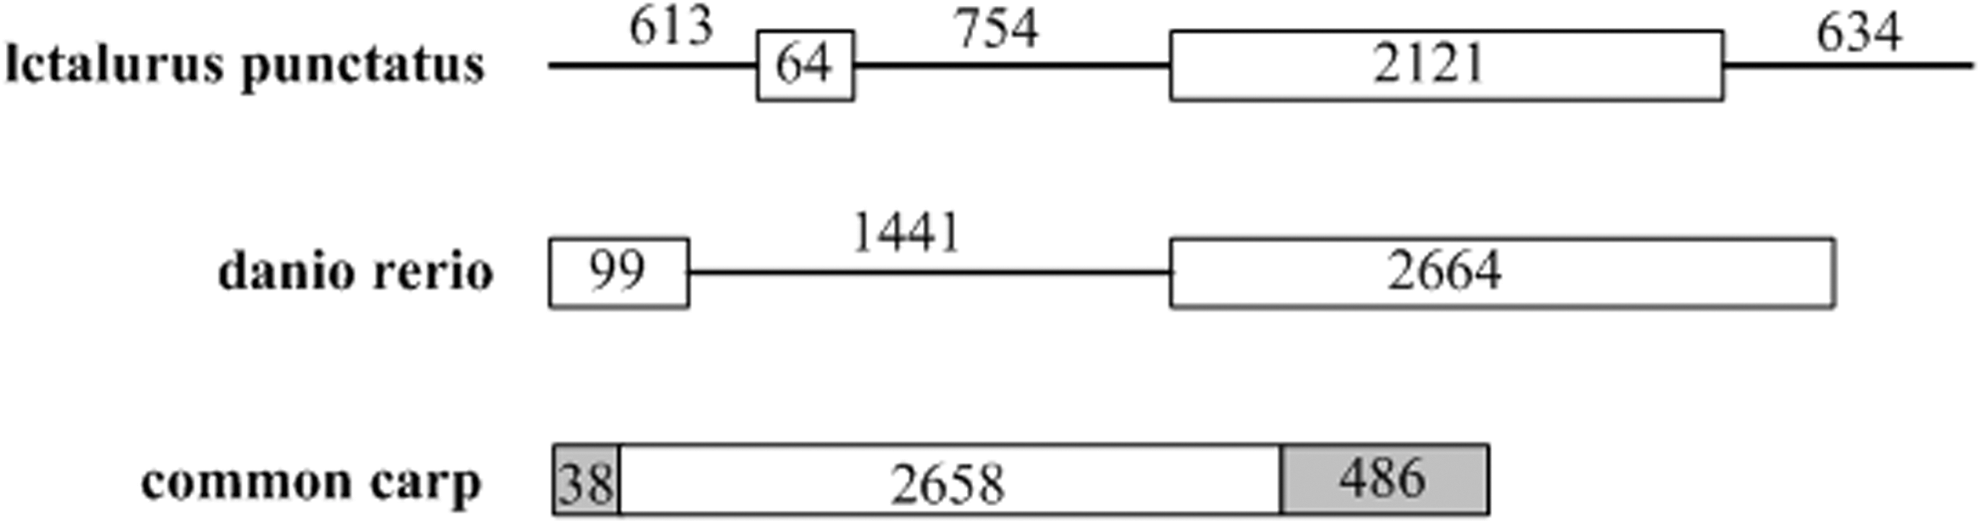
Schematic representation of TLR5 genomic structure. Exons are shown as boxes with sizes (in base pairs) given inside; horizontal lines represent introns with their nucleotide lengths provided above; the untranslated region is indicated with grey boxes.
Phylogenetic analysis
Phylogenetic analyses were performed on the aa sequences of the full TLR5M coding region using MEGA 4.1 software. The resulting phylogenetic tree consisting of 15 protein sequences was composed of two major branches (Fig. 3). The phylogenetic analysis showed that TLR5M clusters together with other fish TLR5 to form a sister group and also clusters together with mammals. The carp and C. mrigala sequences were the most closely related. The observed relationships within this cluster reflect the taxonomic positions of these species.
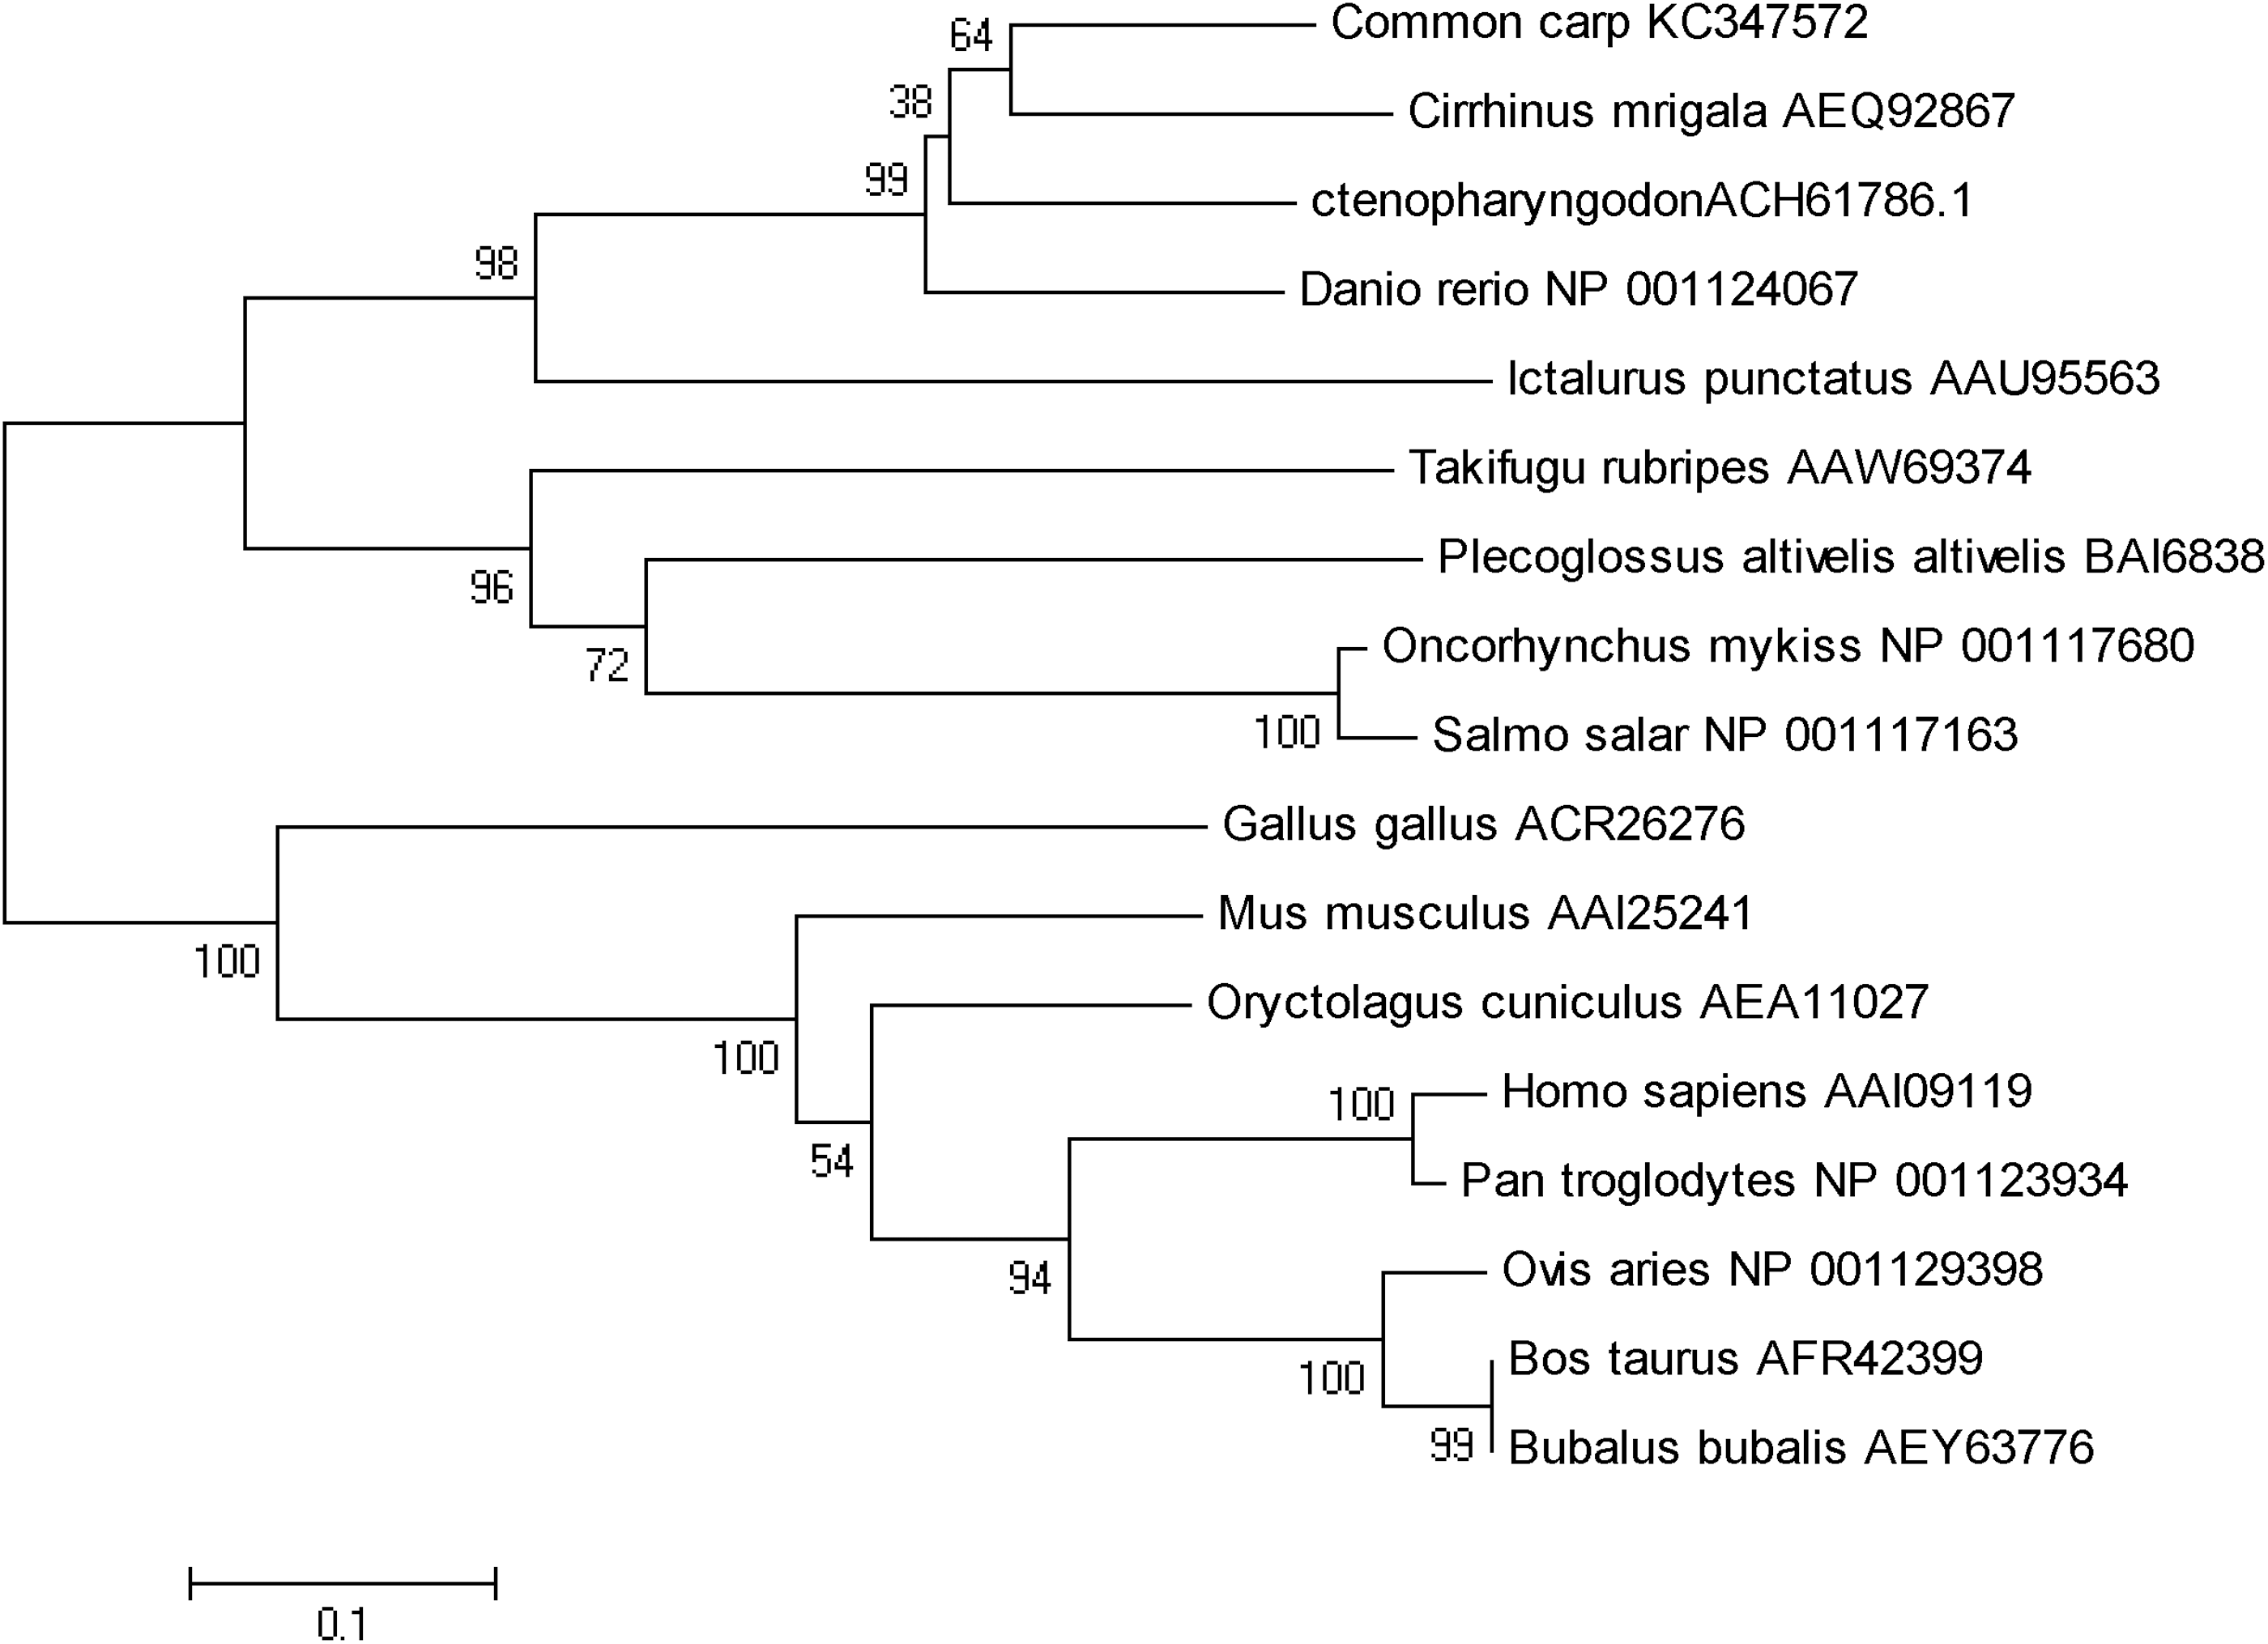
Phylogenetic tree of the TLR5 aa sequences from different species. The trees were constructed by the neighbor-joining method based on the Poisson correction model with 1,000 bootstrap replicates. The numbers at the branches indicate bootstrap values. The bar (0.1) indicates the genetic distance. GenBank accession numbers are shown in the figure.
Tissue distribution of the TLR5M gene
To study the basal expression of the TLR5M gene in various tissues, qRT-PCR analysis was carried out in kidney, muscle, brain, spleen, gill, heart, and liver tissues. As shown in Figure 4, TLR5M was constitutively expressed in all the tissues examined; however, its level of expression varied. Among the tissues examined, the highest level of TLR5M expression was detected in the liver, followed by the spleen, gill, muscle, brain and heart. The lowest expression was observed in the kidney.
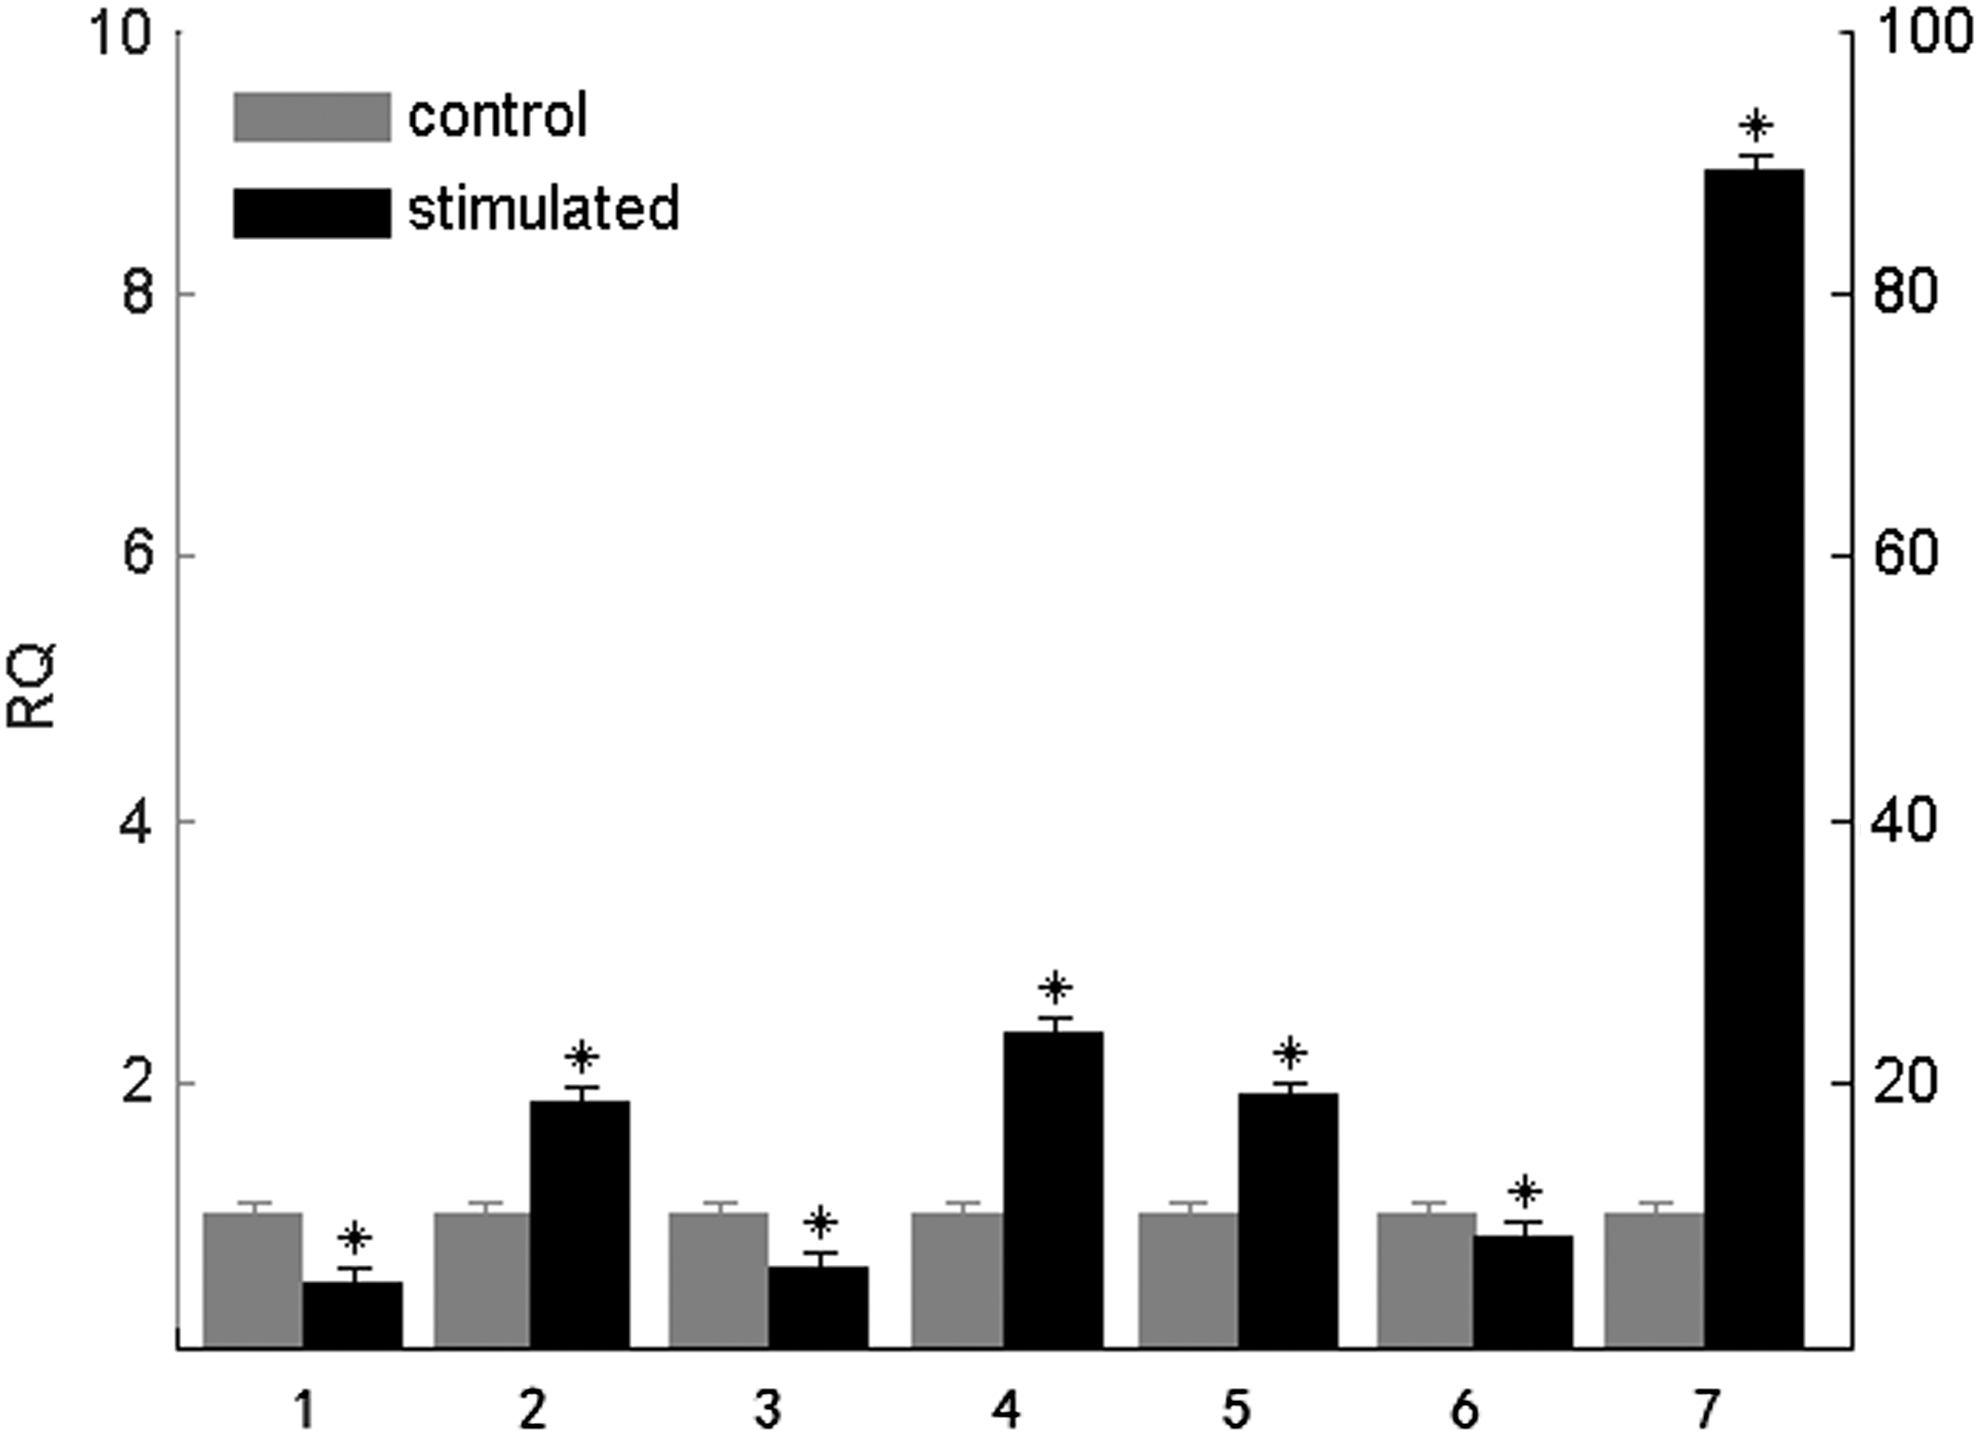
Basal expression of TLR5M gene of carp in various tissues. Total RNA was extracted from the indicated tissues and qRT-PCR was carried out to analyze the expression of TLR5M gene. Expression was represented as a ratio relative to β-actin (internal control) levels in the same samples. The results were expressed as mean±standard error (bars in the graph) from the samples. Highly significant difference (p<0.01) between the control and treated group was indicated with asterisks (*). 1, kidney; 2, muscle; 3, brain; 4, spleen; 5, gill; 6, heart; 7, liver. qRT-PCR, quantitative real-time polymerase chain reaction.
Modulation of TLR5M expression by flagellin
To investigate the in vivo modulation of TLR5M gene expression in response to stimulation with its ligand, flagellin was intravenously injected, and TLR5M expression in various carp tissues was analyzed by qRT-PCR (Fig. 5). In flagellin-treated fish, a highly significant (p<0.01) induction was noticed in the spleen (∼3-fold), heart (∼2.5-fold), liver (∼2-fold) and kidney (∼2-fold). Additionally, a moderate increase in TLR5M expression was observed in the brain (∼1.5-fold) and muscle (∼1.5-fold). However, TLR5M expression in the gill (∼1-fold) was essentially equivalent to that observed before stimulation.

TLR5M expression after ligand stimulation in various tissues. Purified flagellin was injected into carp fingerlings by intravenous route. Total RNA was extracted from indicated tissues at 4 h post injection, and qRT-PCR was conducted to analyze the expression of TLR5M gene expression. The data were normalized with β-actin and were expressed as fold induction relative to control. The results were expressed as mean±standard error (bars) from three fish. Highly significant difference (p<0.01) between the control and treated group was indicated with asterisks (*). 1, kidney; 2, muscle; 3, brain; 4, spleen; 5, gill; 6, heart; 7, liver.
Differential expression of TLR5M during bacterial infection
To characterize the effect of A. hydrophila on the induction of host responses, the mRNA expression levels of carp TLR5M in different tissues were detected by qRT-PCR. As shown in Figure 6, TLR5M gene expression levels in the kidney (∼10-fold) and spleen (∼5-fold) were especially high. The expression levels of TLR5M in the brain (∼2.5-fold), heart (∼4-fold), gill (∼4-fold), and liver (∼2-fold) were higher than those of the control group. However, there was no significant difference in TLR5M expression in the muscle (∼1-fold).

TLR5M expression after Aeromonas hydrophila stimulation in various tissues. A. hydrophila (5×10⁷/mL) was injected into carp fingerlings by i.p. route. After 24 h, total RNA was extracted from indicated tissues and qRT-PCR was conducted to analyze the expression of TLR5M and β-actin expression. The results were expressed as mean±standard error (bars) from three fish. Highly significant difference (p<0.01) between the control and treated group was indicated with asterisks (*). 1, kidney; 2, muscle; 3, brain; 4, spleen; 5, gill; 6, heart; 7, liver.
Differential expression of TLR5M during mitogen stimulation
The results (Fig. 7) showed that TLR5M expression in LPS-stimulated fish was significantly (p<0.01) induced at 4 h (∼6-fold) and 12 h (∼3.5-fold). With ConA stimulation, expression was significantly induced at 4 h (∼3.5-fold). However, after 24 h of stimulation with ConA, TLR5 expression was only slightly upregulated (∼1.5-fold). The mRNA expression levels of IFN-γ, IL-1β, IL-10, and TNF-α4, which were measured at the same time in the treated and control groups, are shown in Figure 8. After LPS or ConA stimulation, the expression of these genes was enhanced compared with that of control fish.
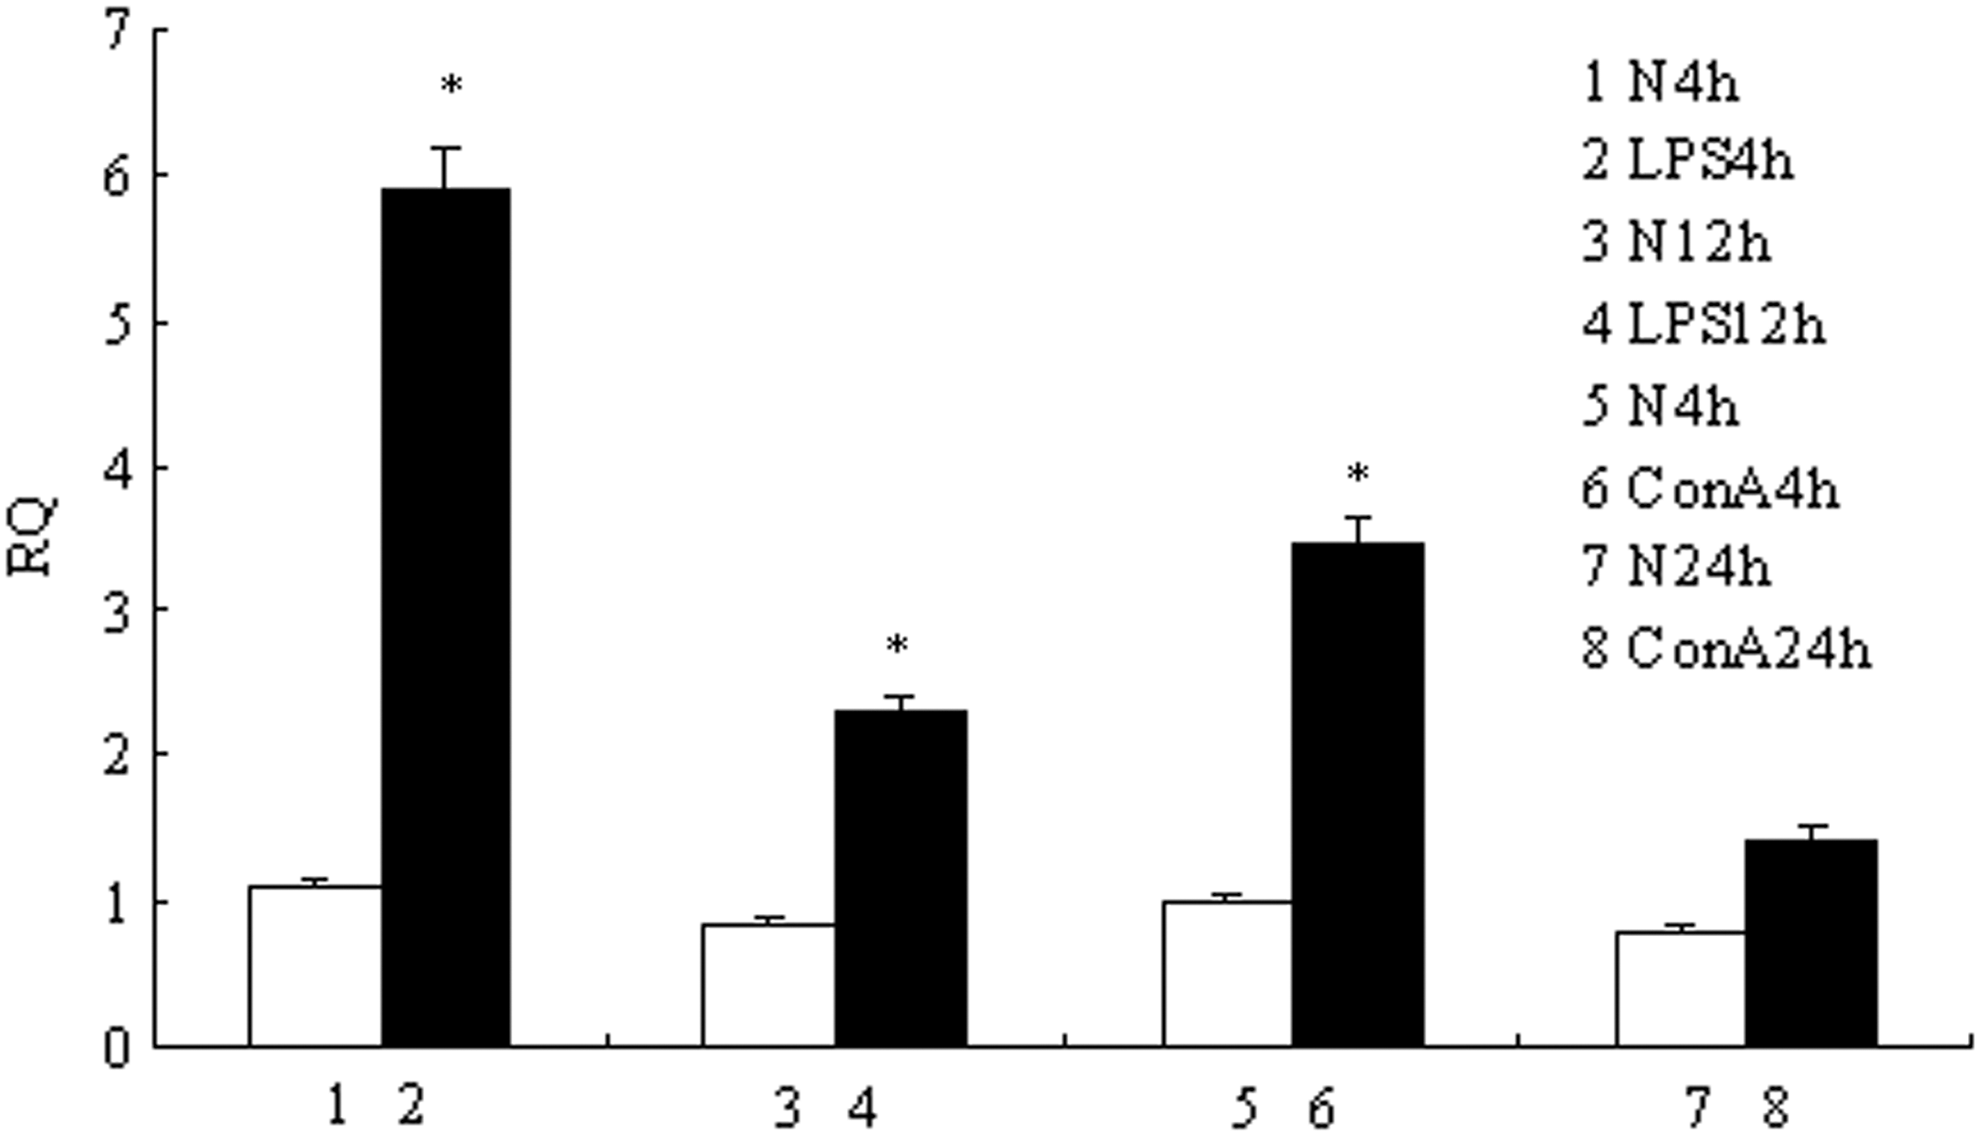
TLR5M expression after mitogen stimulation in peripheral blood leucocytes. The separated carp peripheral blood leucocytes were cultivated in vitro and stimulated with lipopolysaccharide (LPS) for 4 and 24 h and concanavalin A (ConA) for 4 and 12 h. Total RNA was extracted from the peripheral blood leucocytes and qRT-PCR was carried out to analyze the expression of TLR5M gene. The results were expressed as mean±standard error (bars). Highly significant difference (p<0.01) between the control and treated group was indicated with asterisks (*).

Cytokines expression after mitogen stimulation in peripheral blood leucocytes. The separated carp peripheral blood leucocytes were cultivated in vitro and stimulated with LPS for 4 and 24 h and ConA for 4 and 12 h. Total RNA was extracted from the peripheral blood leucocytes and qRT-PCR was carried out to analyze IFN-γ, IL-1β, IL-10, and TNF-α4 expression. The results were expressed as mean±standard error (bars). Highly significant difference (p<0.01) between the control and treated group was indicated with asterisks (*).
Differential expression of TLR5M and inflammatory cytokines during flagellin exposure
Figure 9 showed the mRNA expression levels of TLR5M at different times. The highest level (∼25.0-fold) of TLR5M expression was detected after 4 h stimulation then decreased gradually, ∼10.0-fold at 12 h and ∼5.0-fold at 24 h. As shown in Figure 10, the expression of IFN-γ was higher than that in the control group, whereas the change was not obvious. ∼3.0-fold at 4 h, ∼2.5-fold at 12 h and ∼2.0-fold at 24 h. The expression of IL-1β was downregulated as the time continues, ∼6.0-fold at 4 h, ∼5.0-fold at 12 h and ∼4.0-fold at 24 h. At three time points, IL-10 were ∼1-fold compared with their levels in the unstimulated group. TNF-α4 expression was significantly (p<0.01) induced at 4 h (∼10-fold), 12 h (∼9-fold) and 24 h (∼8-fold).
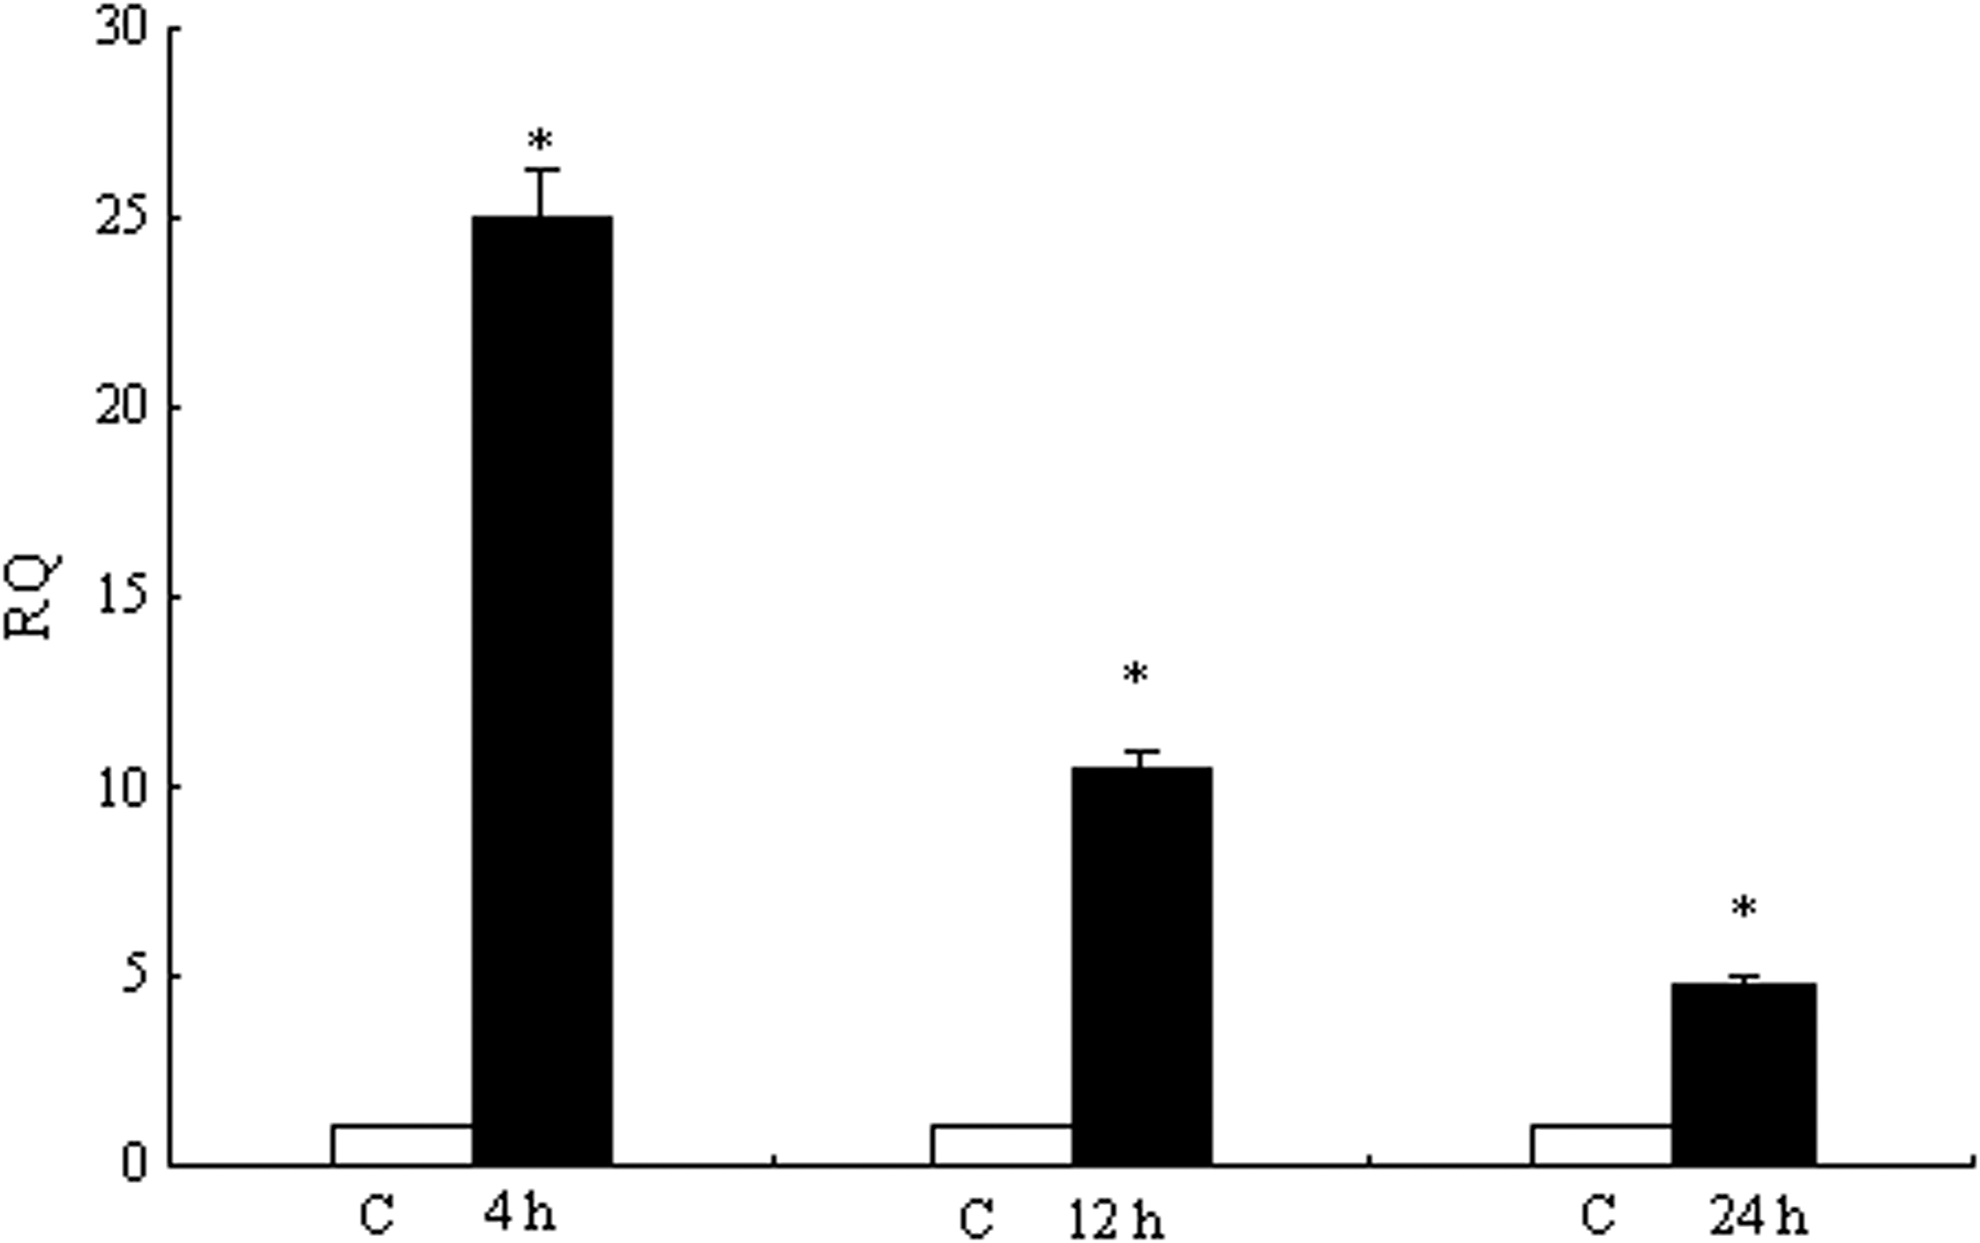
TLR5M expression after ligand stimulation in peripheral blood leucocytes. The separated carp peripheral blood leucocytes were cultivated in vitro and stimulated with flagellin for 4, 12, and 24 h. Total RNA was extracted from the peripheral blood leucocytes and qRT-PCR was carried out to analyze IFN-γ, IL-1β, IL-10, and TNF-α4 expression. The results were expressed as mean±standard error (bars). Highly significant difference (p<0.01) between the control and treated group was indicated with asterisks (*).
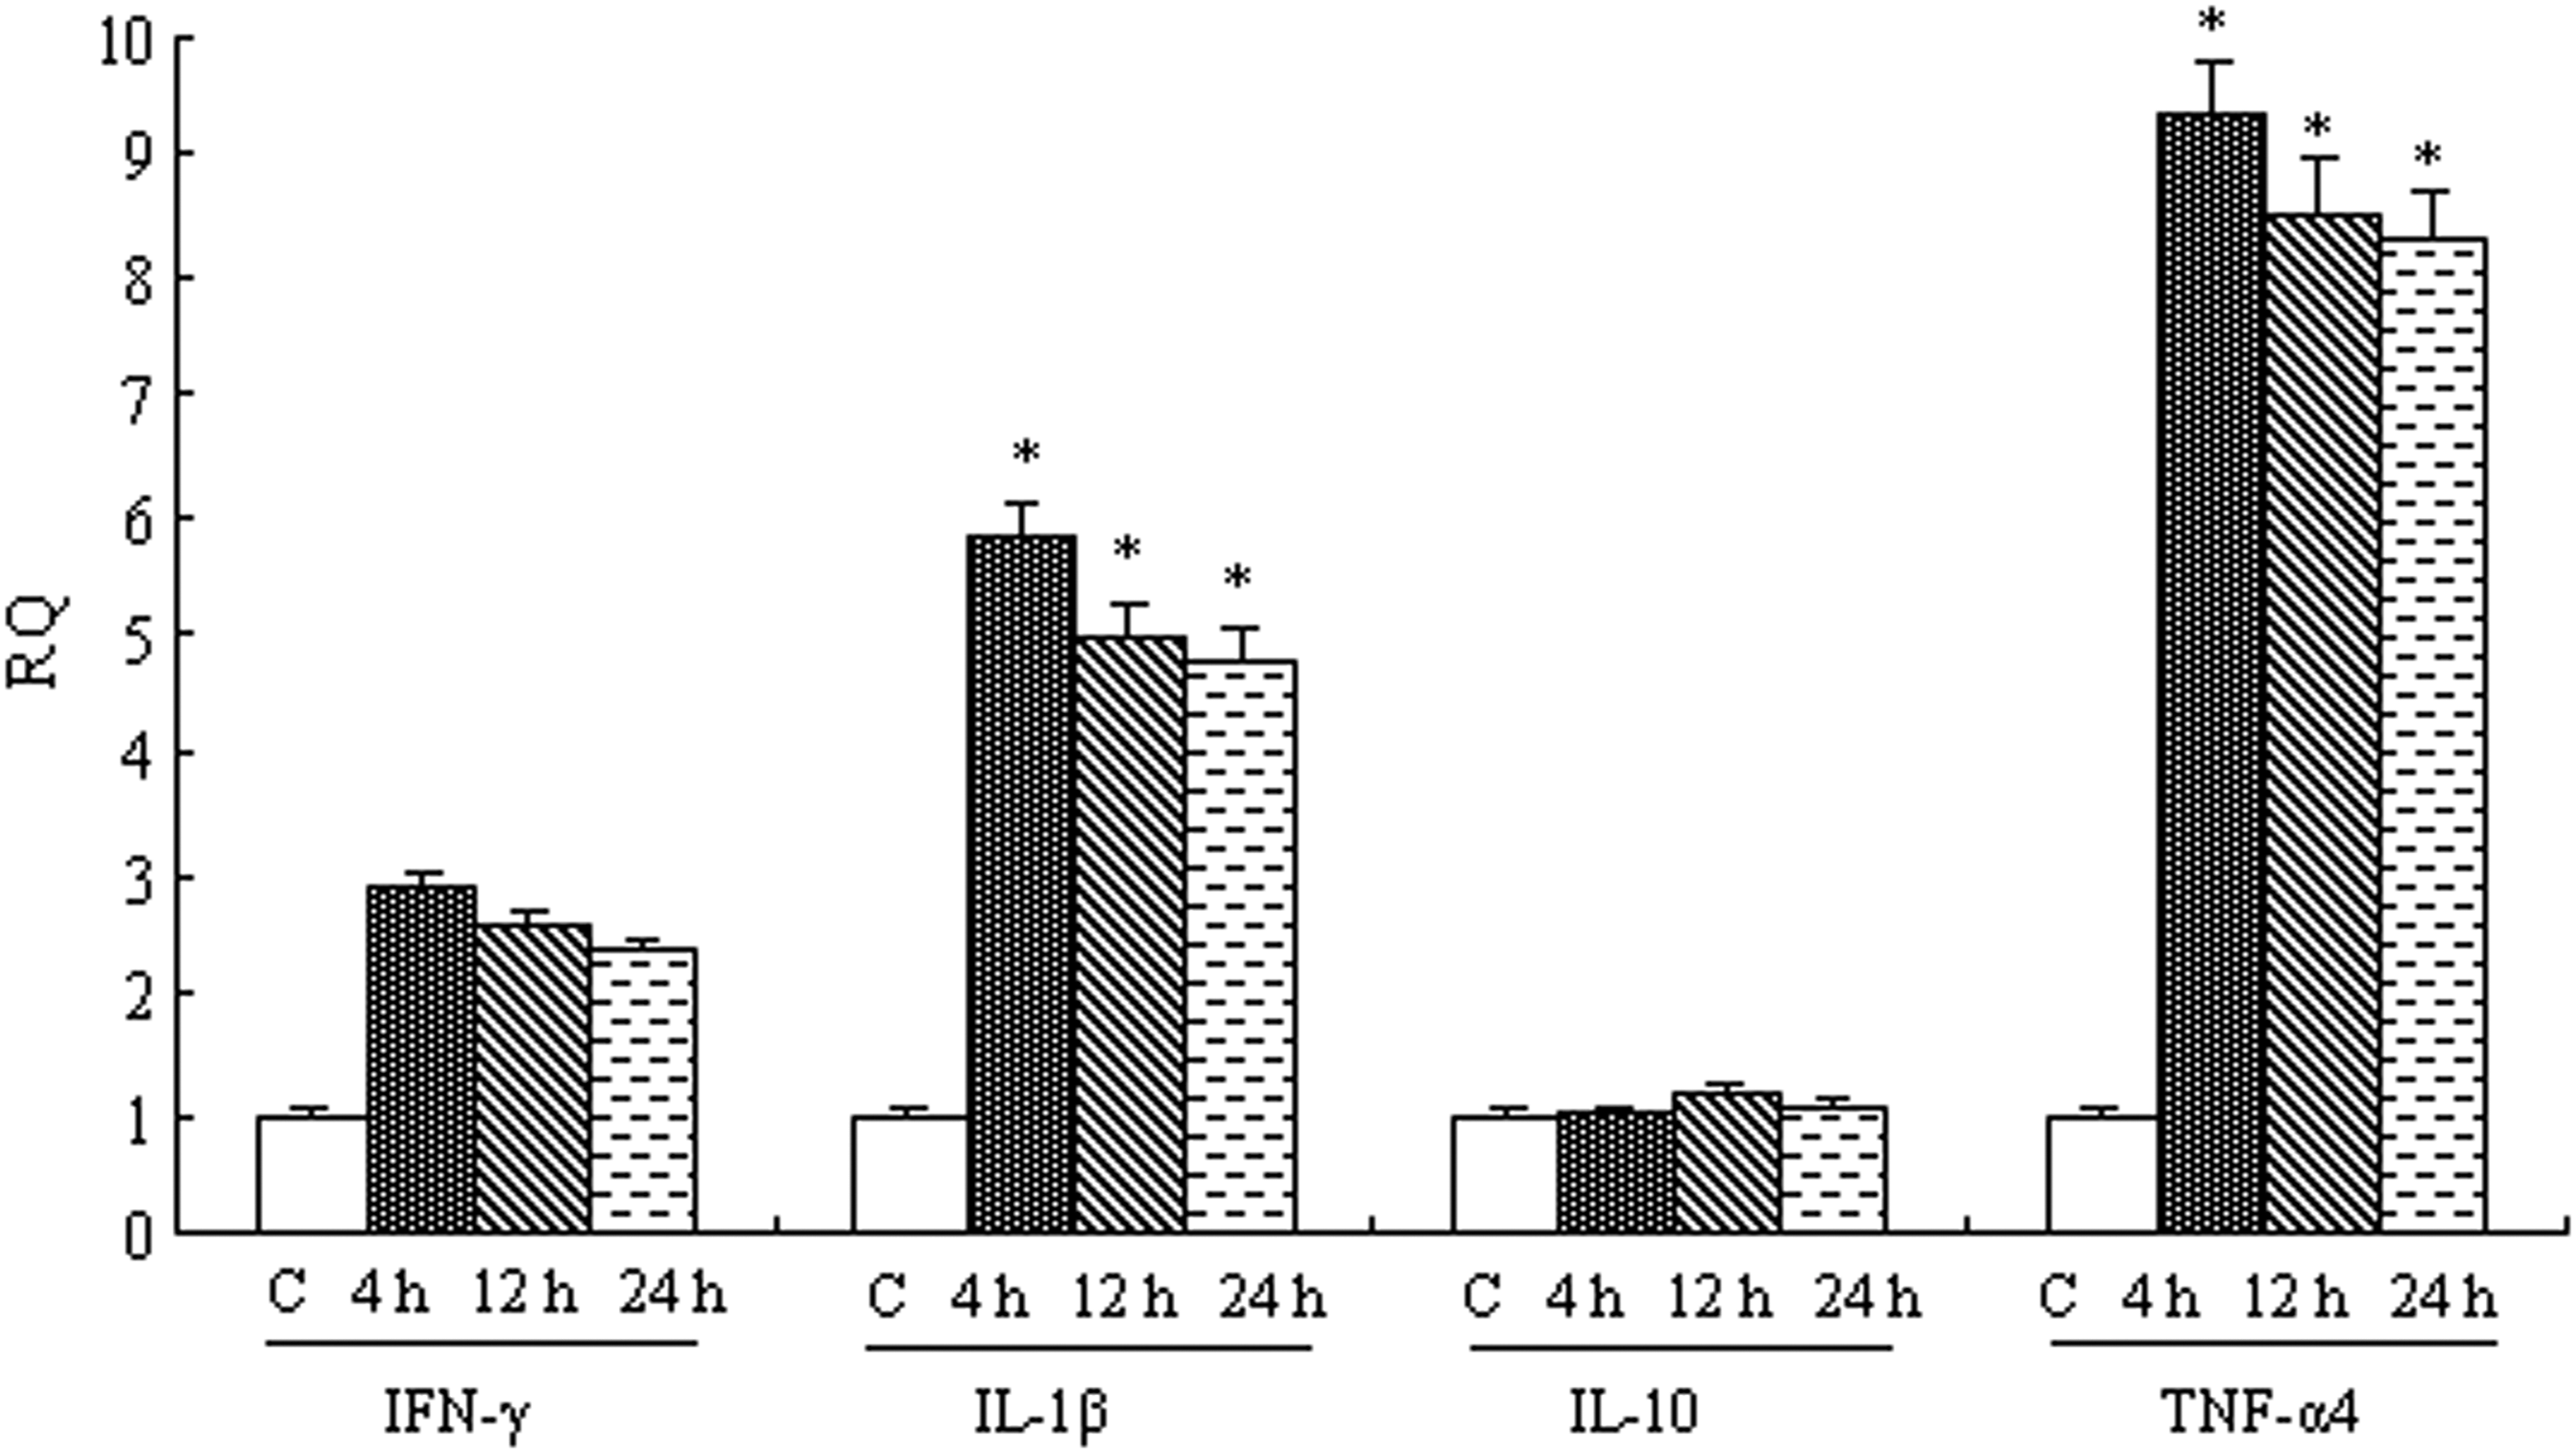
Cytokines expression after ligand stimulation in peripheral blood leucocytes. The separated carp peripheral blood leucocytes were cultivated in vitro and stimulated with flagellin for 4, 12, and 24 h. Total RNA was extracted from the peripheral blood leucocytes and qRT-PCR was carried out to analyze IFN-γ, IL-1β, IL-10, and TNF-α4 expression. The results were expressed as mean±standard error (bars). Highly significant difference (p<0.01) between the control and treated group was indicated with asterisks (*).
Discussion
Fish have a relatively primitive immune system, and studies exploring the molecular mechanisms of their immune system are fewer compared with those exploring mammalian systems. Fish depend primarily on their innate immune responses, which are mostly elicited by various PRRs (Basu et al., 2012). TLR5 is a PRR that is expected to play a significant role in protecting fish against bacterial infection. As one of the most commercially important aquaculture fish species worldwide, there has been no systematic study of the characterization of carp TLR5, such as coding sequence, genomic structure, transcription mode, and expression analysis under different immune challenge is also limited.
There are two TLR5 variants in fish: TLR5M and TLR5S. A distinguishing feature between these variants is the transmembrane domain, which is not present in TLR5S. In our study, analysis of the predicted aa sequence and structure within the putative ORF revealed a predicted transmembrane domain at aa positions 654–676; thus, the cDNA sequences obtained were TLR5M. Previously, both types ofTLR5 (TLR5M and TLR5S) were found in rainbow trout (Tsujita et al., 2004) and Japanese flounder (Hwang et al., 2010). However, in zebrafish, only the membrane form of TLR5 (TLR5M), with two paralogous sequences (TLR5a and TLR5b), was reported (Hwang et al., 2010).
In this study, we reported the cloning of the full length TLR5M cDNA from carp. Comparisons of the genomic and cDNA sequences revealed that the carp TLR5M gene consists of a single exon. This indicated that the TLR5M gene is expressed continuously without the participation of introns. Furthermore, using maximum-parsimony, neighbor-joining or minimum-evolution methods, phylogenetic analyses demonstrated that carp TLR5M clusters with other fish TLR5 proteins. The aa sequence encoding the carp TLR5M has a close relationship with TLR5 from C. mrigala and C. idellus. This clustering was supported by high bootstrap values.
Based on our findings, the carp TLR5 3′-UTR is relatively long, consisting of 486 bp. Processing of the 3′ end involves endonucleolytic cleavage of the primary transcript, followed by polyadenylation of the upstream RNA fragment. The cleavage event is directed by two sequence elements in the RNA: one upstream and one downstream of the cleavage site. The upstream element is AATAAA. Numerous mutagenesis experiments and the analysis of naturally occurring mutations have confirmed that this sequence, which is typically located 10–35 nucleotides upstream of the poly(A) site, is essential for 3′-end formation of polyadenylated RNA (Wahle and Keller, 1992). The presence of this sequence can affect poly(A) tail formation and adjust the length and/or stability of the transcripts. The stearoyl-coenzyme A desaturase gene was previously shown to selectively apply two polyadenylation signals, generating 319 and 512kb transcripts (Zhang et al., 1999). There are three typical polyadenylation signals (AATAAA) in the 3′-UTR of carp TLR5M. However, it is not yet clear which of these is more important for transcription and expression of the TLR5M gene.
The tissue distribution of TLR5M in carp revealed its broad expression pattern among all tested organs, although its relative expression varied. Its expression was highest in the liver, followed by the spleen, gill, and muscle (Fig. 4). The broad range of TLR5 (TLR5M) expression in almost all tissues has previously been reported in puffer fish (Oshiumi et al., 2003), rainbow trout (Tsujita et al., 2004) and Japanese flounder (Hwang et al., 2010). This broad range of expression may suggest that TLR5 has crucial roles in the immune surveillance systems of various organs in the host.
A. hydrophila is a zoonotic pathogen that is widespread throughout the aquatic environment. This gram-negative bacterium is usually considered a secondary pathogen in disease outbreaks in cultured fish species (Janda and Abbott, 1998). In response to A. hydrophila infections, our results showed that TLR5M gene expression was highly induced in all tested tissues, although the pattern of its expression varied between the tissues. Highly significant (p<0.01) induction was observed in the spleen, heart, liver and kidney. This is in agreement with previous observations of TLR5 induction in C. mrigala in the presence of A. hydrophila (Basu et al., 2012).
Several lines of evidence suggest that various TLR signaling pathways in teleosts and mammals are MyD88-dependent and evolutionarily conserved (van Aubel et al., 2007; Rebl et al., 2009). TLR5 is a member of the MyD88-dependent TLR signaling receptors. After TLR5 combines with flagellin, its intracellular region causes a rapid increase in MyD88, which then activates the nuclear transcription factor NF-κB via a serine/threonine kinase to stimulate the production of proinflammatory cytokines, such as TNF-α, IL-1β, IFN-γ, and others (Trinchieri and Sher, 2007). Among these cytokines, TNF-α is the earliest to be released. Functionally, TNF-α and IL-1β are closely related and act synergistically to induce the expression of chemokines and upregulate cell adhesion molecules; thus, triggering leukocyte emigration to the inflammatory site (Dinarello, 1997). In our experiments, we analyzed the expression of TLR5M and IFN-γ, IL-1β, IL-10, TNF-α4 after flagellin stimulation. The results showed that flagellin can stimulate the expression of carp TLR5M and induce the production of inflammatory cytokines; imply that carp has the same conservative TLR5M signal transduction pathway with other teleosts. However, our study indicated the possibility of lack TLR5S in carp, further research is needed to verify the existence of carp TLR5S and explore the role of TLR5M signal transduction pathway in response to flagellin, which will benefit the better understanding of molecular mechanism of common carp innate immune.
Footnotes
Acknowledgments
This work was supported by the Key Laboratory for Zoonosis, Ministry of Education, Institute of Zoonosis, Jilin University, and grants from the National Natural Science Foundation of China (No. 30972277).
Disclosure Statement
No competing financial interests exist.