
Abstract
Compare the microRNA (miRNA) trancriptomes of goat and sheep skin using Solexa sequencing to understand the development of skin and hair follicles (HFs). miRNA expression patterns vary in the two small RNA libraries from goat (G library) and sheep (S library) telogen skin samples. Analysis of the size distribution of 25.32 million clean reads revealed that most are 21–23 nucleotides. A total of 1910 known miRNAs and 2261 novel mature miRNAs were identified in this study. Among them, 107 novel miRNAs and 1246 known miRNAs were differentially expressed in the two libraries; 10 of the known miRNAs were identified using stem-loop quantitative real-time PCR. Furthermore, GO and KEGG pathway analysis of predicted miRNA targets illustrated the roles of these differentially expressed miRNAs in telogen HF development and growth. This study provides important information about the role of miRNAs in the regulation of HF development and their function in the telogen phase. This observation may help future investigations of the regulation of miRNAs during wool quality improvement.
Introduction
M
HF development result from extensive epithelial–mesenchymal interactions (Schmidt-Ullrich and Paus, 2005; Mikkola and Millar, 2006; Ohyama et al., 2010). Morphologically, the process can be divided into three distinct stages (induction, organogenesis, and cytodifferentiation) (Schmidt-Ullrich and Paus, 2005). The histological structures of mature HF consist of the hair bulb (Hardy, 1992), inner root sheath (IRS), hair shaft (Sperling, 1991), outer root sheath, and connective tissue sheath (Stenn and Paus, 2001). Thickening and elongation of epidermal keratinocytes (hair placodes) are known to be the HFs (Paus et al., 1999). The fine adjustment of the process relies on a series of signal factors and receptors. Emerging evidences indicates that proper small RNA processing is essential for normal HF development (Andl et al., 2006; Yi et al., 2008; Yi and Fuchs, 2010). For example, the expression of miR-31 markedly increases during anagen, whereas it decreases during catagen and telogen. Additionally, it can negatively regulate the expression of Fgf10 and Dlx3 transcription factors (Mardaryev et al., 2010). Bone morphogenetic proteins (BMPs) play essential roles in the control of skin development, postnatal tissue remodeling, and tumorigenesis. Recently, research has demonstrated that miR-21 prevents the inhibitory effects of BMP4 on cell proliferation and migration (Ahmed et al., 2011). In addition, miR-7-5p inhibits melanoma cell migration and invasion by inhibiting IRS-2 (a target of miR-7-5p) expression and oncogenic Akt signaling (Giles et al., 2013). Furthermore, the self-renewal property of the growth cycle of HFs, including anagen, telogen, and catagen, is known. Although the relationship between anagen HFs and small RNA (sRNA) has been reported widely (Liu et al., 2012), few studies have investigated telogen and catagen HFs. Therefore, in this study, areas of skin where the fur grows in telogen were sampled.
Cashmere goats and fine-wool sheep provide high quality wool, primary source of materials in the animal fiber industry (Wenguang et al., 2007). The hairy coat of Liaoning Cashmere goats is primarily composed of a double coat structure while fine-wool sheep has a single coat structure. Due to differences in physical properties of their hair, the market prices between them differ significantly. Along with the discovery of sRNAs, increasing attention has been paid to the regulatory roles of miRNAs in HF development. Therefore, Cashmere goats and fine-wool sheep were chosen as appropriate animal models for our research. To further clarify the function of miRNAs in skin telogen follicles, we identified and comparatively analyzed the miRNA profiles in Cashmere goat and fine-wool sheep using Solexa deep sequencing. Our findings provide a solid basis for improving the quality of wool and increasing the economic value, possibly even optimizing breeding.
Materials and Methods
Ethics statement
Liaoning cashmere goats (Capra hircus) and fine-wool sheep (Ovis aries) were obtained from a livestock farm located in the College of Animal Science and Technology, JiLin University, Changchun, China. Experiments were performed according to the Regulations for the Administration of Affairs Concerning Experimental Animals (Ministry of Science and Technology, China; revised in June 2004) and approved by the Ethics Committee of Jilin University in accordance with the guidelines on animal care and use.
Skin collection and total RNA isolation
Three cashmere goats (one female and two male) and three fine-wool sheep (one female and two male) aged 1.5 years were used in this study. All the animals were fed under the same conditions and were sacrificed humanely to minimize suffering. All samples collection protocols were performed in accordance with the guide for the Care and Use of Laboratory Animals published by the U.S. National Institutes of Health. A skin sample was obtained from the scapular region of each animal in June 2011 during the telogen phase of HF growth and immediately stored in liquid nitrogen.
Total RNA was extracted using TRIzol reagent (TransGen Biotech) according to the manufacturer's protocol. Equal volumes of total RNA (2.5 μg from each skin sample) were detected by agarose (1%) gel-electrophoresis, and only two bands were clearly visible. Then, RNA concentration, purity and integrity were measured using the Agilent Technologies 2100 Bioanalyzer (RNA Nano Chip, Agilent). The ratios of OD260/OD280 were both above 1.8. We pooled the six samples into two groups (goat group and sheep group) with the same concentration and stored these at −80°C until further analysis.
Small RNA library construction and high-throughput sequencing
Equal quantities of total RNA isolated from the skin of three cashmere goats (hereafter referred to as the goat library or marked G) and three fine-wool sheep (hereafter referred to as the sheep library or marked S) were pooled, respectively, and prepared according to the Solexa EAS Small RNA Sample Prep Protocol. Solexa deep sequencing (Illumina Genome Analyzer) was performed at the Beijing Genomics Institute (BGI). Approximately, 10 μg of total RNA representing each sample set was provided.
In short, solexa sequencing was performed as follows: small RNA fragments (14–30 bases) of the total RNA pool were selected and enriched by 15% polyacrylamide/urea gel-electrophoresis and then ligated with proprietary adaptors to the 5′-monophosphate and 3′-hydroxyl termini of the RNA with T4 RNA ligase (Ambion). The 5′ ligation products (40–60 bases in length) were enriched and purified by 15% TBE-Urea gel and RNA fragments with adaptors at both ends (70–90 bases in length) were also enriched and purified by 10% TBE-Urea gel. The purified adaptor-ligated samples were then used as templates for cDNA synthesis. cDNA was amplified with 15 cycles using Illumina's small RNA primer sets. The purified cDNA was quantified on an Agilent Technologies 2100 Bioanalyzer, and sequencing libraries were constructed on the Illumina/Solexa sequencing platform with SBS-sequencing by synthesis method (Malone et al., 2012), which can decrease the loss of nucleotides caused by the secondary structure.
Analysis of sequencing data
Basic analysis
Raw sequence reads from HiSeq sequencing were first subjected to data cleaning according to the BGI small RNA reads pipeline as previously reported (Wei et al., 2009). This process includes removing the adaptor reads, several types of contaminants and all low-quality reads. The remaining clean reads in 18-30nt were obtained, and the unique sequences with their associated read counts were mapped onto the genome assembly using the SOAP program. The subsequent processes, including evaluation of sequencing quality and calculating length distribution of clean reads, were then performed. So far, the basic analysis process had been finished.
Advanced analysis
Standard bioinformatics analysis annotated the clean reads into different categories including miRNA, siRNA, piRNA, rRNA, tRNA, snRNA, snoRNA, repeat associate sRNA, exon, or intron RNA, by comparison with the known classes in small RNA databases (e.g., Rfam [ftp.sanger.ac.uk/pub/databases/Rfam], NCBI GenBank database) and by using software (e.g., Tag2repeat and Overlap developed by BGI). To avoid repeat annotations, we traversed these unique sequences in order (rRNAetc [in which GenBank>Rfam] >known miRNAs> repeat-associated small RNAs>exon>intron). To identify known miRNAs, unique sequences were aligned with all of animal precursor/mature miRNAs sequences from miRBase 18.0 (
For those clean tags that were not annotated to any category, the novel miRNAs and their potential to form characteristic hairpin structures were predicted using MIREAP (
Furthermore, miRNA analysis was performed using the MIREAP software for target gene prediction and DAVID 6.7 tool (
miRNA validation through stem-loop quantitative real-time PCR
To verify the accuracy of the result for solexa sequencing, we randomly chose ten differential expressions of known miRNAs for stem-loop RT-qPCR as described previously (Kramer, 2011). According to these mature miRNA sequences in miRBase18.0, we designed the specific primers of the reverse transcription and quantitative PCR (showed in Supplementary Table S1). Primers were synthesized by SBS Biotechnology Co. The process of stem-loop RT-qPCR was described as follows: First, equal amounts of total RNA, 2 μg from each sample, were reverse-transcribed to cDNA using the EasyScript First-Strand cDNA Synthesis SuperMix Kit for RT-PCR (TransGen Biotech Co). The mixtures were incubated at 42°C for 30 min and 85°C for 5 min. Then, for detection and quantification, the MyiQ Real-time PCR detection system (Bio-Rad) and TransStart Top Green qPCR SuperMix (TransGen Biotech Co) were used. Each reaction (25 μL reaction mixtures) contained primers (1 μL), cDNA (1 μL), and the supplied enzyme mixture (12.5 μL). Next, 0.5 μL of the DNA double-strand-specific SYBR Green I dye was added for the detection of qPCR products. The PCR was performed using the following conditions: The mixtures were incubated at 95°C for 10 min, followed by 40 cycles of 95°C for 15 s and 60°C for 30 s in a 96-well optical plate. All samples were assayed in triplicate. The PCR products were verified by melting curve analysis and agarose gel electrophoresis. U6 snRNA was used as a reference gene for normalization. The difference in co-efficiencies was less than 0.1, indicating similar amplification efficiencies for all of the cDNA. The data were analyzed using the ΔΔCt method (Livak and Schmittgen, 2001), and the fold change in miRNAs expression were expressed as 2−ΔΔCt.
Results
Overview of two libraries' small RNA composition
A total of 12,317,481 raw reads from three Cashmere goat skins (G) and 16,592,081 raw reads from three fine-wool sheep skins (S) were obtained by Solexa deep sequencing. All sequencing data in each small RNA library were classified in Table 1. The clean reads without adaptor, contaminants, and low-quality reads were accounting for 11,827,856 in G and 13,488,550 in S (with length 18-30nt). And 539,776 unique sequences were obtained in G and 1,214,068 unique sequences in S. Furthermore, the number of unique reads in the sheep library were over 2.2-fold (1214068/539776) higher than that in the goat library, while the average value of each unique read, representing the counts of clean total reads in the goat library, is much lower than that in the sheep library (11.11%-G/21.91%-S).
Number of reads less than 18nt. Generally, small RNA tags are between 18-30nt long. So too short tags should be removed from data for further analysis.
Number of reads with no insertion.
rRNA.etc represents the total reads of four noncoding RNAs (rRNA, tRNA, snRNA, scRNA, snoRNA, and srpRNA).
Unannotated small RNAs represent the remaining small RNAs that failed to be mapped to any of them (rRNA.etc, known skin miRNAs and repeat-associated small RNAs).
miRNA, microRNA.
To further identify the disparity of library compositions, we compared the total reads and unique reads of two libraries. We found the common reads of two libraries occupied the most of total reads (82.31%) and the S library accounted for the major of unique reads (67.93%) (Supplementary Fig. S2). We next mapped these clean reads onto the genome assembly by the soap program (Li et al., 2008) to further acknowledge the possible mechanisms underlying the diversity of the small RNA. The 129,582 (G) and 706,786 (S) unique reads represented the total reads (Table 1). The total reads mapping to parts of the genome account for more than 60% of clean reads in two libraries. Analysis of the unique reads showed that the unique read content of the G library (24.01%) was lower than that of the S library (58.22%). In G library, the number of isoRNA species is more than that in S library, whereas the number of sRNA species is lower than that in S library. In addition, the recent distribution of sRNAs in sheep chromosomes, which includes 26 pairs of autosomes and the X chromosome, were displayed in the sheep genome database (Supplementary Fig. S3). By contrast, in the number of miRNA on each chromosome, the G library was more uneven than that of the S library. Furthermore, chromosomes 1, 15, 2, 3, and 5 had the extrude distribution state.
The small RNA length distribution and abundance were different between the two libraries (Fig. 1). In S library, the majority of the clean reads (60.55%) were 21–23 nucleotides long, whereas the G sRNAs was characterized by a bimodal distribution, including a weak peak at 19–21 nucleotides and a strong peak at 21–23 nucleotides.
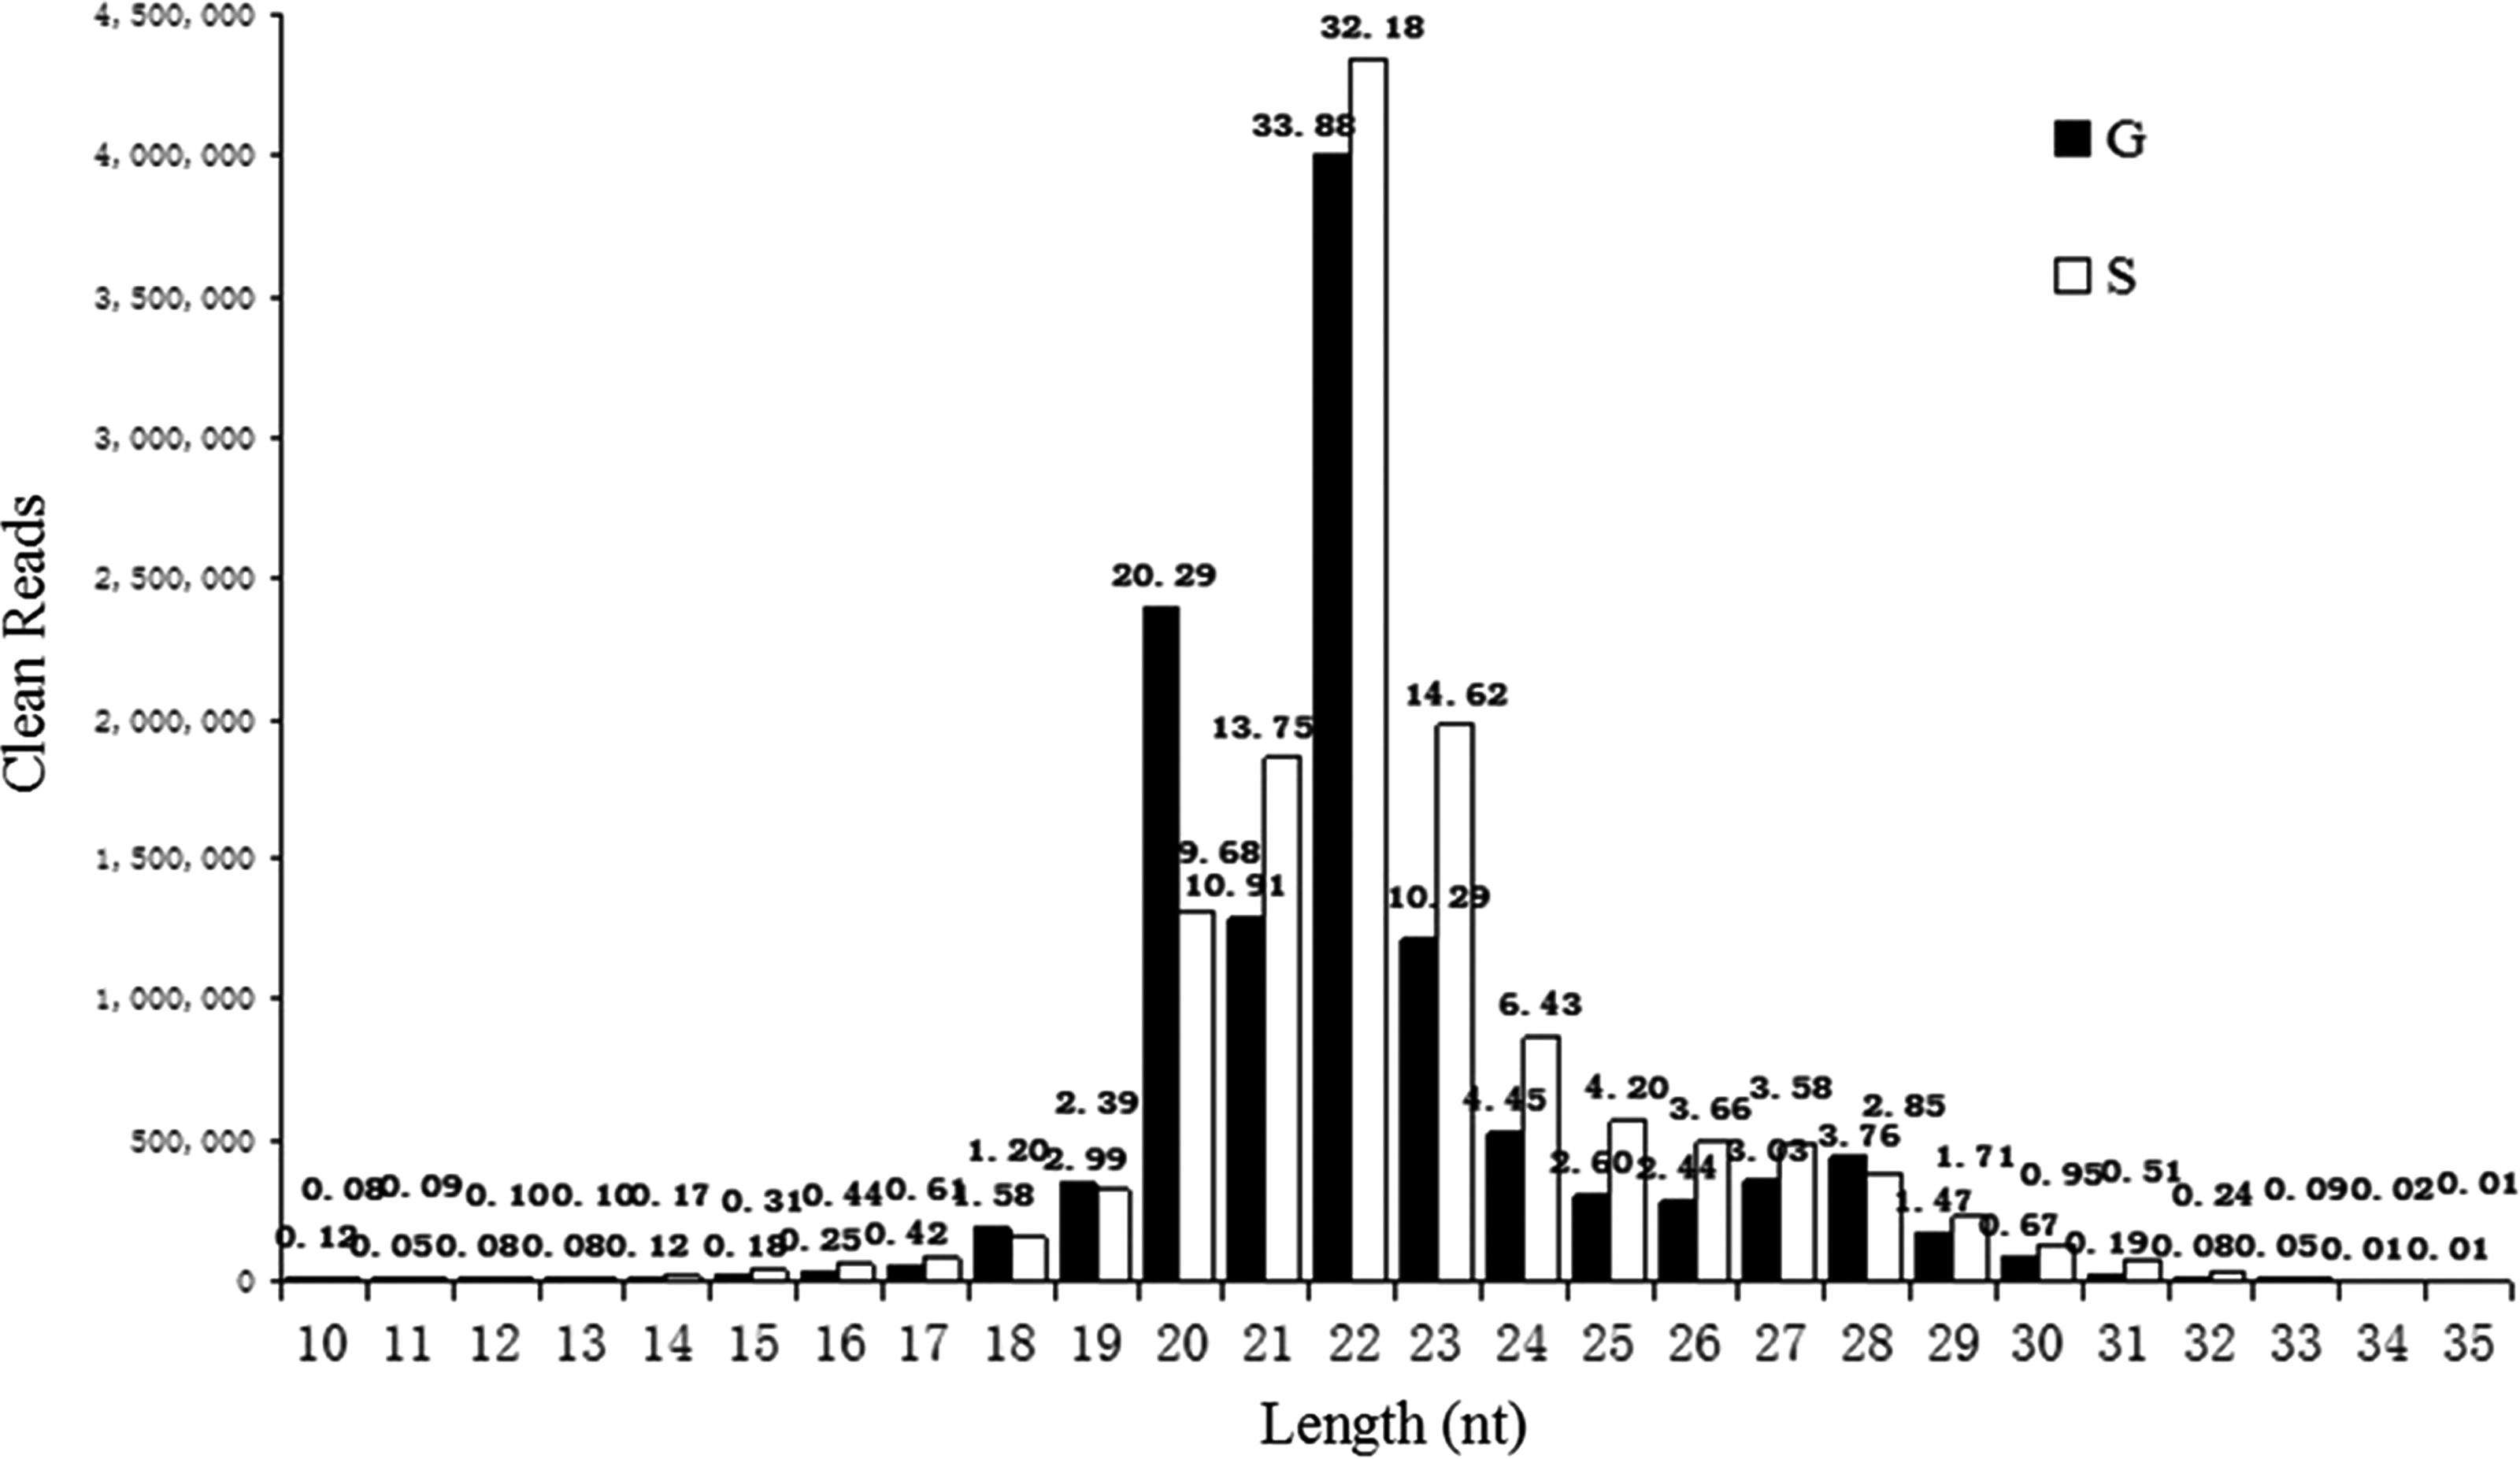
The length and count distribution of sRNAs in two libraries.
Homology analysis
Because there are no goat miRNAs available in the miRBase 18.0 database, we analyzed the distribution of these known miRNAs in 85 species including Caenorhabditis elegans, Drosophila, and others. Then, we filtered 278 miRNA families that were commonly expressed in two libraries. After collating these data, we found over 100 miRNA families that were mapped to each of nine species, including cattle, horses, and pigs, which are close homology with goats and sheep (Supplementary Table S2). In addition, we compared 278 miRNA families to the known Ovis aries miRBase, and we found that 21 matched. To explore the conservation of these 21 miRNA families in other species, we further compared them to the nine species mentioned above (Supplementary Table S2). These results revealed that 7 miRNA families were conserved in all these species and among them, including miR-127, -136, -154, -299, -368, undef, and miR-368. Among them, the undef miRNAs referred the paired miRNAs, which were located on a different chromosome and miR-368 family was newly discovered.
Because of the highest homology between cattle and goats or sheep, we mapped the 21 miRNAs to Bos taurus genome and found that 19 families were divided into two clusters, except for the miR-368 family, which was not expressed in cattle (Fig. 2).
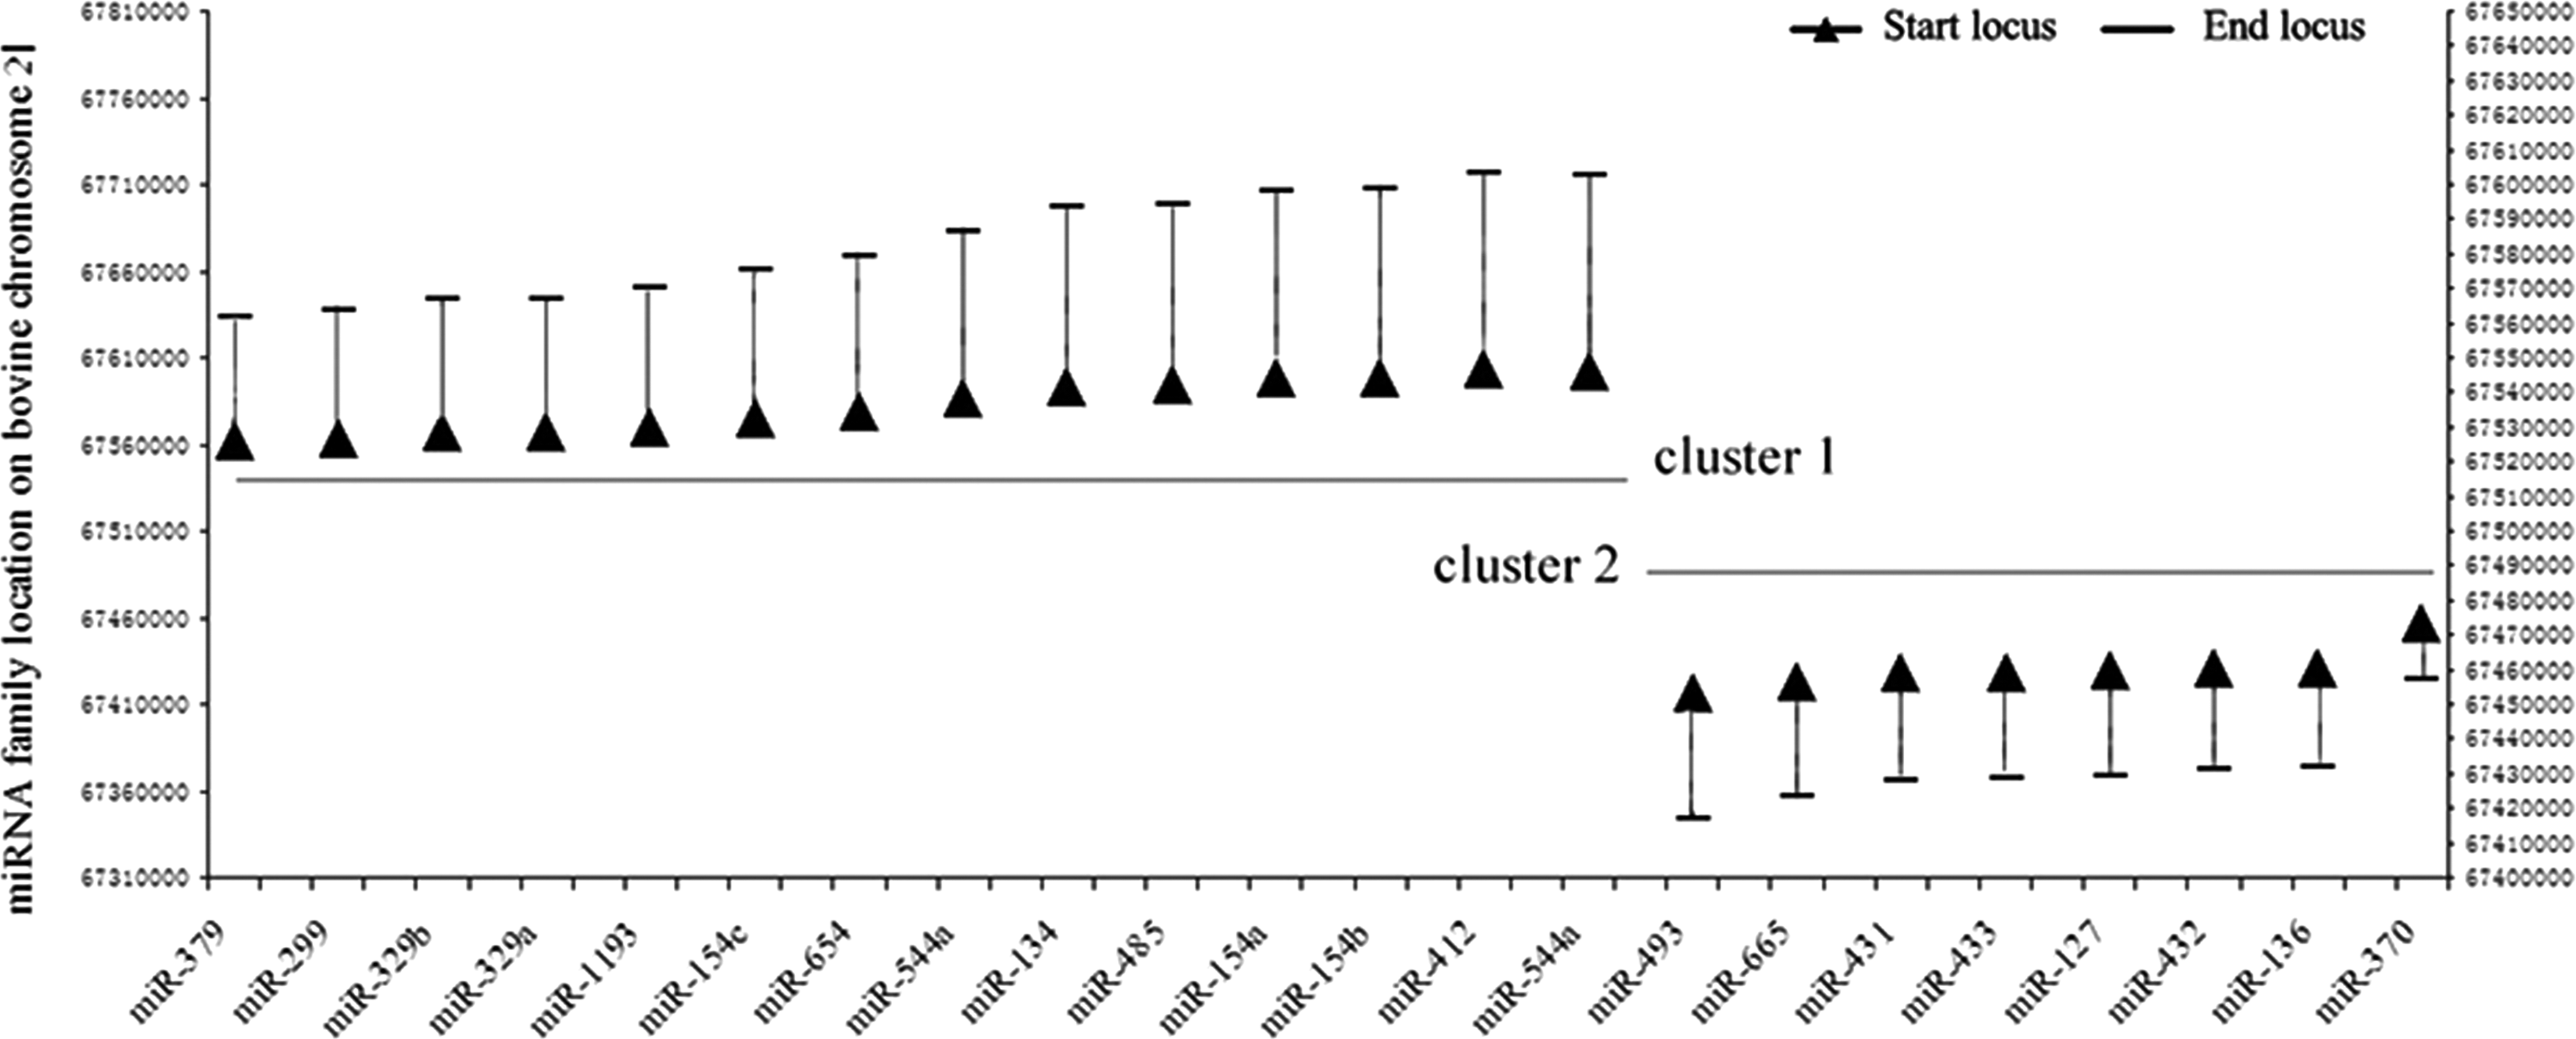
Twenty-one miRNA families cluster on the chr21 of bovine.
Known miRNAs and miRNA*s
A total of 1238 known mammalian miRNAs in G library and 1574 miRNAs in S library were identified according to the miRBase 18.0 (
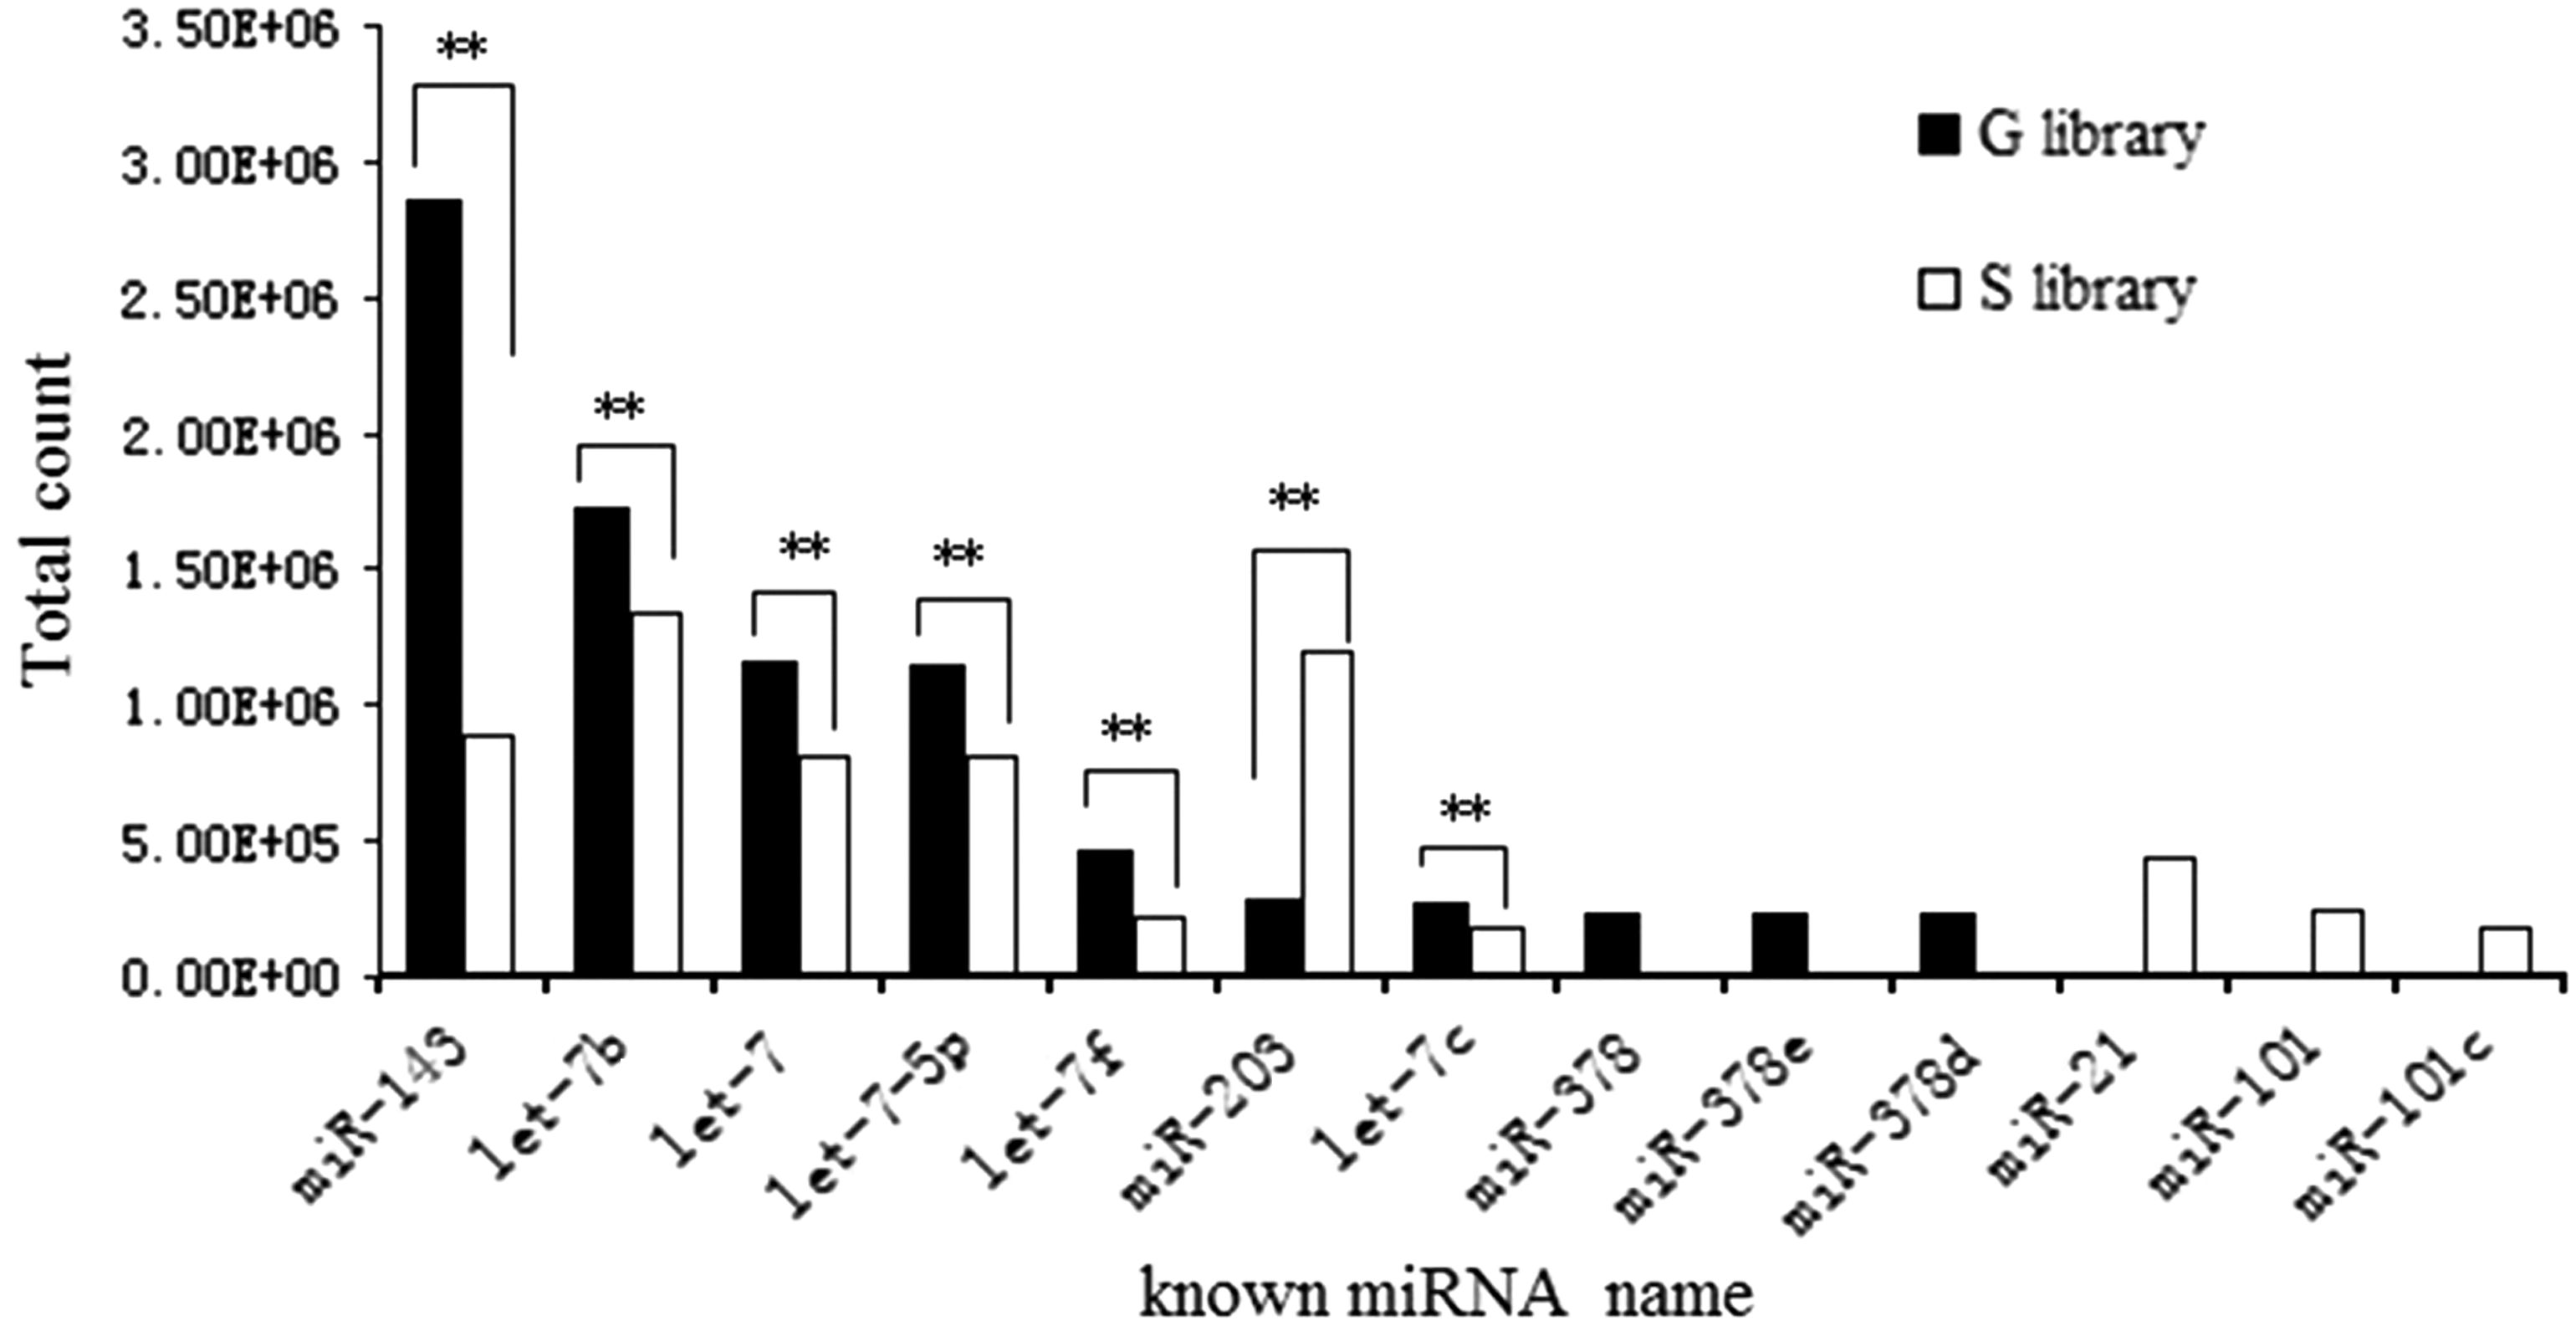
The expressed pattern of 10 highest abundance known miRNAs from each library. ** means a statistically significant difference (**P < 0.01). miRNA, microRNA.
Small RNA classification and annotation
Excluding the known small RNAs, the remaining clean reads were further classified as mappable sequences (Material and Methods section). The number and proportions of each small RNA type in the two libraries were different (Table 2). The results showed that 75.8% of total reads in G library and 67.66% in S library were matched with protein-coding RNA; however, the percentage of unique reads was lower (18.48% in G and 13.79% in S). By contrast, a lower percentage of total reads (12.77% in G and 16.07% in S) mapped to nonprotein-coding RNA with a higher ratio of unique reads (22.21% in G and 29.10% in S). In addition, the repeat-associated small RNAs made up a larger proportion in S library (6.02% of total reads, representing 20.51% of unique reads) than in G library (0.2% of total reads, representing 2.43% of unique reads). The highest proportion of unique sequences (59.31% and 57.13%, respectively) were attributed to unannotated small RNAs in both libraries, while a smaller proportion of total reads were observed and might cover other classes of small RNAs such as piRNAs. In both libraries of miRNA, the smaller proportion of unique reads (9.48% G and 6.53% S) contained a larger proportion of total reads (>60%).
Novel miRNA prediction
Novel candidate miRNAs in the unannotated database of our libraries were identified by MIREAP software based on their characteristic hairpin structure (Schwab et al., 2005; Allen et al., 2007). Sixty novel candidate miRNAs in G library and 2425 ones in S library were identified (Supplementary Table S4). These predicted premiRNA sequences of the novel candidate miRNAs were compared with the mature sequences in miRBase 18.0. Among 60 and 2425 potential novel miRNAs identified, 50 and 2217 novel mature miRNAs were predicted in the G and S library, respectively. Overall, the count of novel miRNA in G library was less than that in S library (Fig. 4B). In addition, the length of the novel miRNA sequences ranged from 18 to 26 nt.
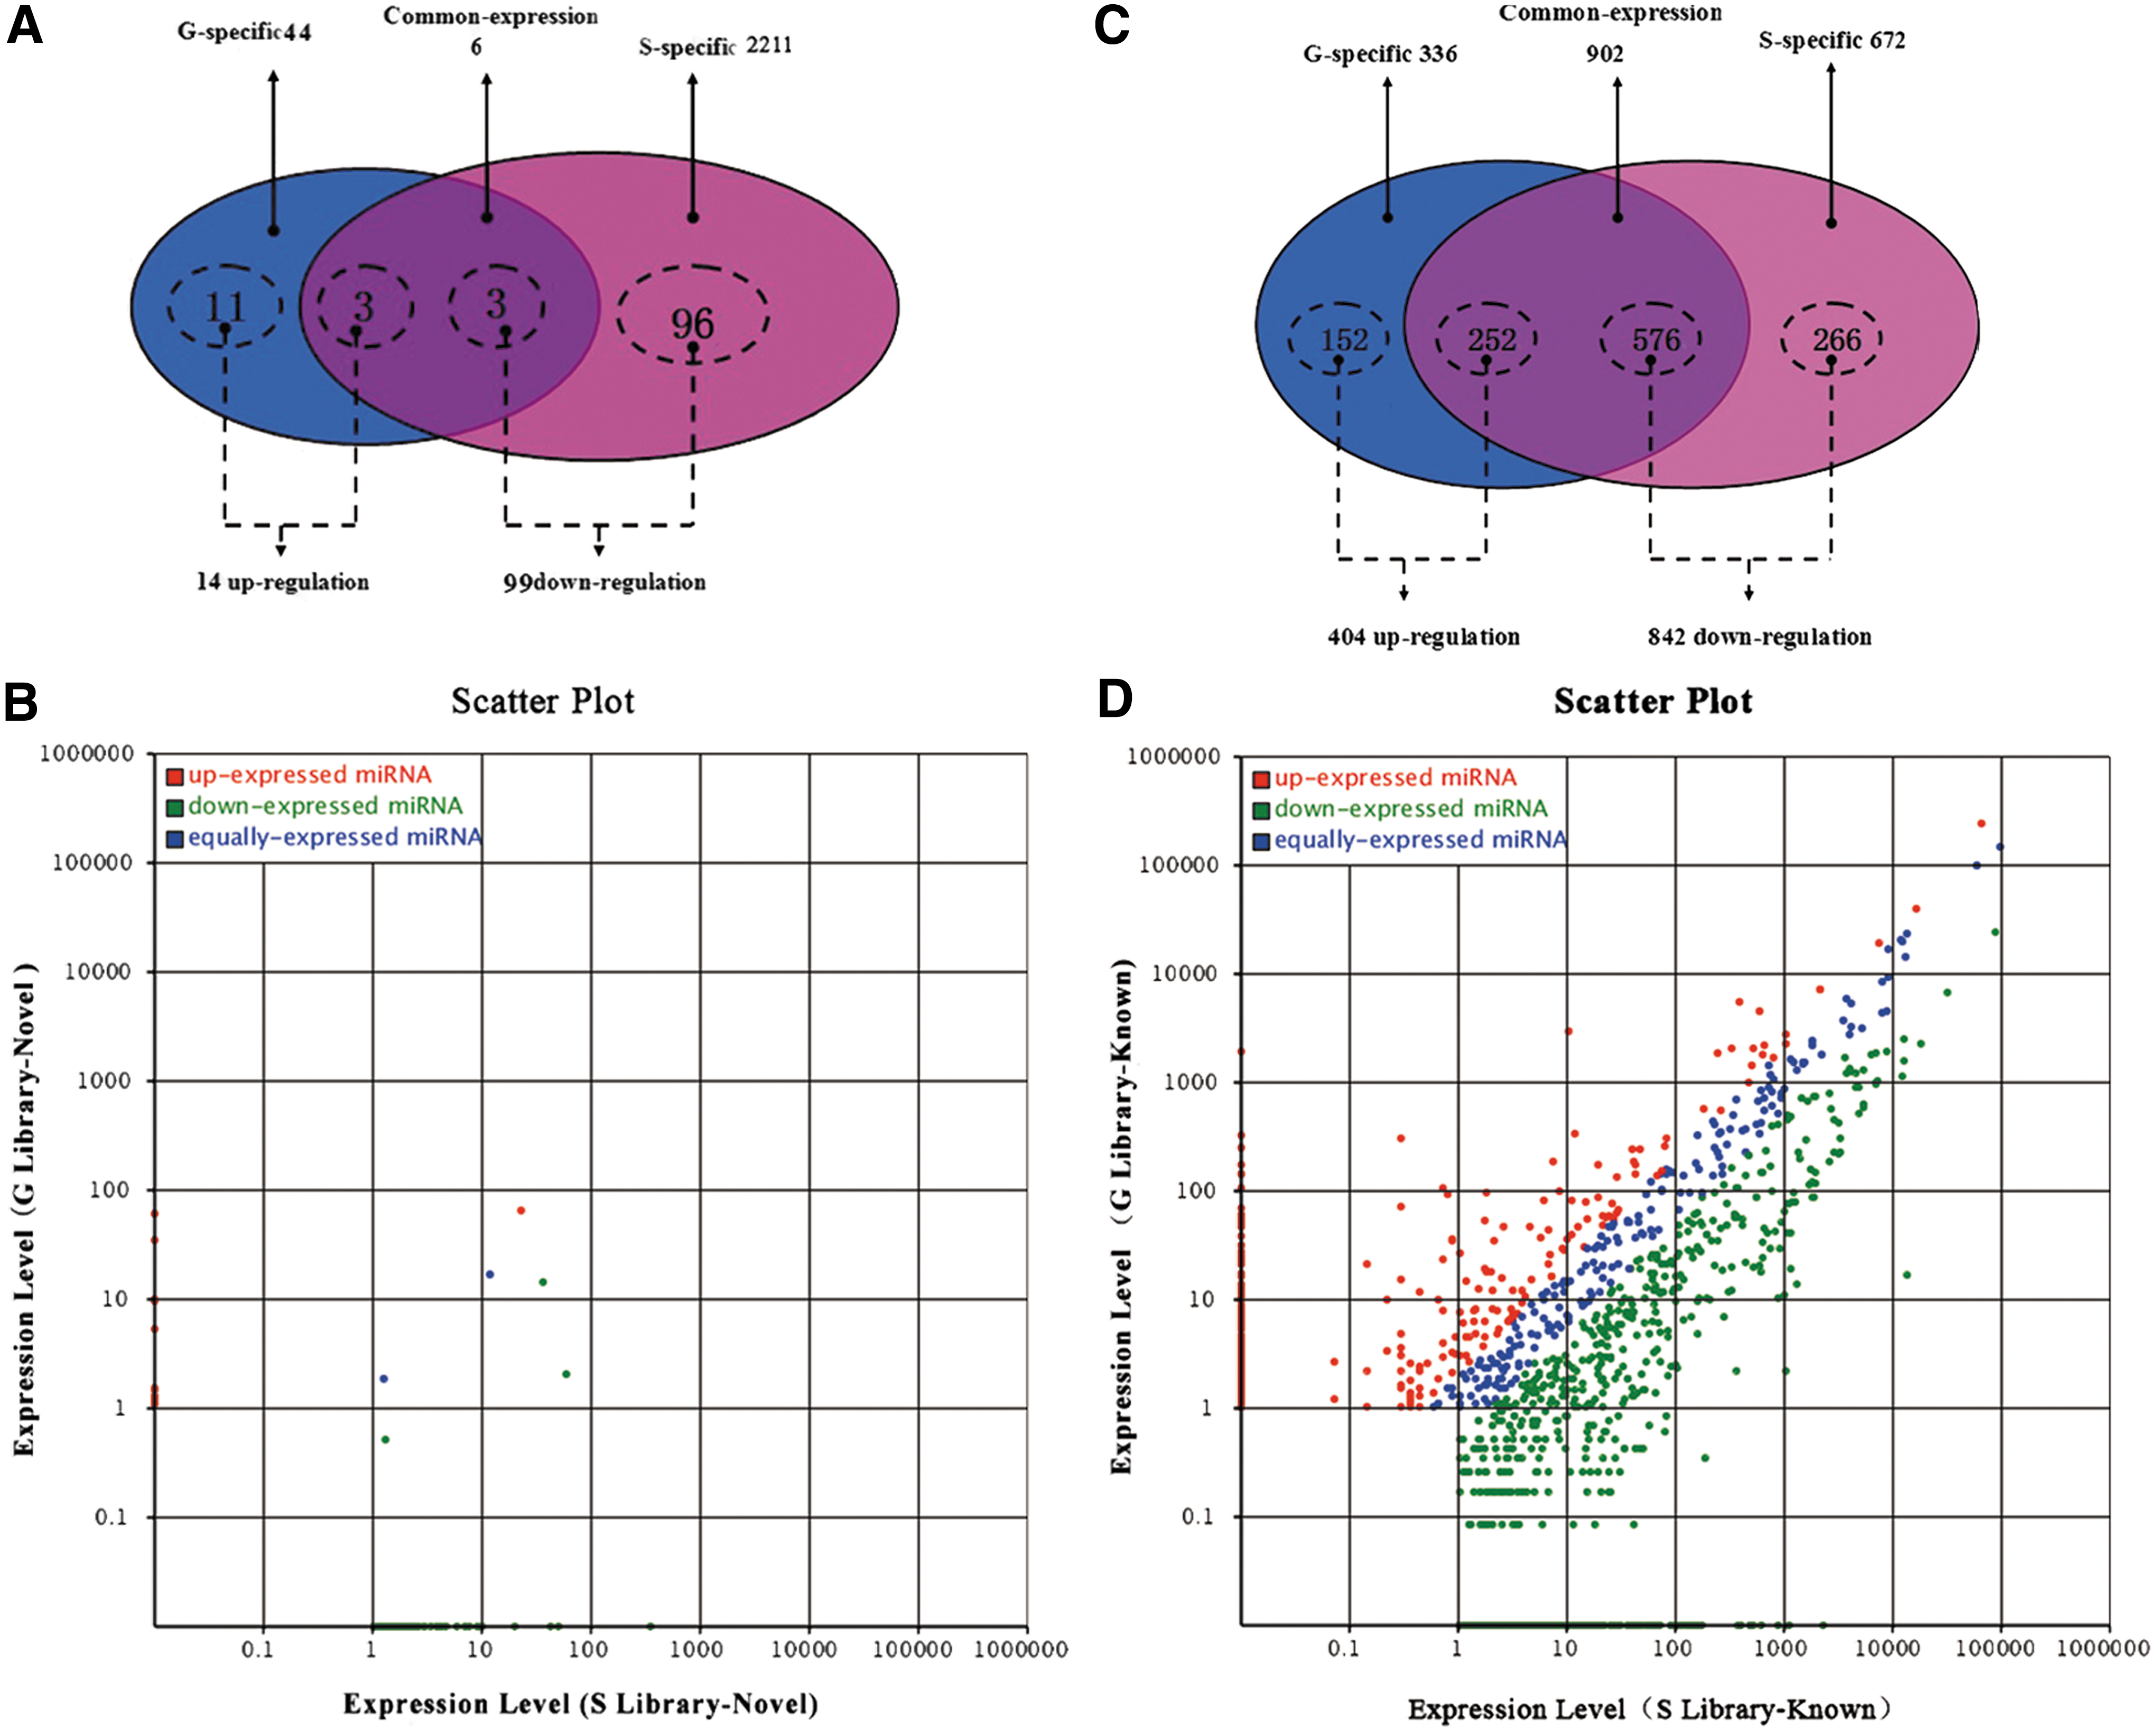
Comparison of expression pattern of novel miRNAs and known miRNAs identified between goats and sheep. Differentially expressed novel miRNAs and known miRNAs in G library and S library.
We next compared the 50 novel mature miRNAs in G library with that 2217 in S library (Fig. 4 and Supplementary Table S5). As results, 11 and 96 differential expression novel miRNAs were specific distinguished in G library and S library respectively. Simultaneously, there were six differentially expressed novel miRNAs (miR-21, -26, -27, -41, -14, and -55) commonly enriched in both libraries (Fig. 4A and Supplementary Table S5). Among them, only the expression levels of miR-21, -14, and -55 in G library were lower than that in S library, especially miR-55.
Analysis and validation of differentially expressed miRNAs
The biogenesis of miRNAs must be highly regulated by various space-times. Thus, comparing differentially expressed miRNAs between libraries provides insight into molecular events related to the skin HFs of different species. We first normalized the reads and then used a p-value < 0.001 and an absolute value of log2-ratio fold-change >1.0 as a threshold to judge the statistical significance of miRNA expression. Then, we filtered 1246 known miRNAs (out of 1910, 65.24%) that were significantly differentially expressed in the two libraries. Of those, 842 miRNAs (266 Sheep-specific, 576 co-expressed) were significantly downregulated, and 404 miRNAs (152 Goat-specific, 252 co-expressed) were significantly upregulated in G library when compared with the S library (Supplementary Table S6 and Fig. 4C). The number of the specific differentially expressed miRNAs in S library (21.35%) was much higher than that in G library (12.20%) (Fig. 4D). The result was similar to that of the differentially expressed novel miRNAs (Fig. 4A, B).
To validate the solexa sequencing results, we selected 10 differentially expressed miRNAs randomly from the two libraries for stem-loop quantitative real-time PCR (let-7a, miR-184-3p, miR-101a, miR-200a, miR-145, miR-17-5p, miR-451, miR-30b, miR-29b, and miR-125b-5p). The expression patterns of these 10 miRNAs are shown in Figure 5. Most of them showed similar expression patterns to those identified by Solexa sequencing analysis.
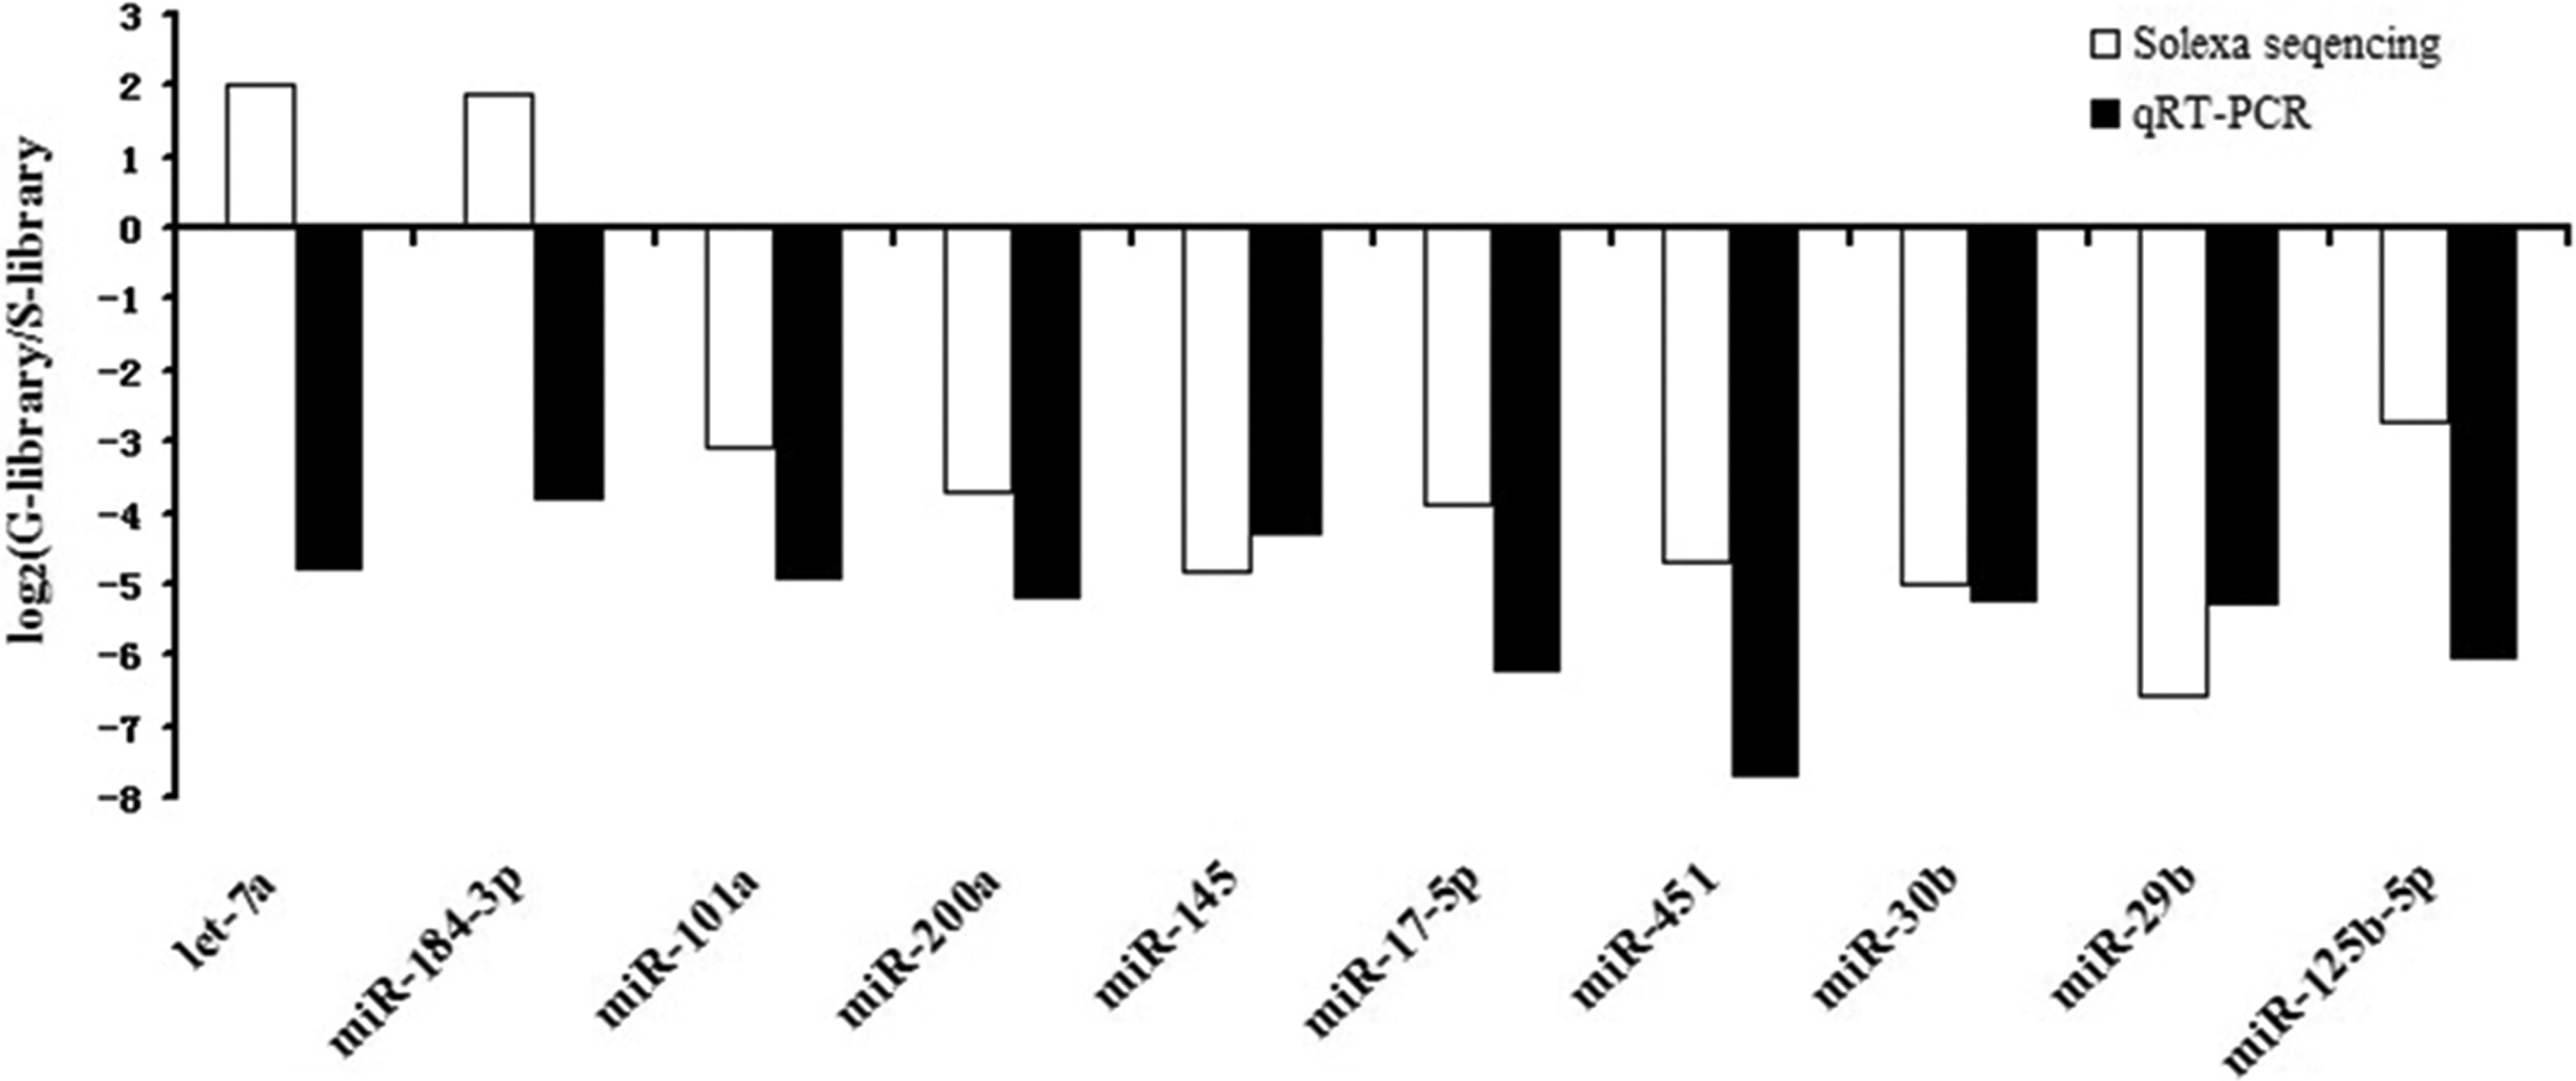
Validation of the sequencing results by qRT-PCR.
Known miRNAs and novel miRNAs target gene prediction and functional annotation analysis
To gain insight into the differences in regulatory mechanisms for known and novel miRNAs between the two libraries, MIREAP software was used to predict target genes of the miRNA. In G library, 2,195,185 miRNA-mRNA interaction sites for 1238 known miRNAs and 101,984 miRNA-mRNA interaction sites for 60 novel miRNAs were predicted. In S library, 2,880,071 miRNA-mRNA interaction sites for 1574 known miRNAs and 4,381,137 miRNA-mRNA interaction sites for 2425 novel miRNAs were predicted. These results illustrate that one target gene can be regulated by more than one novel miRNA and one miRNA can regulate several target genes simultaneously (such as shown in Supplementary Table S7). To further explore the differences of target genes between the two libraries, we carried out a GO enrichment and KEGG pathway analysis using the DAVID gene annotation tool. GO enrichment analysis for target genes based on the cellular component showed that 8706 target genes were involved in cellular components. Molecular function analysis showed that 8444 target genes were assigned different functions, specifically 85.2% of genes were related to copper ion binding functions. In addition, 8073 target genes were involved in biological processes. Not every Go-term had a direct effect on HF development, but they would likely take part in the regulation process (we filtered several major classes of Go-terms, shown in Supplementary Table S8).
KEGG pathway annotation showed that 8163 target genes were involved in 276 biological functions. (Supplementary Table S8 as examples). The most enriched pathway was the MAPK (2.52%) signaling, followed by the Wnt (1.83%), cytokine-cytokine receptor (1.70%), neuroactive ligand–receptor interaction (1.65%), and so on.
Discussion
miRNAs are involved in various cell processes including cell differentiation, proliferation, migration and apoptosis. There is growing evidence that miRNAs take part in the regulation of HF development. A large number of studies have proven that miRNAs play important roles in the regulation of HF development (Ning and Andl, 2013). However, few studies have focused on the difference of the miRNA profiles in the telogen skins of goat and sheep. Our study tried to explore the gene expression profiles during HF development in cashmere goats and fine-wool sheep.
In S library, the majority of the clean reads (60.55%) were 21–23 nucleotides long, which is within the typical size range for animal miRNAs (Blaszczyk et al., 2001). The abundance of 22nt small RNAs (32.18%), which is the typical size of Dicer-derived products (Xie et al., 2011), was more than the sum of 21nt (13.75%) and 23nt (14.62%) small RNAs. This result agrees with the recent deep sequencing in Ovis aries (Zhang et al., 2013a). However, the size of the goat sRNAs was characterized by a notable bimodal distribution, including a weak peak (∼19–21 nucleotides, accounting for 34.19%) and a strong peak (∼21–23 nucleotides, accounting for 55.08%). The 22-nt small RNAs were the most abundant (33.88%) and the next larger fractions were the 20-nt (20.29%), 21-nt (10.91%), and 23-nt (10.29%) small RNAs. This result is consistent with that previously reported for other Cashmere goats (Liu et al., 2012). Overall, the abundant 21–23-nt size classes may primarily represent miRNAs and were similar in both libraries.
In this study, a total of 1238 known mammalian miRNAs in G library and 1574 ones in S library were identified. These miRNAs in G library were more uneven than those in S library, especially located in chromosomes 1, 15, 2, 3, and 5, which means that the number of miRNAs on positive strands was not equal to that on negative strands in both libraries. We found seven miRNA families were conserved in 85 species. Among them, miR-127, miR-136, miR-154, miR-299, and miR-368, had been reported (Liu et al., 2012) and undef and miR-368 families were newly discovered. This outcome indicates that these seven miRNA families are necessary for the development of HFs in livestock. In the highest abundant 10 known miRNAs, 7 miRNAs (miR-143, -203, let-7, -7-5p, -7b, -7c, and -7f) expressed in both libraries and their total reads occupied more than a half. As expected, these miRNAs may play an important role in HF development. For example, miR-143 controls smooth muscle and endothelial cell function (Deng et al., 2015), miR-203 regulates keratinocytes differentiation (Deppe et al., 2016), and let-7 family regulates cell differentiation (Deppe et al., 2016). On the other hand, miR-378, −378e and −378d were only detected in G library, which promote angiogenesis (Joyce et al., 2011). And miR-21, −101, and 101c were only found in S library, which promote HF-derived neural crest stem cell differentiation (Ni et al., 2014). This may be the main cause of the diversity of compositions in these two small RNA libraries.
In addition, 60 novel candidate miRNAs in G library and 2425 ones in S library were identified. We predicted novel miRNAs via characteristic hairpin structure (Schwab et al., 2005; Allen et al., 2007). Fifty and 2217 novel mature miRNAs were predicted in G library and the S library. And the expression levels of novel mature miRNAs were much lower than conserved miRNAs. This result provides further evidence that nonconserved miRNAs are often expressed at a lower level than conserved miRNAs. The low abundance of novel miRNAs might provide a special role for HF development and growth during various stages. These differences in 50 novel miRNAs we analyzed in the two species might reflect the characteristics of miRNA expression in a spatial- or tissue-specific manner. Thus, whether these low abundance miRNAs are expressed at higher levels in other tissues and organs, or whether their regulation mechanism is related to environmental and others factors needs further investigation.
The differences of miRNAs target genes between the two libraries were explored via a GO term and KEGG pathway annotation. As expected, the Notch signaling pathway, which is a primary signaling pathway in telogen and is universally required for regulating HF differentiation and maintaining hair cycle homeostasis, was also included in our results (Ezratty et al., 2011; Lin et al., 2011; Aubin-Houzelstein, 2012) (Supplementary Fig. S4). In addition, several signaling pathways that play a role in controlling HF development were found by KEGG analysis, such as the TGF-beta signaling pathway (Jamora et al., 2004; Lin and Yang, 2013), Jak-STAT signaling pathway (Nishio et al., 2001; Schmitt et al., 2012), Wnt signaling pathway (Andl et al., 2002; Millar, 2002), VEGF signaling pathway (Li et al., 2012a, 2012b), MAPK signaling pathway (Dickinson et al., 2011), and ErbB signaling pathway (Wieduwilt and Moasser, 2008). In contrast, a number of enriched pathways did not play a major role in HF development and its related functions, such as neuroactive ligand–receptor interaction, cytokine–cytokine receptor interaction, and Axon guidance. In summary, the GO term and KEGG pathway annotations for the predicted miRNA targets further supported the significant roles of these novel miRNAs during HF development and growth.
Conclusion
Overall, this study provides important information about the role of miRNAs in the regulation of HF development and their function in the telogen phase. A total of 107 novel miRNAs and 1246 known miRNAs were differentially expressed in goat library and sheep library. Further identifying their targets will illustrate the roles of these differentially expressed miRNA in telogen HF development and growth. This observation may help future investigations of the regulation of miRNAs during wool quality improvement.
Footnotes
Acknowledgments
This research was supported by the Cashmere goat breeding center of Liaoning province. This work was supported by grants from the National Natural Science Foundation of China (NSFC) (Nos. 30800807 and 31072097), the Special Foundation for Postdoctor of China Ministry of Education (No. 20100471261) and Special Funds for Scientific Research on Public Causes (201303119).
Disclosure Statement
No competing financial interests exist.
References
Supplementary Material
Please find the following supplemental material available below.
For Open Access articles published under a Creative Commons License, all supplemental material carries the same license as the article it is associated with.
For non-Open Access articles published, all supplemental material carries a non-exclusive license, and permission requests for re-use of supplemental material or any part of supplemental material shall be sent directly to the copyright owner as specified in the copyright notice associated with the article.