
Abstract
To explore the correlation between miR-16 expression in T cells of peripheral blood mononuclear cells (PBMCs) and Th17/Treg imbalance in rheumatoid arthritis (RA) patients. Forty RA patients were recruited as the case group and further grouped as active RA and inactive RA groups; 21 healthy individuals were selected as the control group. Th17 and Treg were measured by flow cytometry, and their related cytokines were measured by FlowCytomix. RORγt, FoxP3 mRNA, and miR-16 expression in T cells was determined by real-time quantitative polymerase chain reaction. Western blotting was performed to measure RORγt and FoxP3 protein expression. RA patients showed upregulated Th17 and RORγt mRNA and protein expression compared with the controls (all p < 0.05); active RA patients showed lower Treg and FoxP3 mRNA and protein expression compared with inactive RA patients and controls (all p < 0.05). Secretion levels of Th17-related cytokines were higher in active RA patients than in inactive RA patients and controls (all p < 0.05); whereas those of Treg-related cytokines were lower in active RA patients than in controls (all p < 0.05). Active RA patients showed increased miR-16 expression in Th17 cells and decreased miR-16 expression in Treg cells of PBMCs (both p < 0.05). Pearson's test showed that in the PBMCs of the RA patients, miR-16 expression in the Th17 cells was positively related with RORγt mRNA expression, and miR-16 expression in the Treg cells was positively related with FoxP3 mRNA expression (both p < 0.05). The expression of miR-16 in Th17 and Treg cells of PBMCs in RA patients was closely associated with the expression of RORγt and FoxP3. MiR-16 may be involved in Th17/Treg imbalance of RA patients by affecting the expression of RORγt and FoxP3.
Introduction
R
Th17 cells and their effector cytokines have been increasingly recognized as key players in inflammation, autoimmunity, and allergic reactions, and increased Treg activity may contribute to immune dysfunction (Zhang et al., 2011). Peripheral Th17/Treg cell imbalance has been proved significant in the pathogenesis of allergic rhinitis that is accompanied by bronchial asthma and periodontal diseases (Karthikeyan et al., 2015; Tao et al., 2015). Th17/Treg imbalance was found in children with Henoch–Schonlein Purpura (HSP) in the acute phase, which may initiate neuronal damage of axons and retinal ganglion cells (Liu et al., 2015; Wang et al., 2015). Therefore, the determination of the ratio of Th17/Treg cells and their cytokines may be useful for diagnosing autoimmune diseases (Nagy et al., 2015).
MicroRNAs (miR) are short, single-stranded noncoding RNAs, acting as regulators of gene expression (Filkova et al., 2014; Castro-Villegas et al., 2015). In 2007, Bhanji et al. (2007) initially supported with data a linkage between miRNAs and the pathogenesis of RA. Subsequent studies have demonstrated that regulated expression of miRNAs in synovia, T cells, or peripheral blood mononuclear cells (PBMCs) from RA patients is associated with inflammation, osteoclastogenesis, innate immunity, and cartilage synthesis (Stanczyk et al., 2008; Jones et al., 2009; Fulci et al., 2010; Zhu et al., 2012; Lai et al., 2013).
miR-16 has been demonstrated in studies to correlate with cancers, such as chronic lymphocytic leukemia and prostate cancer (Driskell et al., 2008; Musumeci et al., 2011). Elevated miR-16 in the plasma or serum is considered a prospective biomarker for RA detection (Churov et al., 2015). Various miRNAs play an important role in T cell proliferation and differentiation and the Th17/Treg plasticity, and overexpression of miRNAs can be used for developing the Th17/Treg type of protective immune response (Negi et al., 2015; Warth et al., 2015; Pandey et al., 2016). Previous studies have investigated that miR-21 correlates with the imbalance of Th17/Treg in patients with RA (Dong et al., 2014), whereas the correlation of Th17/Treg imbalance with miR-16 is rarely reported.
Our study, therefore, aims at figuring out the correlation between miR-16 expression and Th17/Treg imbalance in RA patients through measuring Th17-/Treg-related cytokines and transcription factors, to find out the possible mechanism for RA.
Materials and Methods
Study subjects
Forty patients with RA (8 men and 32 women; mean age 46.50 ± 14.80 years) who were admitted at People's Hospital of Tianjin from May 2014 to May 2015 were enrolled as the case group, according to the RA diagnostic standard revised by the American College of Rheumatism (ACR) in 1987 (Arnett et al., 1988). All patients were free of liver disease, diabetes mellitus, kidney disease, and thyroid disease. According to the 28-joint disease activity score (DAS28), those 40 cases were divided into the active RA group (n = 21) and the inactive RA group (n = 19) (Pollard et al., 2006).
Active RA was diagnosed based on the following criteria: (1) conforms to the classification criteria established by ACR in 1987; (2) three or more swollen joints, and at least two of the following additional conditions: duration of morning stiffness (MS) ≥1 h, erythrocyte sedimentation rate (ESR) ≥28 mm/h, increase of C-reactive protein ≥1.5 times the normal value, and five or more tender joints. Inactive RA should conform to at least five of the following conditions: (1) duration of MS ≤15 min; (2) no weakness; (3) no joint pain; (4) no joint tenderness or pain on motion; (5) no soft-tissue swelling in joint or tendon sheath; and (6) ESR ≤30 mm/h in women or ≤20 mm/h in men, and lasting for at least 2 months.
Active pleurisy, vasculitis, pericarditis, myocarditis, fever secondary to RA, or unexplained weight loss could not be taken as ease. DAS28 scoring: DAS28 = 0.56 × square root (SQRT) (t28) + 0.28 × SQRT (sw28) + 0.70 × Ln (ESR) + 0.014 × visual analogue scale (VAS). Twenty-one healthy subjects were recruited as the control group, including 8 men and 13 women, with a mean age of 43.86 ± 13.31 years, without autoimmune diseases, tumor, or recent infection. The general information (age and gender) of the three groups was not statistically significant (all p > 0.05). Informed consent was obtained from all study subjects, and the study has received the approval of the Ethics Committee of People's Hospital of Tianjin.
Extraction and isolation of PBMCs
Peripheral venous blood (40 mL) was drawn from each participant in the case group and the control group: 20 mL for serum isolation and the remaining for heparin anticoagulation (20 U/mL). The PBMCs were isolated from the whole blood by Ficoll density gradient centrifugation and washed three times with phosphate-buffered saline (PBS) for further use. Th17 and Treg cells were isolated from PBMCs by negative selection and positive selection, according to the instructions of the CD4+ T Cell Isolation Kit (Shanghai Bin Zhi Biotech Co., Ltd.) (Liu et al., 2006; Brucklacher-Waldert et al., 2009).
Flow cytometry
The PBMCs were suspended at a concentration of 1 × 10⁶/mL in RPMI1640 (Gibco) that was added along with 10% fetal bovine serum. Cell activation: PMA+Ion (25 ng/mL +1 μg/mL) and protein transport inhibitor BFA (1 μg/mL) (both from Sigma) were supplemented, and the cells were incubated at 37°C for 5 h with 5% CO2. The activated cells were stained by Phycoerythrin (PE)-Cy5-labeled anti-human CD3 and FITC-labeled anti-human CD8, followed by a reaction away from light at 4°C for 20 min.
After being washed with PBS, the cells were fixed with 100 μL fixation solution for 15 min and then washed. Permeabilization working solution was added, mixed for 15 min, and finally washed with PBS. Intracellular staining was performed with the addition of PE-labeled anti-human interleukin (IL)-17, and simultaneously, homeotype control reaction tubes were set up. The cells reacted to PE-labeled-IgG fluorescent monoclonal antibody for 30 min and were then washed. After precooling and washing by PBS suspension, the cells were counted by using FACSCalibur flow cytometry (BD). The results were analyzed by Cellquest software, with CD3+CD8−IL-17+ on behalf of Th17 cells.
The PBMCs suspensions without stimulation were added along with human PE-labeled anti-human CD4 and PE-Cy5-labeled anti-human CD25, and they were reacted in the dark at room temperature for 15 min. After precooling, washing with PBS, fixation, and permeabilization, the cells were left to react for 40 min, followed by semipermeable membrane buffer washing and suspension. Intracellular staining was performed with FITC-labeled anti-human FoxP3 for 30 min and simultaneously, homeotype control reaction tubes were set up. Then, the cells were washed followed by PBS suspension. Data were analyzed on an FACSCalibur flow cytometer (BD) by using Cellquest software, with CD4+CD25+FoxP3+ on behalf of Treg cells. All the antibodies were purchased from Proteintech Group, Inc.
FlowCytomix assay
Analysis of cytokines in serum was performed by using FlowCytomix kits (Bender MedSystems). Specific microspheres, differentiated by their sizes and the fluorescence intensity of the fluorescence substance coated on their surface, were coated with monoclonal antibodies that specifically reacted with each of the cytokines to be detected, including IL-17, IL-6, IL-21, IL-23, tumor necrosis factor (TNF)-α, interferon (IFN)-γ, IL-4, and IL-10.
Real-time quantitative polymerase chain reaction
Determination of miR-16 expression: Total RNA was extracted from T cells by Trizol (Invitrogen Corporation) according to the manual. The concentration of RNA was determined by using an ultraviolet spectrophotometer and was adjusted to 500 ng/μL: A260/280 = 1.8–2.1. According to published genetic sequences in the Genbank Database, the primers were designed by Primer 5.0 software and synthesized by Sangon Biotech (Shanghai) Co., Ltd. (Table 1). The RNA was reverse transcribed to cDNA by using the miScript Reverse Transcription Kit (Qiagen) at 37°C for 1 h or at 95°C for 5 min.
F, forward; R, reverse.
Real-time quantitative polymerase chain reaction (RT-qPCR) was performed by using miScript SYBR Green PCR (Qiagen), with U6RNA as the internal reference. Cycle conditions were as follows: 95°C for 5 min, one cycle; 94°C for 15 s, 58°C for 30 s, and 70°C for 34 s, total 40 cycles.
The two-step method was performed to measure RORγt and FoxP3 mRNA expression, respectively the specific transcription factor of Th17 cells and Treg cells. First, RORγt and FoxP3 were reverse transcribed by using the All-in-one™First-Strand cDNA Synthesis kit (Genecopoeia, Inc.); second, the RT-qPCR was performed with All-in-oneqPCRMix (Genecopoeia, Inc.) by using human Actin as the internal reference. Cycle conditions were as follows: 95°C for 10 s, one cycle; 95°C for 10 s, 60°C for 20 s, and 72°C for 15 s, total 40 cycles. All the operations described earlier were based on the 7500 RT-qPCR kit (Applied Biosystems, Inc.); the relative expression levels were expressed in CT and calculated by using the formula 2−ΔΔCT.
Western blotting
PBMCs collected from each group were fully lysed with protein lysis buffer, and the protein concentration was determined by using the bicinchoninic acid assay (BCA) method. The treated protein sample (50 μg) was electrophoresed in 10% sodium dodecyl sulfate polyacrylamide gel electrophoresis (SDS-PAGE), transferred onto polyvinylidene difluoride (PVDF) membranes, and finally blocked for 2 h at room temperature in 5% not-fat milk powder, followed by incubation with RORγt, FoxP3, and rabbit-anti-human β-actin (diluted in the ratio 1:1000) overnight at 4°C, with the addition of HRP-conjugated secondary antibody (1:2000) for 2 h at room temperature and washing with TBS-T.
Finally, immunoblot signals were visualized by using Electro-Chemi-Luminescence Plus, then imaged, and quantitated by using the Synegene gel imaging system, by using β-actin as the internal reference. The antibodies described earlier were purchased from Proteintech Group, Inc.
Statistical analysis
SPSS version 20.0 software (SPSS, Inc.) was applied for statistical analysis. Enumeration data were expressed as rate or percentage, and the chi-square test was used for the comparison between case group and control group. Measurement data were expressed as
Results
Th17 and Treg cells in RA patients
Th17/Treg cells in the case group and the control group were determined by flow cytometry (Fig. 1). Th17 cells in inactive RA patients were significantly higher than those in the controls, but lower than those in active RA patients (both p < 0.05). The number of Treg cells showed no statistical significance between the controls and inactive RA patients (p > 0.05), but the number of Treg cells was significantly lower in active RA patients than in inactive RA patients and the controls (both p < 0.05). As Figure 2 showed, the ratio of Th17/Treg cells in inactive RA patients was significantly higher than that in the controls, but lower than that in the active ones (both p < 0.05). These results suggested that RA patients had an imbalance of Th17/Treg cells.
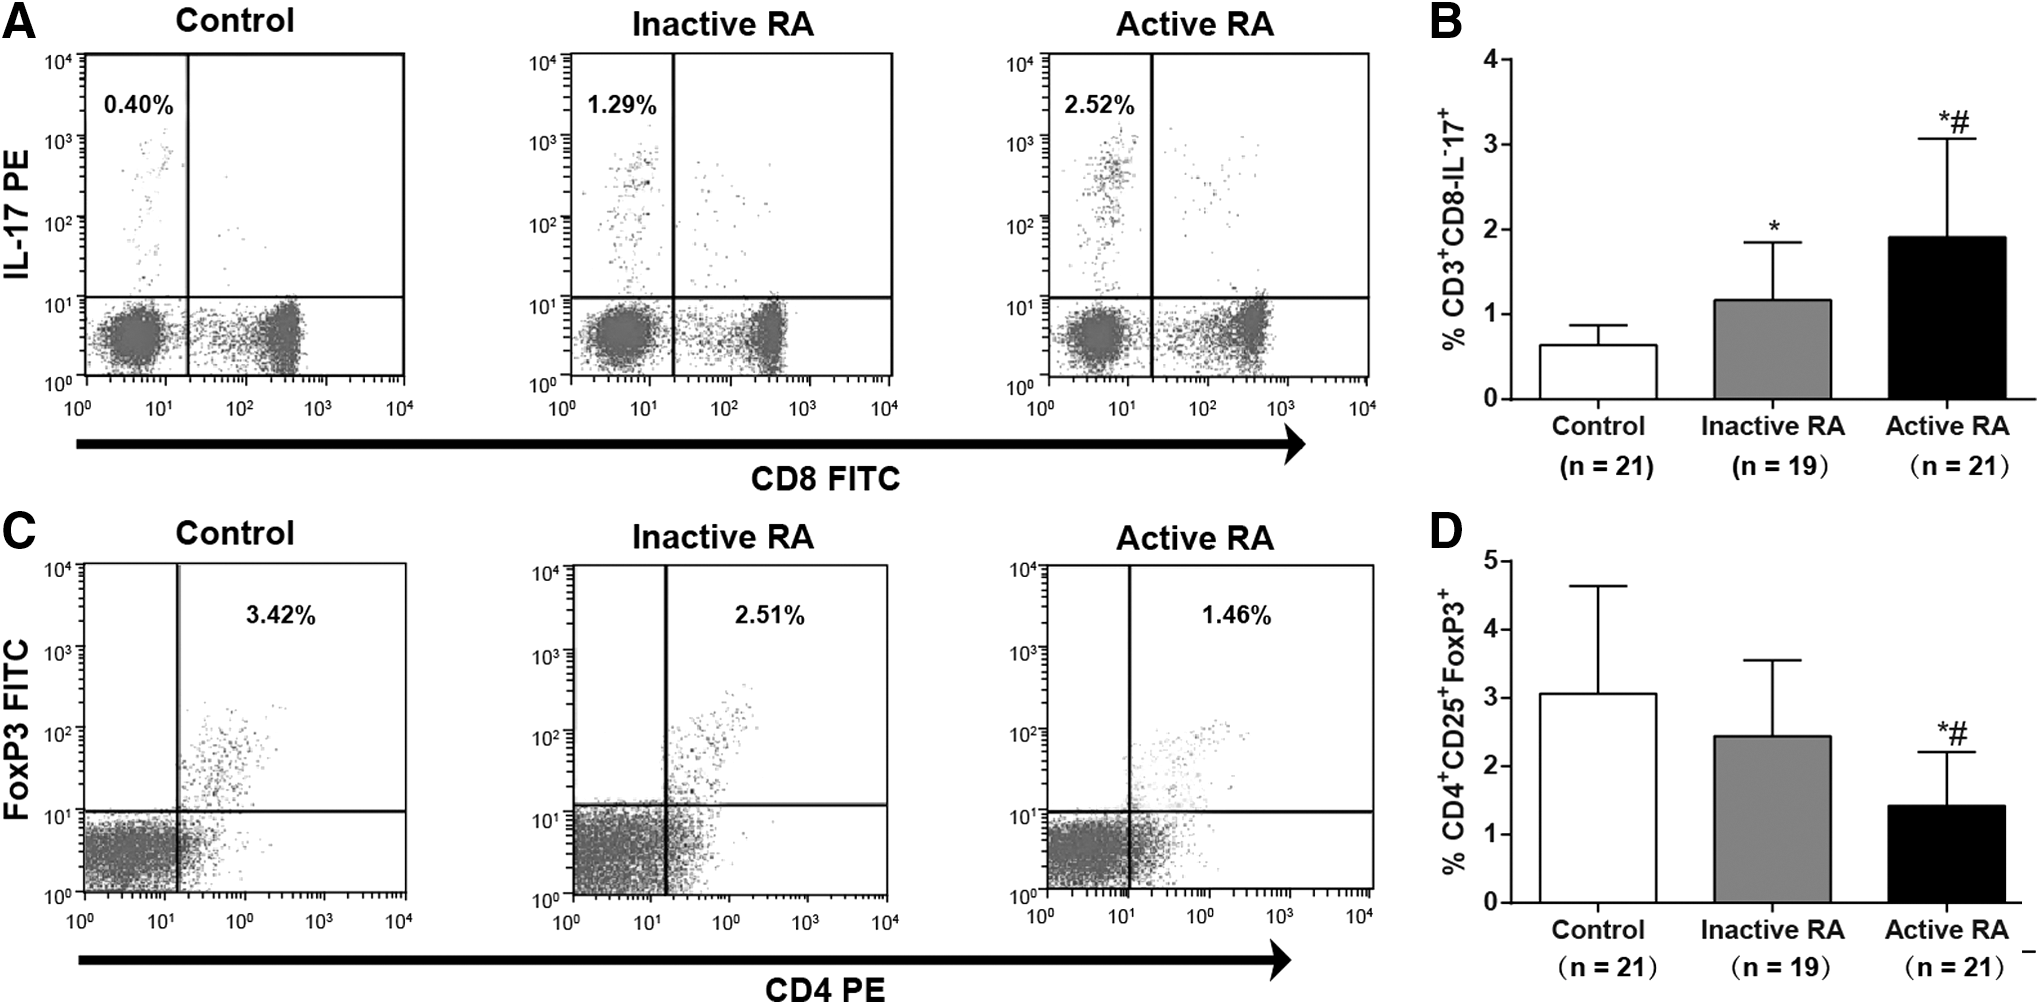
Th17/Treg cells detected by flow cytometry in RA patients and controls:

Th17/Treg cell ratio in the active RA patients (n = 21), inactive RA patients (n = 19), and the controls (n = 21). Note: *, compared with the control group, p < 0.05; #, compared with the inactive group, p < 0.05; the experiment was performed three times.
RORγt and FoxP3 mRNA expression in RA patients
RORγt and FoxP3 mRNA expression was detected by using RT-qPCR. As the results showed in Figure 3, RORγt mRNA expression in the inactive group was higher than that in the control group, but lower than that in the active group (both p < 0.05); FoxP3 mRNA expression, however, was significantly lower in the active RA patients compared with that in the controls (p < 0.05). No statistical significance was observed between the inactive ones and the controls (p > 0.05).

Relative expression of RORγt and FoxP3 mRNA in the active RA patients (n = 21), inactive RA patients (n = 19), and controls (n = 21). Note:
RORγt and FoxP3 protein expression in RA patients
Western blotting (Fig. 4) showed that RORγt protein expression in both active RA patients and inactive RA patients was significantly higher than that in the control group (both p < 0.05), whereas the FoxP3 protein expression in the active RA patients was remarkably lower compared with the inactive ones and the controls (both p < 0.05), which signified a close correlation between the transcription factors, RORγt and FoxP3, and Th17/Treg imbalance in RA patients.
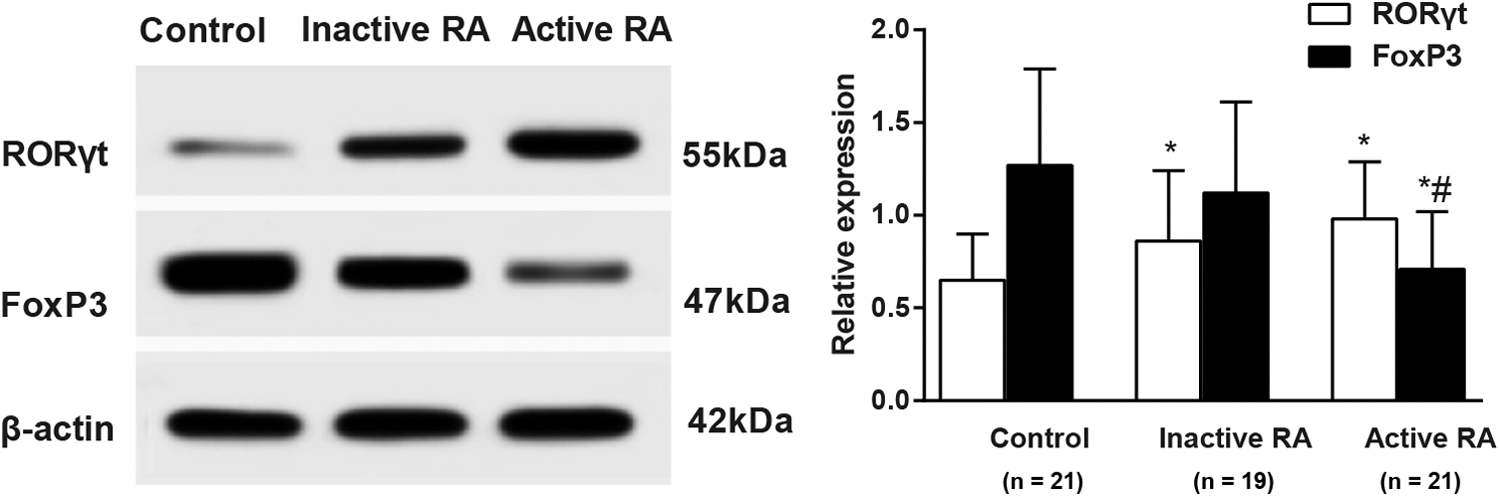
Western-blotting results (left) and relative expression (right) of RORγt and FoxP3 in the active RA patients (n = 21), inactive RA patients (n = 19), and controls (n = 21). Note: *, compared with the control group, p < 0.05; #, compared with the inactive group, p < 0.05; the experiment was performed three times.
Th17- and Treg-related cytokine levels in RA patients
The cytokine levels in the serum of each group were measured by flow cytometry (Fig. 5). Our study demonstrated that the secretion levels of Th17-related cytokines, IL-17, IL-6, IL-21, IL-23, TNF-α, and IFN-γ, were significantly higher in the inactive RA patients than in the controls (all p < 0.05), but lower than those in the active ones (all p < 0.05). The secretion levels of Treg-related cytokines, IL-4 and IL-10, were significantly lower in the active RA patients than in the controls (both p < 0.05). Compared with the control group, the secretion level of IL-10 showed no statistical significance (p > 0.05) and the secretion level of IL-4 was significantly decreased (p < 0.05) in the inactive RA group. The results showed that there existed changes of Th17- and Treg-related cytokines in RA patients.
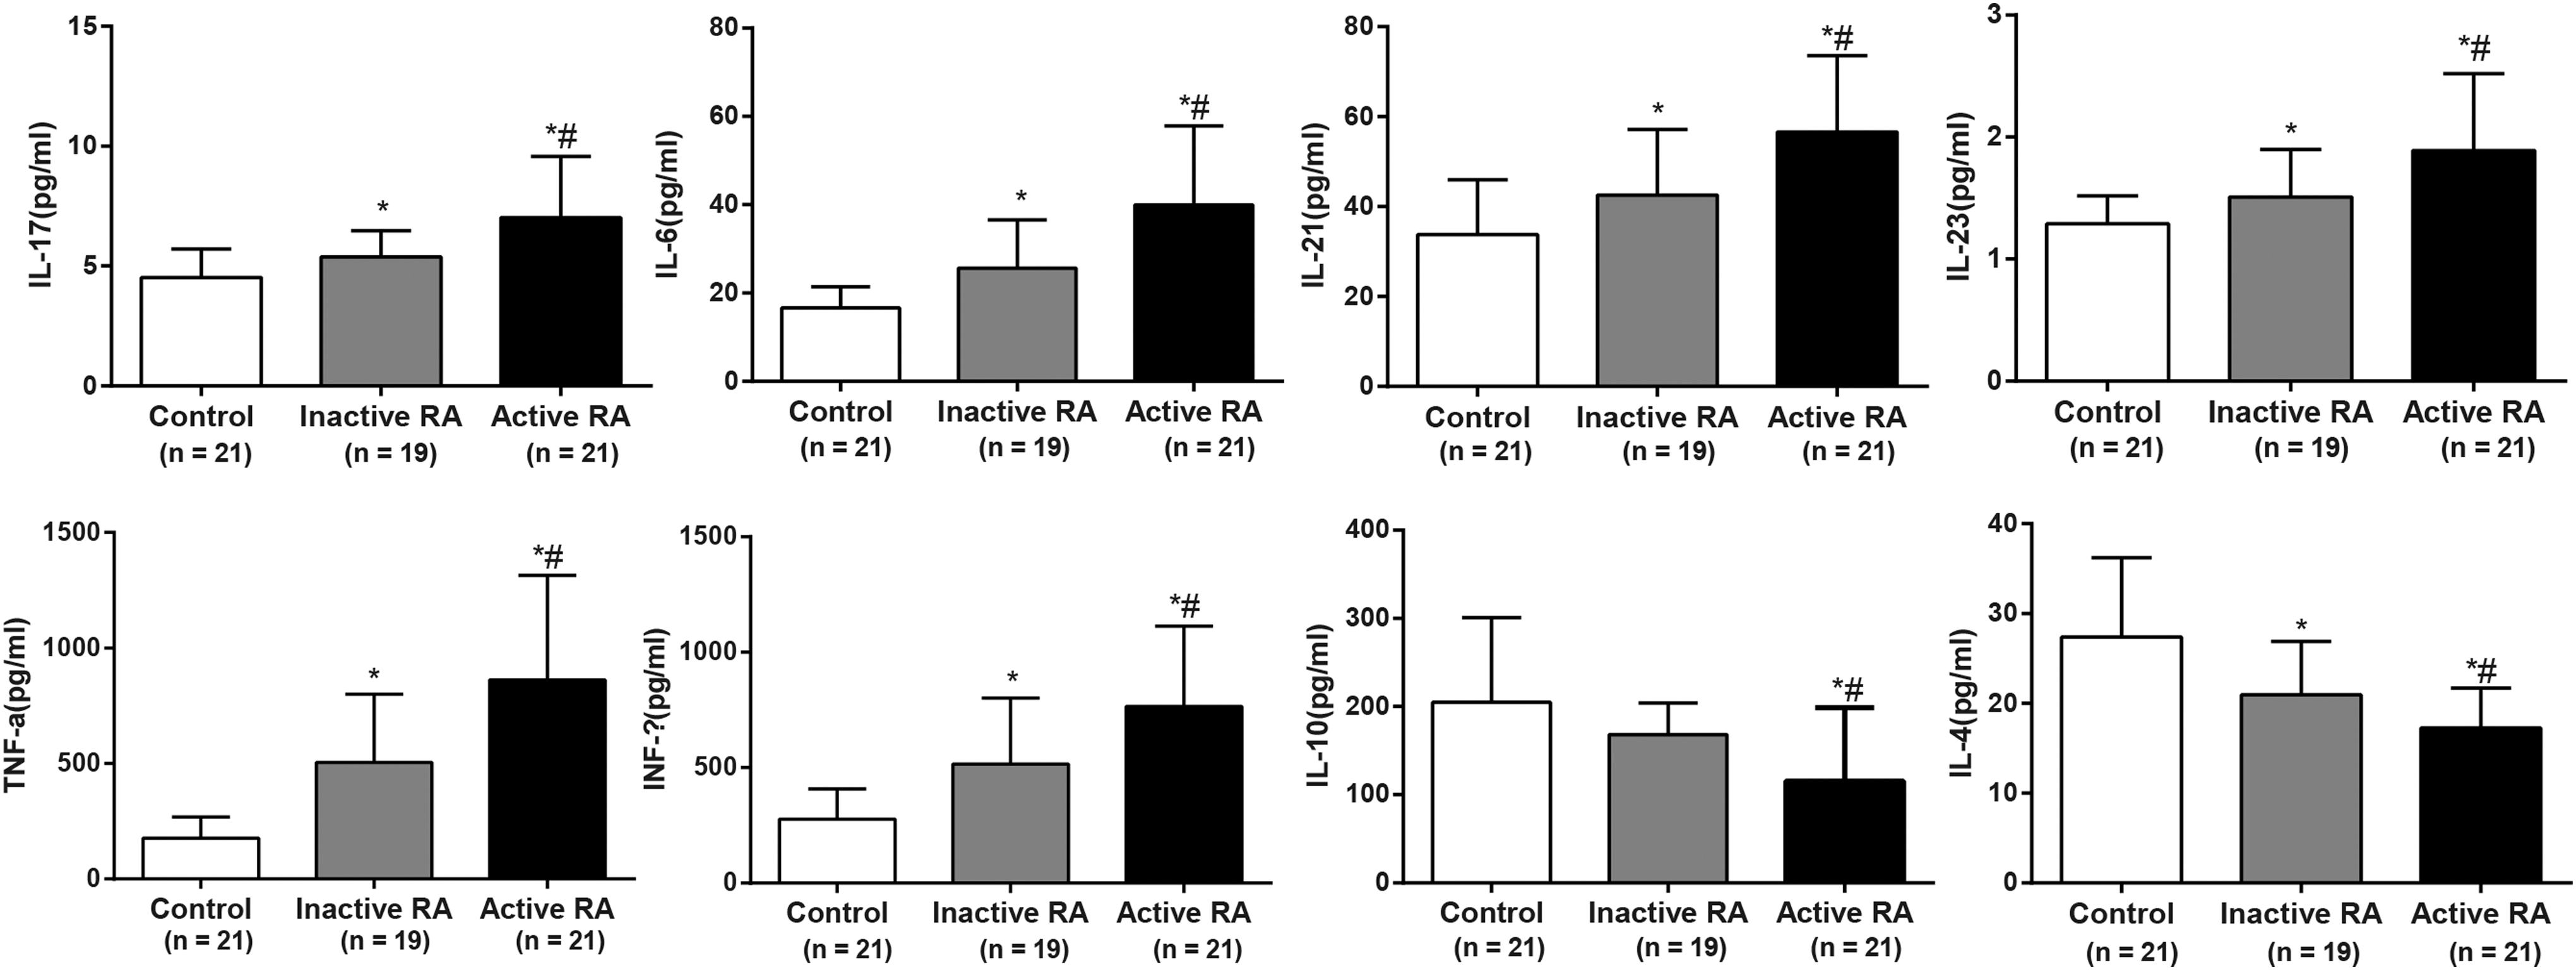
Cytokine levels in the active RA patients (n = 21), inactive RA patients (n = 19), and controls (n = 21). Note: *, compared with the control group, p < 0.05; #, compared with the inactive group, p < 0.05; the experiment was performed three times.
Comparison of miR-16 expression between RA patients and healthy controls
Relative expression of miR-16 in T cells of PBMCs was determined by using RT-qPCR, and the results were shown in Figure 6. In Th17 cells, the miR-16 expression in the inactive RA patients was significantly higher than that in the controls, but lower than that in the active ones (both p < 0.05). In Treg cells, however, the miR-16 expression in the inactive RA patients was significantly lower than that in the controls, but higher than that in the active ones (both p < 0.05). In addition, the miR-16 expression in Th17 cells was significantly higher than that in Treg cells in both the active and inactive RA patients (both p < 0.05).
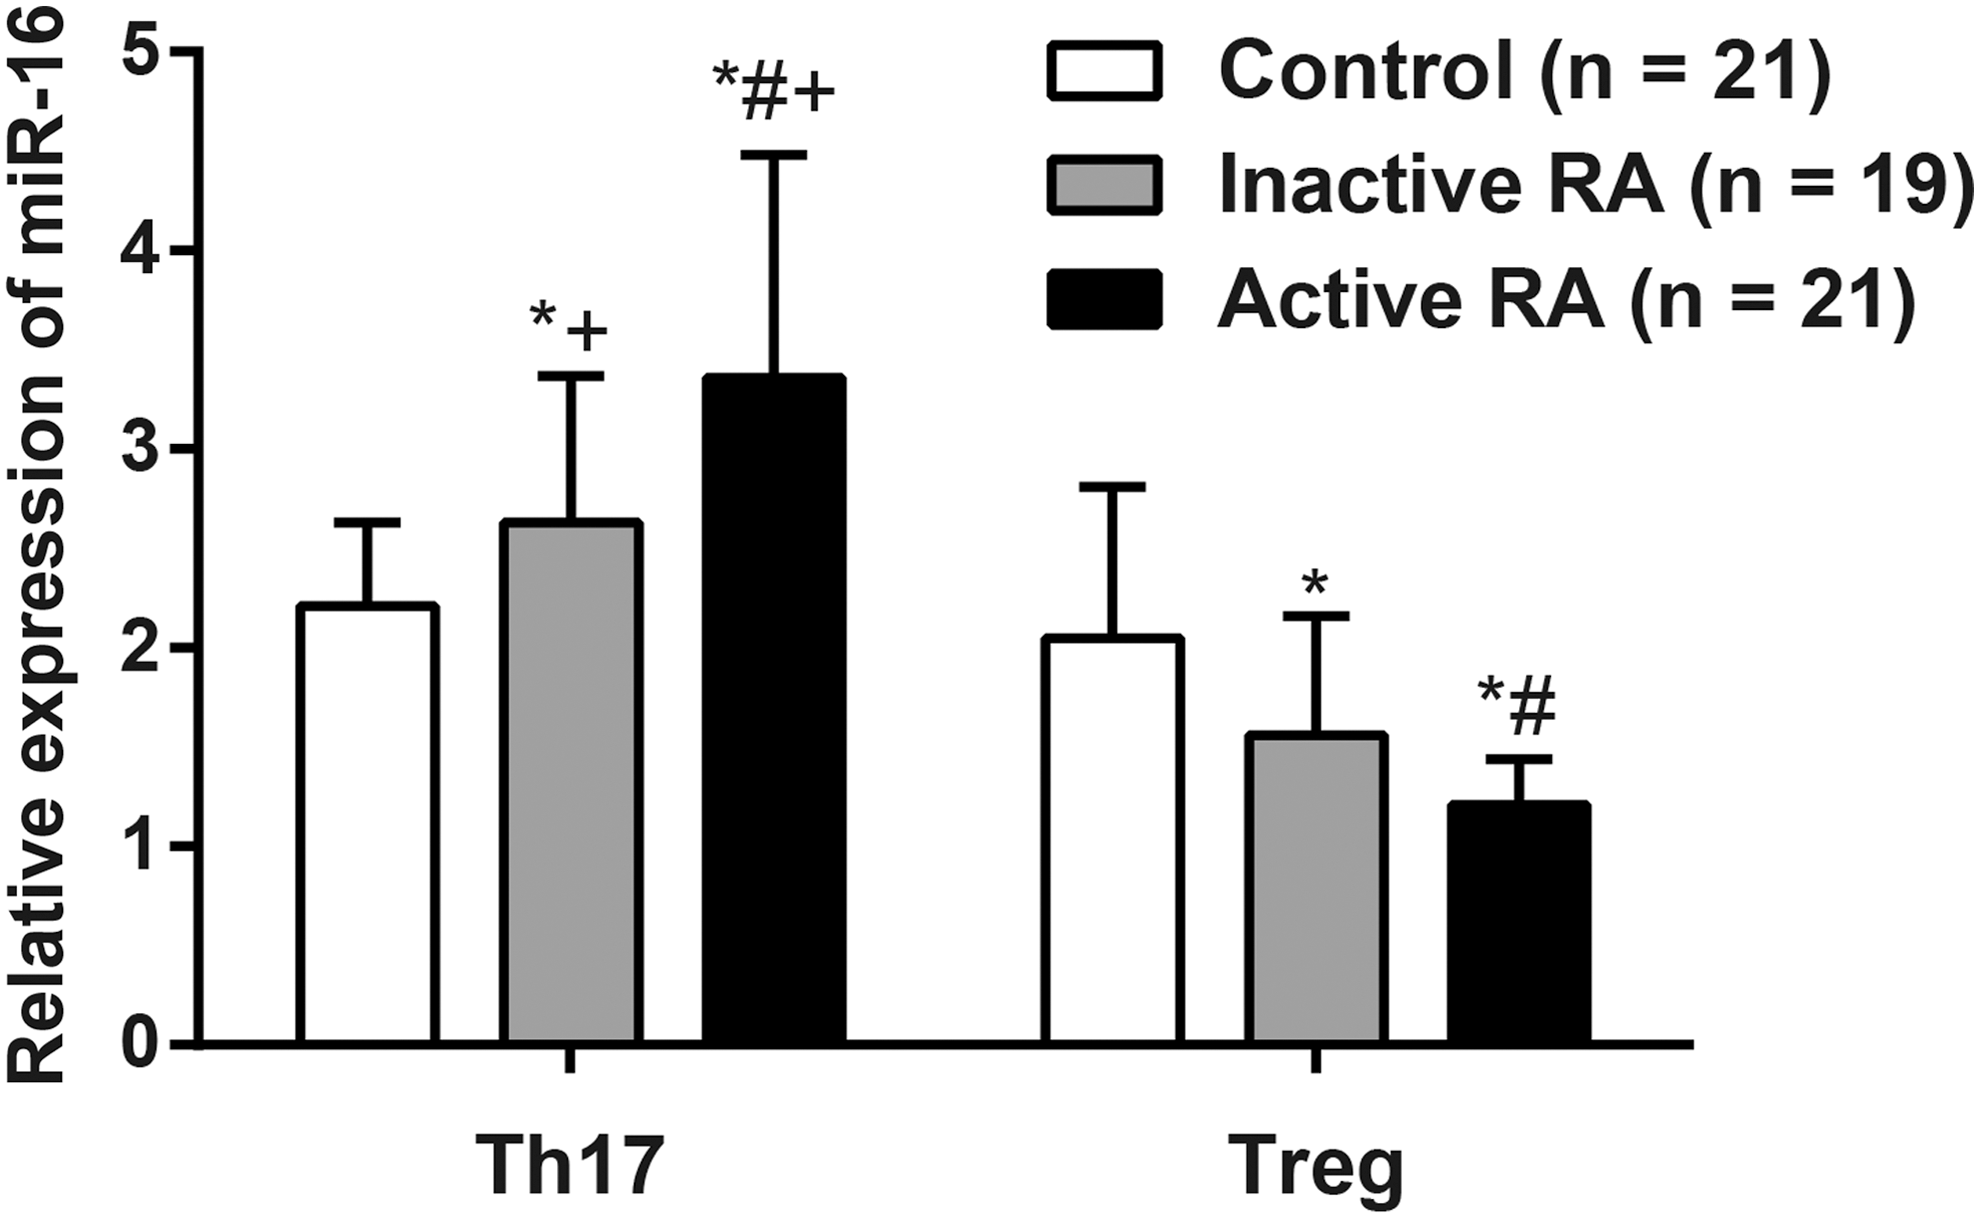
Relative expression of miR-16 in the active RA patients (n = 21), inactive RA patients (n = 19), and controls (n = 21). Note: *, compared with the control group, p < 0.05; #, compared with the inactive group, p < 0.05; +, compared with the Treg cells in the same group, p < 0.05; the experiment was performed three times.
Correlation between the expression of miR-16 in Th17 and Treg cells and the expression of RORγt and FoxP3
As shown in Figure 7, miR-16 expression in Th17 and Treg cells and RORγt and FoxP3 mRNA expression in the active RA patients were analyzed by using Pearson's correlation analysis, arriving at conclusions that the miR-16 expression in Th17 cells was positively related with RORγt mRNA expression (r = 0.707, p < 0.001), and the miR-16 expression in Treg cells was positively related with FoxP3 mRNA expression (r = 0.769, p < 0.0001).
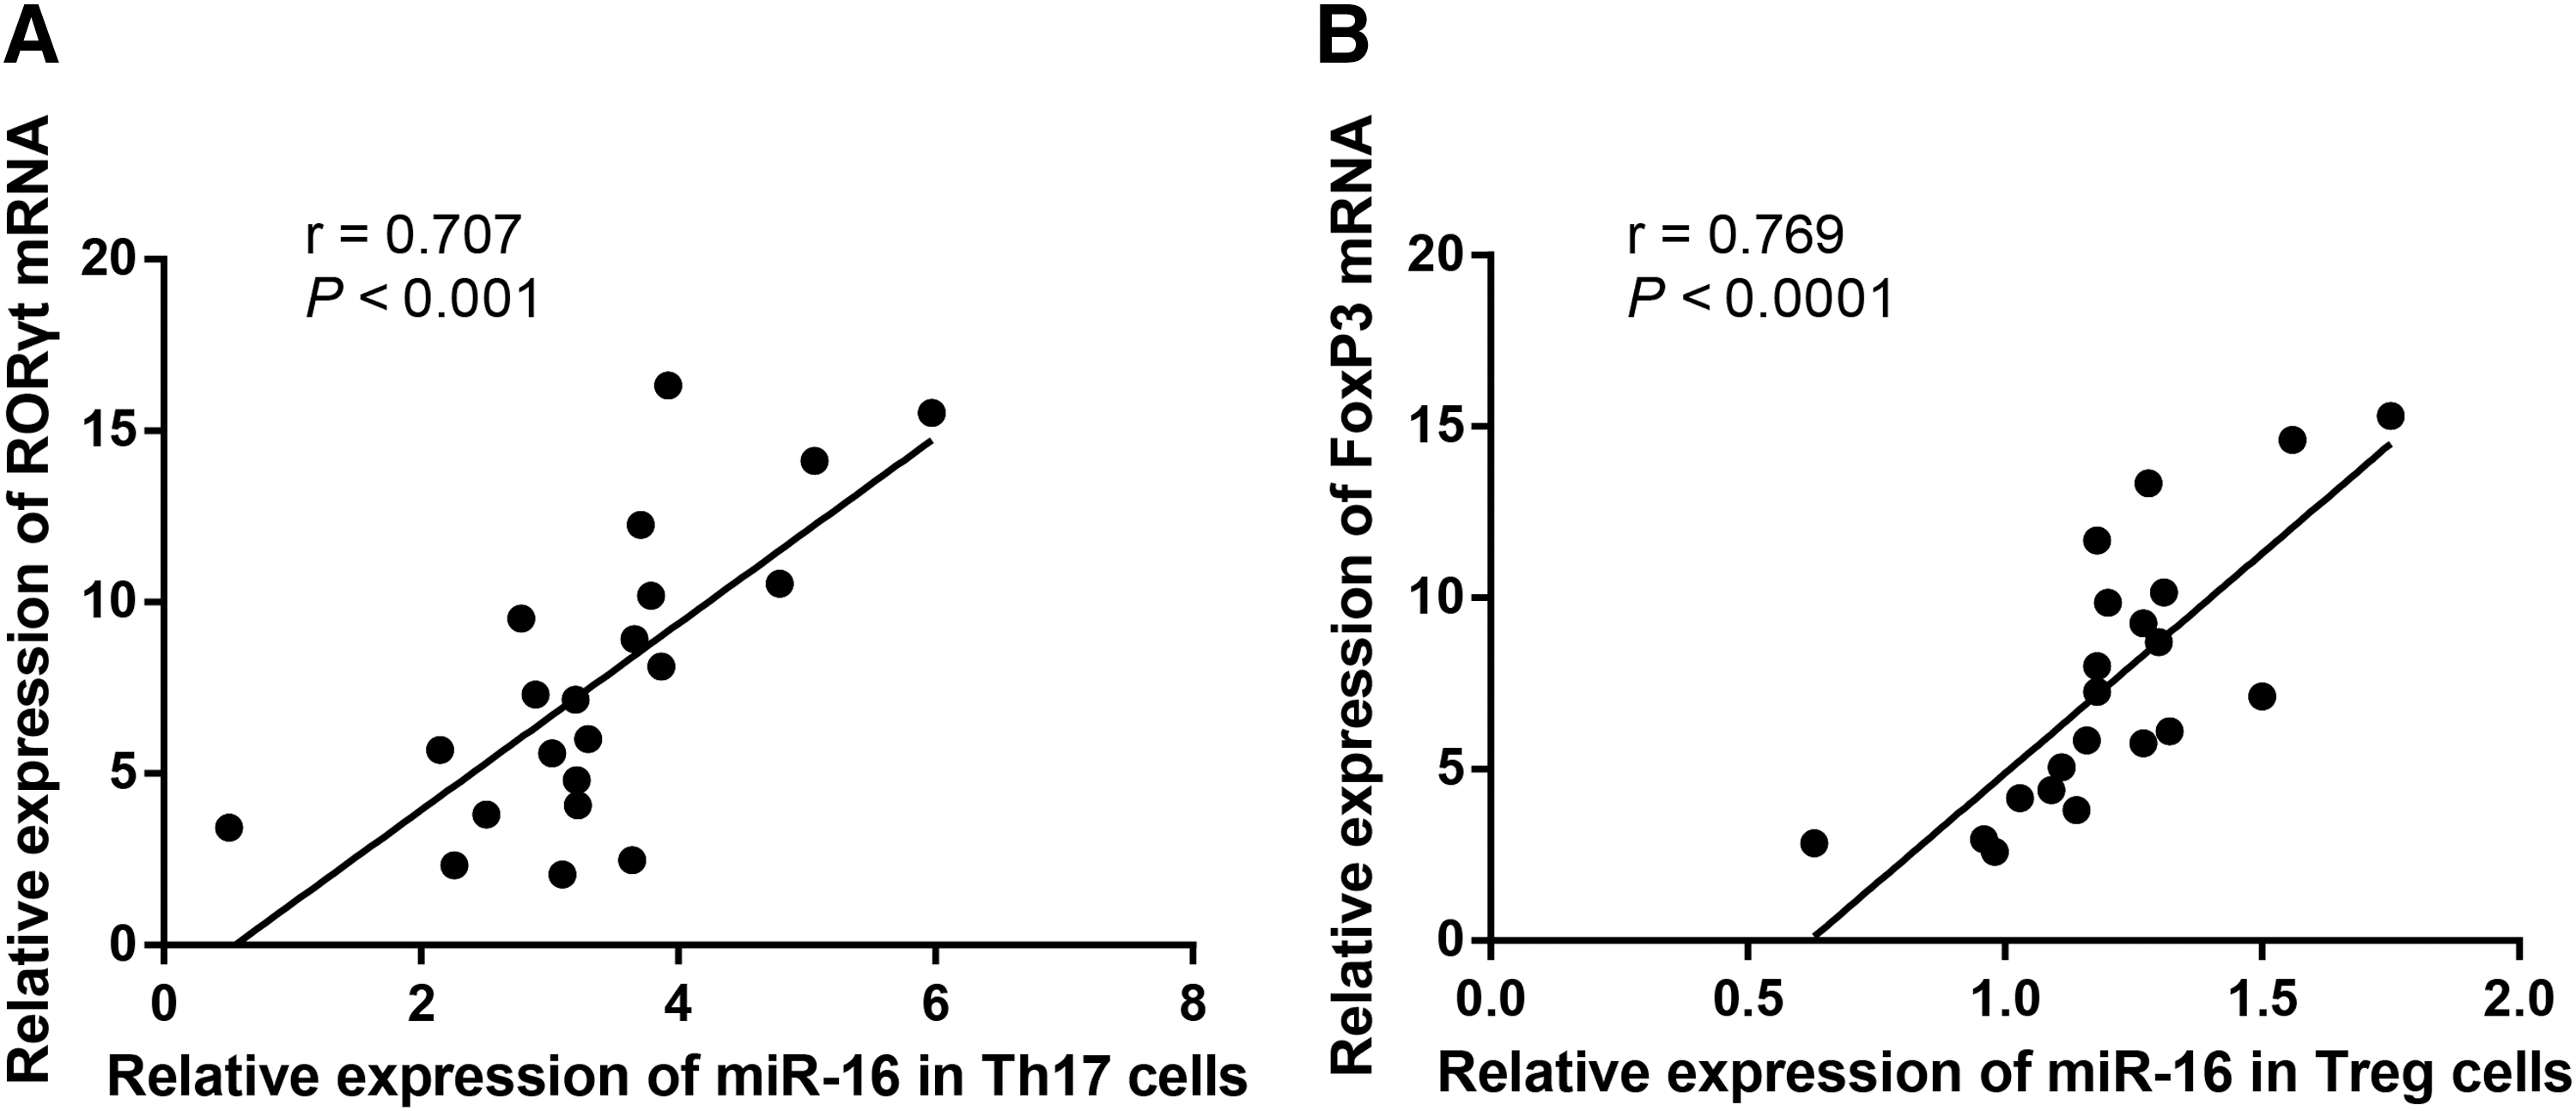
Correlation analysis of miR-16 expression in Th17 and Treg cells with the expression of RORγt and FoxP3 in the active RA patients (n = 21).
Discussion
The imbalance of Th17/Treg cells has been supported by substantial research that contributes to inflammatory autoimmune diseases, including RA, although the detailed mechanisms remain unclear (Lina et al., 2011; Samson et al., 2012; Wang et al., 2012a). Consistent with previous studies, we also found the increase of Th17 cells and the decrease of Treg cells in the PBMCs in RA patients, and that the Th17/Treg cell ratio in inactive RA patients was significantly higher than that in the controls, but lower than that in the active ones.
In addition, the secretion levels of Th17-related cytokines, IL-17, IL-6, IL-21, IL-23, TNF-α, and IFN-γ, were significantly increased and the secretion levels of Treg-related cytokines, IL-4 and IL-10, were significantly decreased in RA patients. Dong et al. (2014) explained that the imbalance may result from high levels of inflammatory cytokines from lymphocytes or lipopolysaccharide (LPS)-stimulated monocytes/macrophages, which promote Th17 cell differentiation and simultaneously inhibit Treg cell development. Furthermore, according to Niu et al. (2012), the proinflammatory cytokine microenvironment, characterized by the elevation of IL-6 and IL-23 levels and the decrease of TGF-β1 concentrations, could potentially explain the continued generation of Th17 cells and, meanwhile, the suppressed development of Treg cells.
The mRNA and protein expression of RORγt and FoxP3, the transcription factors of Th17 and Treg cells, respectively, were also detected in our study. Interestingly, we found that RORγt mRNA and protein expression was significantly higher in the case group when compared with the control group; whereas FoxP3 mRNA and protein expression was significantly lower in the active RA patients as compared with the inactive RA patients and the controls, which showed consistent results with the detection of Th17 and Treg cells. We then supposed that the altered expression of RORγt and FoxP3 might be a novel mechanism for the imbalance of Th17/Treg cells.
Our study showed that in Th17 cells, the miR-16 expression in the inactive RA patients was significantly higher than that in the controls, but lower than that in the active ones (both p < 0.05). In Treg cells, however, the miR-16 expression in the inactive RA patients was significantly lower than that in the controls, but higher than that in the active ones (both p < 0.05). In addition, the miR-16 expression in Th17 cells was significantly higher than that in Treg cells in both the active and inactive RA patients. Commonly, no specific drugs can be used for RA treatment because of the atypical symptoms; hence, the early diagnosis is particularly important for RA patients.
miR-16, located in chromosome 13q14, functions as a suppressor gene and may inhibit cell proliferation and invasion while inducing cell apoptosis by regulating the expression of Bcl-2 (Cimmino et al., 2005; Hao et al., 2011). It has also been demonstrated that specific changes of miR-16 not only contribute to the early diagnosis of RA but also provide a new direction for exploring and explaining RA pathogenesis based on the genetic levels (Jing et al., 2005). Filkova et al. (2014) demonstrated that the low level of miR-16 may represent the early phase of RA. According to Pauley et al. (2008), PBMCs from RA patients exhibit statistically significant upregulated miR-16 expression compared with healthy individuals, and the expression level of miR-16 was positively related with RA activity.
The data indicate that miR-16 may be a biological marker of RA activity, and the detection of miR-16 expression level in T cells may act as a potential method for the early diagnosis and for monitoring the development of RA. miR-16 was reported to be able to target 3′-UTR of TNF-α, which is a key pro-inflammatory mediator in RA, and, thus, miR-16 may possibly regulate the TNF-α signaling (Churov et al., 2015).
The proinflammatory cytokine TNF-α is a kind of an inflammatory mediator by whose stimulation matrix-degrading enzymes are produced by articular chondrocytes; through producing TNF-α, synoviocytes and synovial macrophages contribute to the destruction and degeneration of the extracellular matrix of cartilage (Wang et al., 2012b). TNF-α, therefore, plays a significant part in the pathogenesis of RA and inclines to cause joint destruction, which is a diagnostic signal of the disease (Castro-Villegas et al., 2015).
As a Th17-related cytokine, TNF-α was determined in our study by using flow cytometry and expectedly, its secretion level was significantly higher in the case group than in the control group, which fundamentally accords with the detection results of Th17/Treg cell ratio and miR-16 expression. We suspected that miR-16 expression may regulate the Th17/Treg cell ratio by targeting 3′-UTR of TNF-α. It has been reported that TNF-α can induce Th17 cells, selectively activate Treg cells, leading to their proliferation and upregulation of FoxP3 expression, and contribute to their suppressive activity (Wilson et al., 2007; Chen and Oppenheim, 2010). Our study indicated that upregulated miR-16 might positively regulate TNF-α secretion, which results in the imbalance of Th17/Treg cells by inducing the proliferation of Th17 cells and the suppressive development of Treg cells.
In addition, we found in the study that miR-16 expression in Th17 cells was positively related with RORγt mRNA expression, and that in Treg cells this was positively related with FoxP3 mRNA expression. We had an assumption that miR-16 might be involved in the upregulation of RORγt and the downregulation of FoxP3, which finally lead to the imbalance of Th17/Treg cells. For this possibly controversial speculation, we would perform further studies for validation if time and funds permit.
Our study is significant, because it tried to figure out not only the diagnostic potential of miR-16 expression and Th17/Treg cell imbalance in RA patients but also the correlation between the two. The study has also limitations to be noted. First, the expression levels of miR-16, miR-132, miR-146, and miR-155 in PBMCs in RA patients have been reported to be higher than those in healthy controls (Pauley et al., 2008).
However, due to the limited funds and time, we failed to detect the expression levels of other miRNAs in RA patients, and we only analyzed miR-16 expression in RA; correlations between other miRNAs and Th17/Treg cell ratio or other related cells need to be further investigated. Second, further studies on the functional role of miR-16 based on a larger sample size are demanded for validation. Moreover, specific studies on the mechanism of the increase and decrease, respectively, of transcription factors RORγt and FoxP3 are still required.
In conclusion, the expression of miR-16 in Th17 and Treg cells of PBMCs in RA patients was closely associated with the expression of RORγt and FoxP3. MiR-16 may be involved in Th17/Treg imbalance of RA patients by affecting the expression of RORγt and FoxP3. Further, the possible mechanism of miR-16 regulating RORγt and FoxP3 in Th17/Treg imbalance needs further investigation in further studies.
Footnotes
Acknowledgments
This study was supported by a grant from the National Natural Science Foundation of China (No. 81273709, 81473635, 81503506) and the Doctoral Fund of Ministry of Education of China (No. 20131210110003). The authors acknowledge the helpful comments on this article received from their reviewers.
Disclosure Statement
No competing financial interests exist.