




Abstract
Cisplatin [cis-dichlorodiammine platinum (II), CDDP], morphine (Mor), and electromagnetic field (EMF) induced oxidative stress. In this study, we tried to increase the cytotoxicity of CDDP in combination with Mor and/or EMF in MCF-7 and SH-SY5Y cells. Furthermore, we evaluate the expression levels of 11 antioxidant genes in both cell lines. We designed four treatments: CDDP alone, “CDDP+Mor,” “CDDP+EMF,” and “CDDP+Mor+EMF.” Serial dilutions of CDDP, Mor (5.0 μM), and EMF (50 Hz, 0.50 mT, “15 min field-on/15 min field-off”) were used for estimation of relative IC50 values. The mRNA expression levels of antioxidant genes were determined by real-time PCR. The IC50 value of CDDP in “CDDP+Mor+EMF” treatment was significantly higher than CDDP alone and “CDDP+Mor” treatments in both cell lines. Whereas the expression levels of antioxidant genes in the four treatments showed similar patterns in MCF-7 cells, in SH-SY5Y cells, most of the antioxidant genes showed an upregulation with “CDDP+EMF” and “CDDP+Mor+EMF” treatments. Moreover, significant differences in the number of upregulated genes were observed between different treatments in SH-SY5Y cells. The molecular mechanism of CDDP-reduced cytotoxicity in our designed combinations is probably different in MCF-7 and SH-SY5Y cells. CDDP in combination with EMF could protect SH-SY5Y cells from the cytotoxicity, whereas it has no significant change in MCF-7 cells.
Introduction
C
Morphine (Mor) is usually administrated as the most effective pain-relieving medication for cancer patients (Flemming, 2010). Extremely low-frequency (<300 Hz) electromagnetic fields (EMFs), which are abundant in our environment, could affect cells (Hardell and Sage, 2008). Both Mor (Skrabalova et al., 2013) and EMF (Montoya, 2017) are able to produce ROS and induce significant changes in the mRNA expression levels of several antioxidant genes
Since, CDDP, Mor, and EMF were associated with the generation of ROS and subsequently causing oxidative stress, the aim of the present study was to evaluate the effects of CDDP in combination with Mor and/or EMF on cell growth inhibition and expression levels of several antioxidant genes in human MCF-7 and SH-SY5Y cells. Previous studies indicated that EMF (Mahmoudinasab and Saadat, 2016; Mahmoudinasab et al., 2016) and Mor (Saify et al., 2016) altered the expression levels of NQO1, NQO2, SOD1, SOD2, CAT, GSTM3, GSTO1, MGST1, MSGT3, and GSTP1 genes and the polymorphisms of the GSTP1, GSTO1, and NQO1 were significantly associated with the risk of breast cancer (Peng et al., 2014; Xu et al., 2014; Kuang et al., 2016). Therefore, we selected these genes for our investigation in the present work.
Materials and Methods
EMF exposure system
The device producing EMF was a self-made solenoid. It was composed of a cylindrical tube (inner diameter: 14 cm; length: 44 cm), around which 2000 turns of 1 mm diameter copper wire were wound. It was used to generate a sinusoidal magnetic field with the frequency of 50 Hz and the intensity of 0.50 ± 0.01 mT.
To avoid any disturbing EMF exposure from surroundings, the solenoid was placed horizontally in a box shielded with two layers of aluminum and one layer of copper sheets. The current needed for producing 0.50 mT magnetic field in the center of the solenoid was calculated by B = μ0NI/L formula, where B represents the magnetic field intensity (T), μ0 is the vacuum permeability and equals to 4π × 10−7 (N/A2), N is the number of turns, I is the current (A), and L is the solenoid length (m). The current and voltage required to generate 0.50 mT magnetic field intensity were provided by an alternating current electric rotary converter (TDGC2-2KVA; Zhejiang, Yueqi-ng, China) and a digital ampere meter showed the current.
The magnetic field accuracy in the center of the solenoid was checked by means of a digital Teslameter model EMF-827 (Lutron electronic enterprise, Taipei, Taiwan). The background local geomagnetic field was ∼45 μT. In each experiment, one 10-cm culture Petri dish was placed horizontally in the central region of the solenoid from 15 to 29 cm, where a uniform 0.50 mT magnetic field was confirmed by a magnetic field simulation program (Vizimag 3.185; SoftNewsNet s.r.l., Bucharest, Romania). A thermometer was used in a preliminary experiment and that showed no significant changes in the temperature of the solenoid during our designed EMF exposure condition.
Cell culture, drug preparations, and treatment protocols
Cell culture conditions of human MCF-7 and SH-SY5Y cells were described in our previous study (Sanie-Jahromi et al., 2016). Both CDDP (Santa Cruz Biotechnology, Inc., SantaCruz, CA) and morphine hydrochloride trihydrate (C17H2OClNO3 3H2O; LGC standards, Teddington, UK) were dissolved in distilled water. Fresh CDDP solution and Mor (10 mM stock) were diluted to the desired concentration in complete medium immediately before each experiment.
The final concentration of CDDP was ∼1/2 IC50 (15 and 4 μg/mL in MCF-7 and SH-SY5Y cells, respectively) and the final concentration of Mor was 5.0 μM. In “CDDP+Mor” treatment, both drugs were added to cells simultaneously. In “CDDP+EMF” and “CDDP+Mor+EMF” treatments, drugs were added to cells and then cells were exposed to EMF. Controls for EMF combined treatments were kept inside the not-energized coil without EMF exposure (real sham). Total RNA was extracted after 24 h.
IC50 calculation
The relative IC50 values (the concentration that reduced cell survival by 50% of the maximum effect) of CDDP alone, “CDDP+Mor,” “CDDP+EMF,” and “CDDP+Mor +EMF” treatments were measured by methylthiazol tetrazolium assay (Roche, Mannheim, Germany) after 24 h. To estimate the relative IC50 different concentrations of CDDP were used (final concentrations of 2.5–100 μg/mL) (Fig. 1A). Each concentration was tested in triplicate. The relative IC50 was estimated by fitting a four-parameter logistic curve (Sebaugh, 2011) using GraphPad Prism® software version 6.07 (GraphPad software, San Diego, CA).
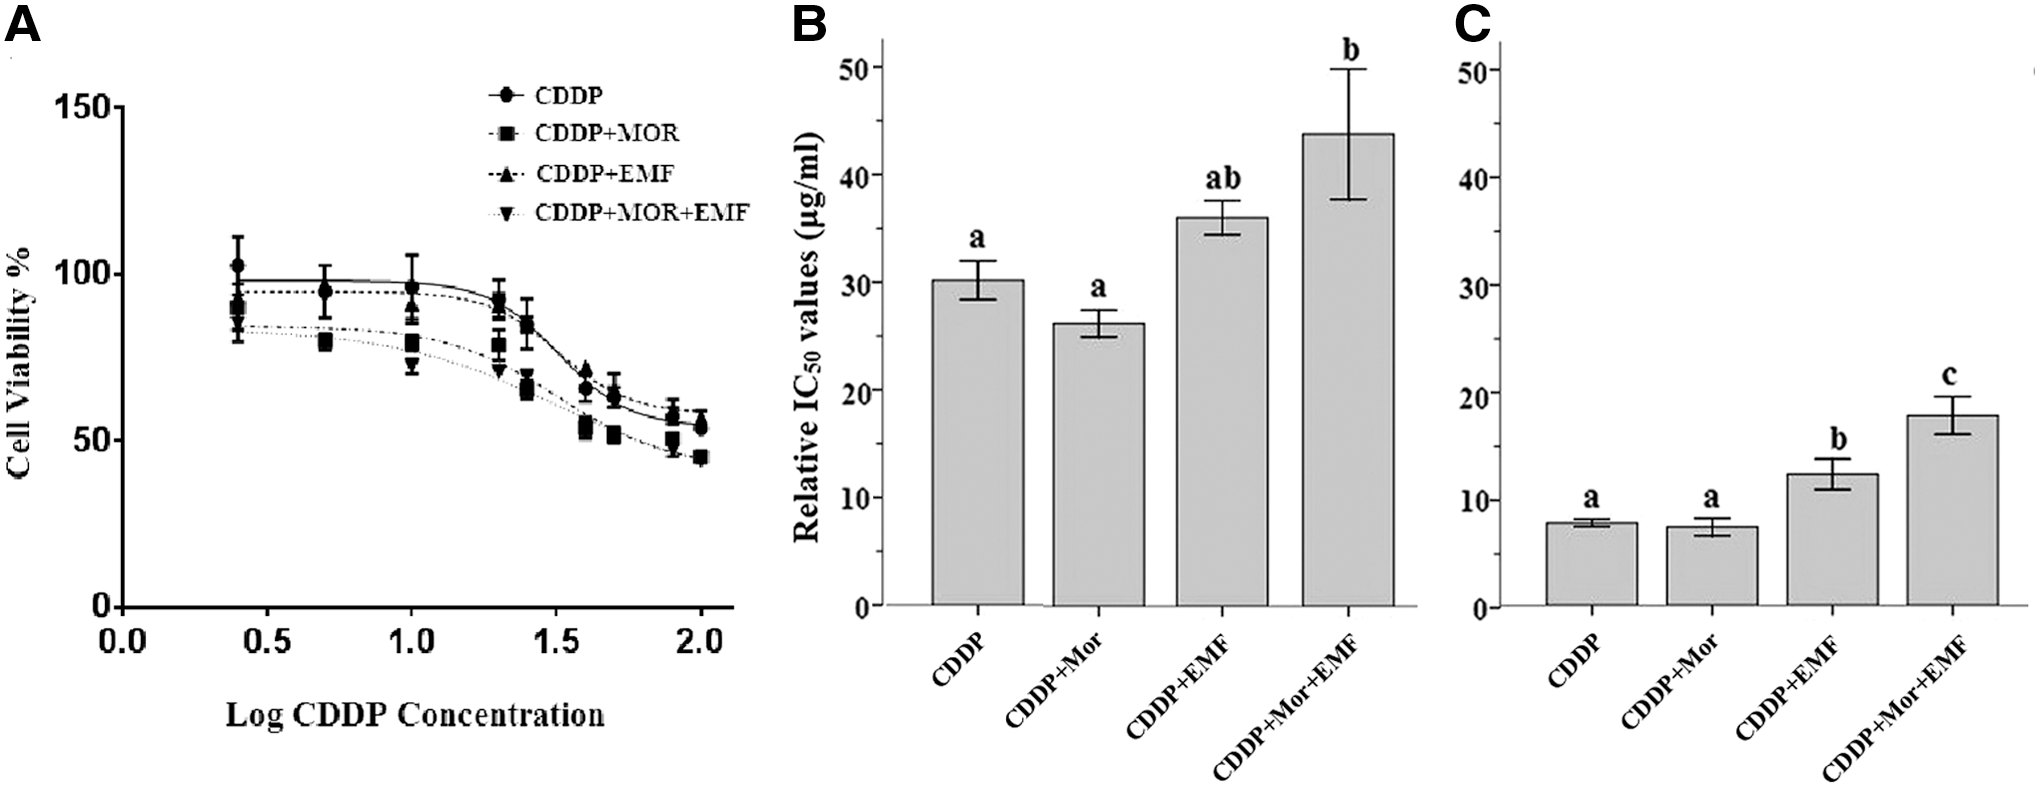
Concentration–response curves of CDDP, “CDDP+Mor,” “CDDP+EMF,” and “CDDP+Mor+EMF” in MCF-7 cells
RNA extraction, cDNA synthesis, and real-time PCR
RNA extraction, cDNA synthesis, and quantitative real-time PCR were carried out as described previously (Mahmoudinasab et al., 2016). cDNA-specific primers for the examined genes were reported previously (Saify and Saadat, 2015; Mahmoudinasab et al., 2016). Relative mRNA expression levels were calculated according to the 2−ΔΔCt method based on the threshold cycle (Ct) values.
We failed to investigate the alterations of GSTT1 and GSTM1 in both cell lines
Statistical analysis
All experiments were done in three independent replicates. Data are presented as mean ± standard error. The differences between all treatments were evaluated using factorial analysis of variance (ANOVA) followed by LSD post hoc test using SPSS Statistical Package 16 (SPSS, Inc., Chicago, IL). One-way ANOVA was used for comparing the mRNA expression levels of the GSTM2 and GSTP1 in SH-SY5Y cells and also comparing the relative IC50 values. A chi-square test was used for comparison between the numbers of upregulated genes in treatments. A probability of p < 0.05 was considered statistically significant.
Results
To evaluate the cell growth inhibition of CDDP in combination with Mor and/or EMF, the relative IC50 values of CDDP in combination with Mor, EMF, and “Mor+EMF” were estimated and compared with each other. The relative IC50 values of CDDP for treatments of CDDP alone, “CDDP+Mor,” “CDDP+EMF,” and “CDDP+Mor+EMF” were estimated at 30.1 ± 1.8, 26.2 ± 1.2, 36.1 ± 1.5, and 43.8 ± 6.0 μg/mL, respectively, in MCF-7 cells (Fig. 1B) and 7.6 ± 0.3, 7.3 ± 0.8, 12.2 ± 1.4, and 17.7 ± 1.7 μg/mL, respectively, in SH-SY5Y cells (Fig. 1C). Statistical analysis revealed that the IC50 value of “CDDP+Mor+EMF” treatment was significantly higher than the other treatments in MCF-7 cells (F = 5.34; df = 3, 8; p = 0.026) and SH-SY5Y cells (F = 16.06; df = 3, 8; p = 0.001).
The mRNA alterations of antioxidant genes in MCF-7 cells (Fig. 2) and SH-SY5Y cells (Fig. 3) were determined under the treatment conditions mentioned above. Factorial ANOVA revealed that cell types, treatment conditions, and their interactions had significant effects on the mRNA expression levels of examined genes. The most important findings in MCF-7 cells were:

Relative antioxidant genes' mRNA levels in MCF-7 cells in various combinations of cisplatin (CDDP, 15 μg/mL), EMF (50 Hz, 0.50 mT, “15 min field-on/15 min field-off”), and morphine (Mor, 5.0 μM) (n = 3, mean ± SE). *p < 0.05 the differences between all treatments were evaluated using factorial ANOVA followed by LSD post hoc test. ANOVA, analysis of variance.
(1) LSD post hoc test revealed that the mRNA expression levels of five genes CAT, GSTM3, MGST1, MGST3, and NQO2 reduced significantly in all four treatments.
(2) There was no elevation in the mRNA expression levels of the examined genes under experimental conditions, except for NQO1 in the “CDDP+Mor+EMF” treatment.
(3) Gene expression patterns of examined antioxidant genes in MCF-7 cells among four exposure conditions did not change significantly.
The most important findings in the SH-SY5Y cells were: (1) Altogether, the mRNA expression levels of the examined genes significantly increased in 22 cases and decreased in 7 cases (Fig. 3). This difference was significant (χ
2 = 7.68, df = 2, p = 0.021). Therefore, it seems that mRNA expression levels of examined genes in the designed treatment conditions in SH-SY5Y cells were more often upregulated. (2) When the cells treated with “CDDP+EMF,” the mRNA expression levels of 10 genes (out of 11) were upregulated (χ
2 = 7.35, df = 1, p = 0.007). (3) Statistical analysis showed significant differences between different treatments in relation to the number of upregulated genes (χ
2 = 14.9, df = 3, p = 0.002).
In “CDDP+EMF” and “CDDP+Mor+EMF” treatments, alterations of the mRNA expression levels of the examined genes in SH-SY5Y and MCF-7 cells were in agreement in 2 cases and disagreement in 16 other cases. In the other 2 treatments, there were 10 agreement and 8 disagreement cases. The disparity of agreement and disagreement cases between the two EMF-containing treatments (“CDDP+EMF” and “CDDP+Mor+EMF”) and the other two treatments (CDDP alone, and “CDDP+Mor”) was significant (χ 2 = 8.00, df = 1, p = 0.005). This indicates that MCF-7 and SH-SY5Y cells demonstrated significantly different expression patterns of examined genes.
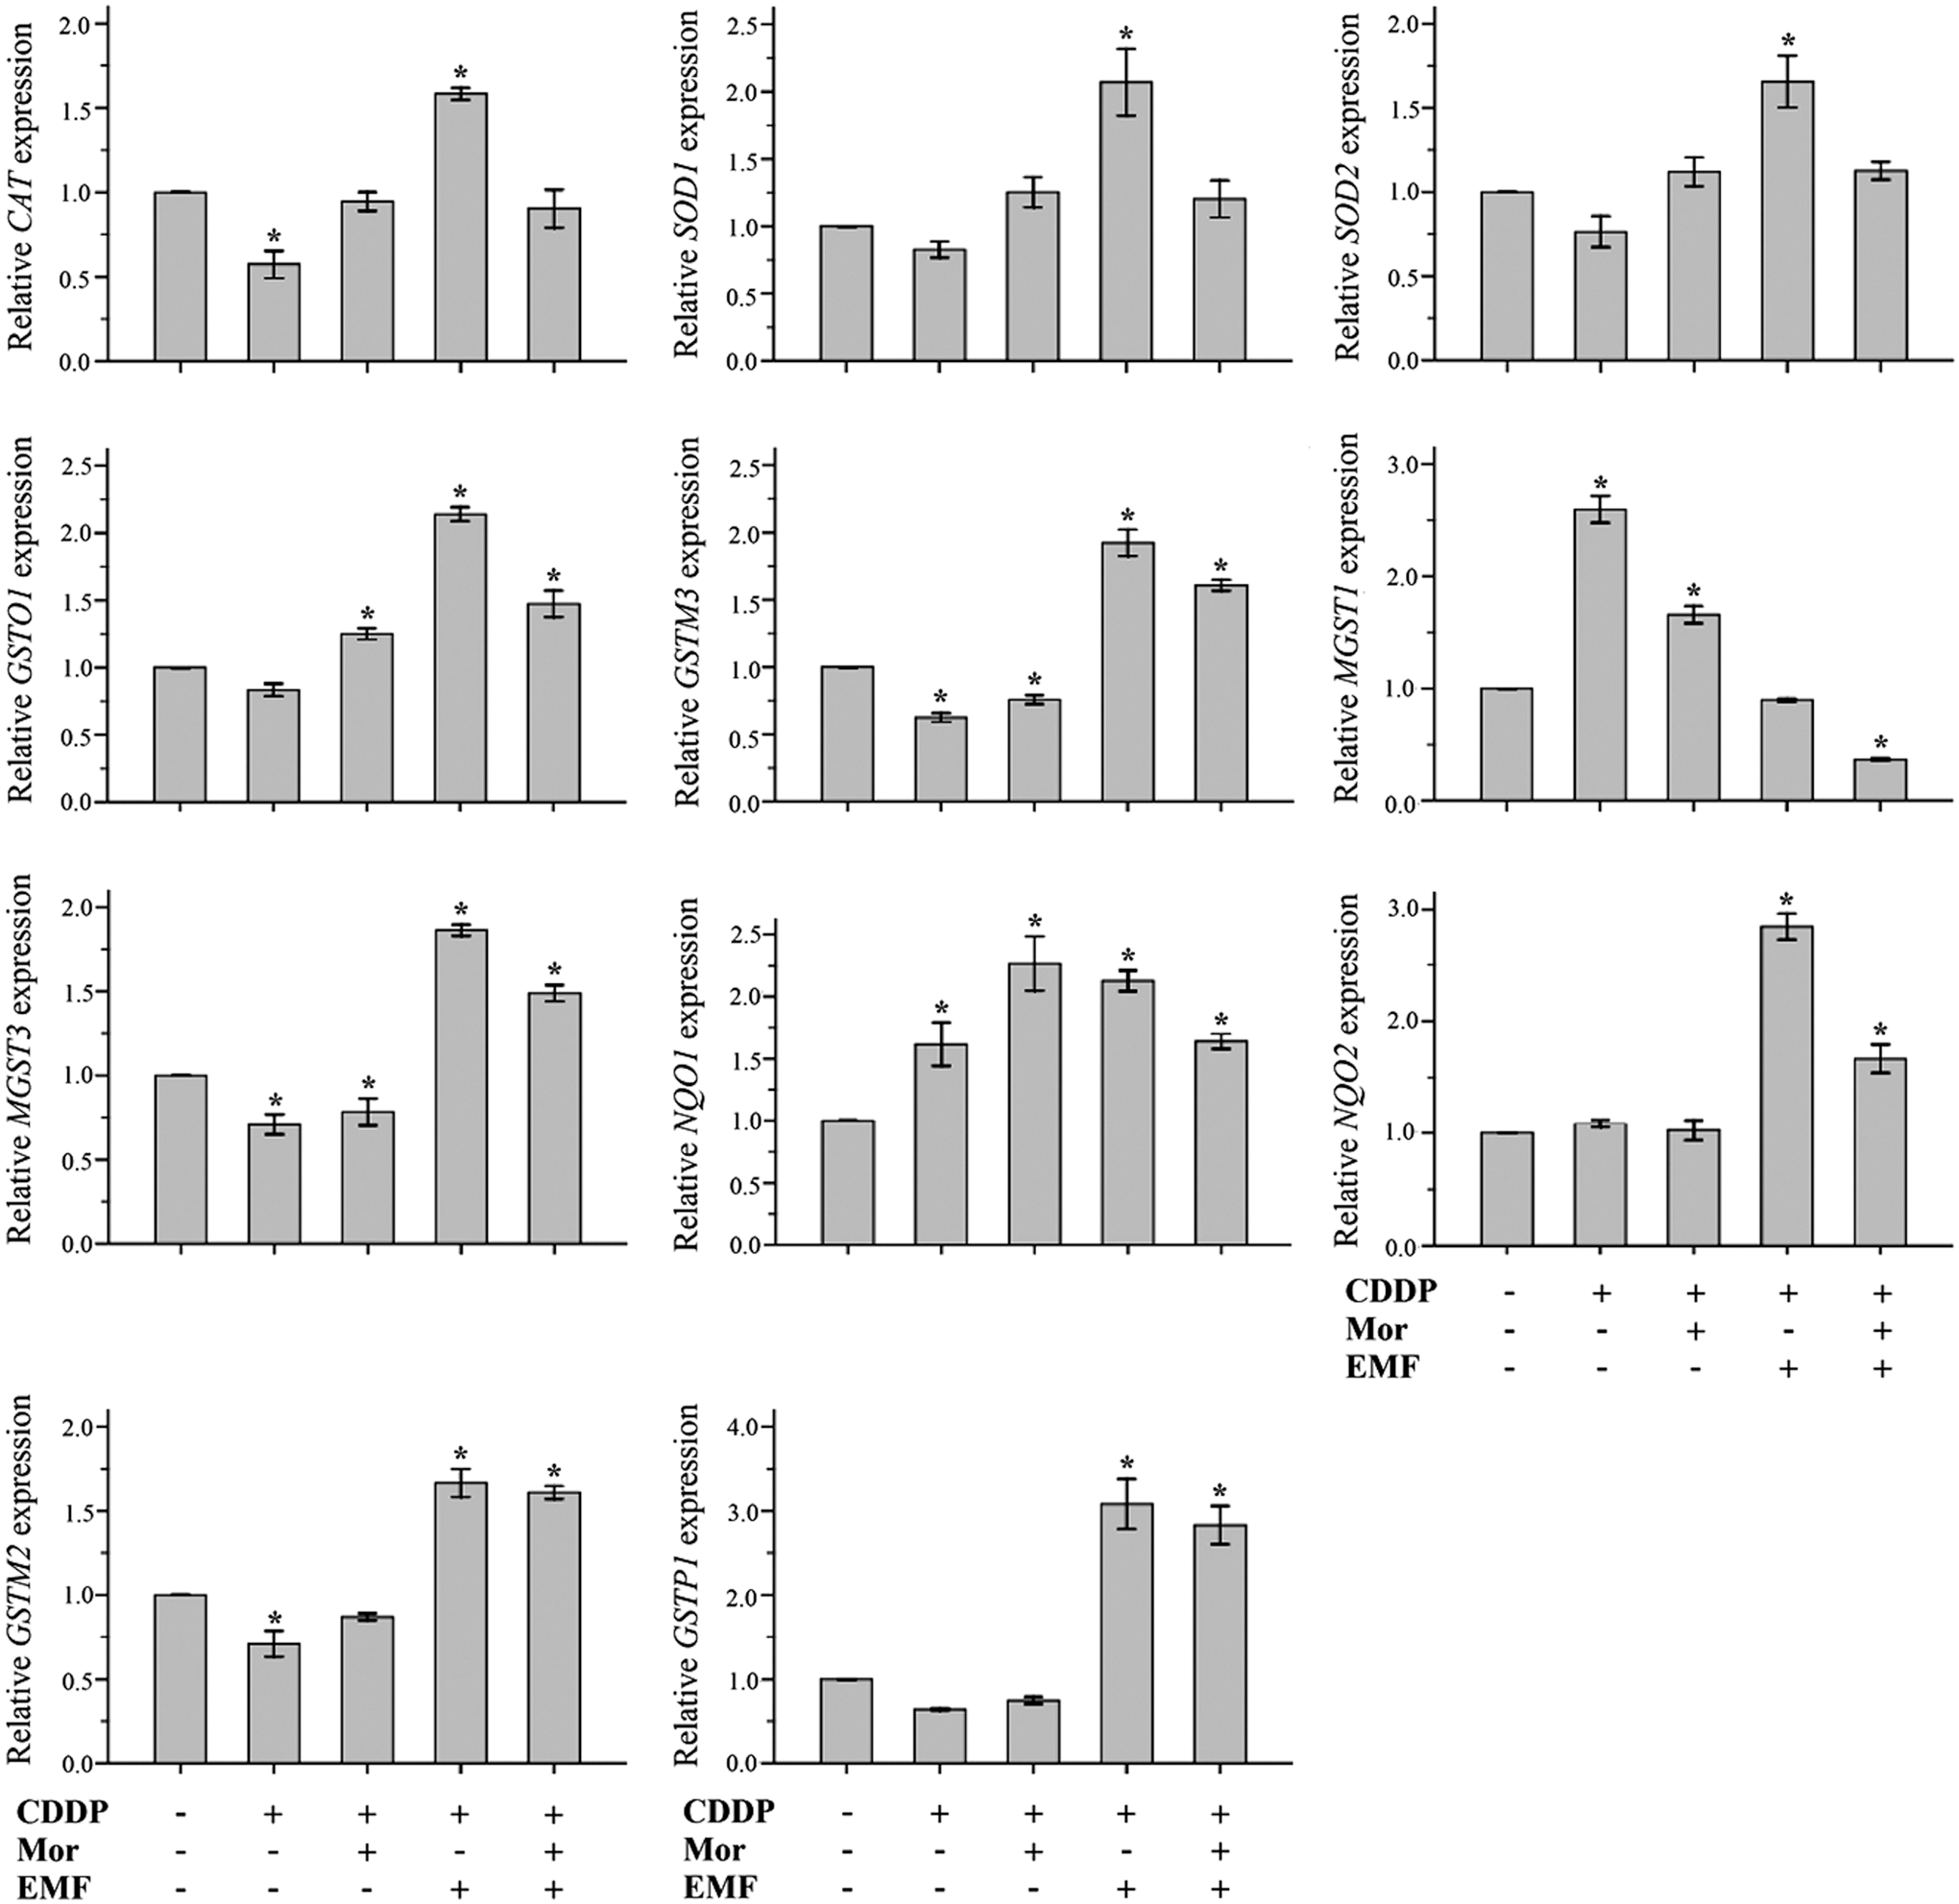
Relative antioxidant genes' mRNA levels in SH-SY5Y cells in various combinations of cisplatin (CDDP, 4 μg/mL), EMF (50 Hz, 0.50 mT, “15 min field-on/15 min field-off”), and morphine (Mor, 5.0 μM) (n = 3, mean ± SE). *p < 0.05 all values compared with untreated controls ( = 1) using factorial ANOVA followed by LSD post hoc test.
Discussion
Conventional cancer therapies, such as chemotherapy and radiotherapy, produce more ROS inside cancer cells with higher inner ROS compared with the normal cells. One strategy in ROS-based combination therapy is to use several ROS-producing agents to produce more ROS with fewer side effects (Hileman et al., 2004; Gupta et al., 2012; Gorrini et al., 2013). Since CDDP (Boulikas and Vougiouka, 2003), Mor (Skrabalova et al., 2013), and EMF (Montoya, 2017) are ROS-producing agents, and we hypothesized that their combination (two chemical and one physical agents) may cause more cytotoxicity compared with CDDP alone. Therefore, four treatments were designed: CDDP alone and combinations of CDDP with Mor, EMF, and “Mor+EMF.”
The relative IC50 values of combined treatments showed that the cytotoxicity of CDDP in “CDDP+Mor+EMF” treatment was less than CDDP alone and “CDDP+Mor” treatments in both cell lines. These findings did not confirm our prior hypothesis. This means that the cytotoxic effects of CDDP, Mor, and EMF due to ROS did not additively accumulate. The cytotoxicity of CDDP did not alter in combination with EMF treatment in MCF-7 cells; however, its cytotoxicity significantly decreased in SH-SY5Y cells. It is worthy to note that, statistical analysis showed significant increase in the IC50 of CDDP in “CDDP+Mor+EMF” treatments in both cell lines. Its increase is about 1.45- and 2.30-folds of CDDP alone in MCF-7 and SH-SY5Y cells, respectively.
We evaluated the association between cell toxicity and mRNA expression levels of antioxidant genes, in both cell lines under the abovementioned treatment conditions. In MCF-7 cells, there is just one significant elevation in the mRNA expression levels of the examined genes in all treatments (Fig. 2). Therefore, it might be concluded that the reduction in the cytotoxicity of CDDP in “CDDP+Mor+EMF” treatment was not due to the alteration in the expressions of the examined antioxidant genes. However, in the SH-SY5Y cells treated with “CDDP+EMF” and “CDDP+Mor+EMF,” the number of upregulated antioxidant genes increased significantly compared with CDDP alone and “CDDP+Mor” treatments (Fig. 3). It seems that, at least in part, the upregulation of antioxidant genes in these two treatments causes more scavenging of produced ROS and protects cells from the cytotoxicity of ROS in SH-SY5Y cells. Downregulation in the mRNA expression levels of some antioxidant genes, such as CAT and GSTM3, has been reported previously (Saify et al., 2016), when SH-SY5Y cells were treated with morphine. However, when these cells were treated with “CDDP+Mor” or “CDDP+Mor+EMF” the CAT and GSTM3 expression levels were significantly increased (Fig. 3). These findings indicate that the effects of CDDP, Mor, and EMF on mRNA expression levels did not additively accumulate.
CDDP in combination with EMF could protect SH-SY5Y cells from the cytotoxicity, whereas it has no significant effect on MCF-7 cells. It should be noted that neurotoxicity is one of the most important side effects of CDDP
Finally, it is invaluable to note that in the SH-SY5Y cells, the mRNA expression levels of 9 (out of 11) examined genes were significantly decreased in the “CDDP+Mor+EMF” treatment compared with the “CDDP+EMF” treatment (Fig. 3). It means that Mor may reduce the EMF-related antioxidative transcriptional response to CDDP. If the similar finding could be demonstrated in differentiated SH-SY5Y cells, it might be suggested that cotreatment of EMF and CDDP in breast cancer patients who probably receive Mor treatment as well, could impair the antioxidant capacity of neuronal cells.
Footnotes
Acknowledgment
This study was supported by Shiraz University, Iran (grant number 93GCU2-M1741).
Disclosure Statement
No competing financial interests exist.