
Abstract
Epithelial mesenchyme transformation (EMT) of the medial edge epithelium (MEE) is the crucial process during palatal fusion. This work is aimed to elucidate the enhancer regulatory mechanism by genome-wide DNA methylation analysis of EMT during palatal fusion. Over 800 million clean reads, 325 million enzyme reads, and 234 million mapping reads were generated. The mapping rate was 68.85–74.32%, which included differentially methylated 17299 CCGG sites and 2363 CCWGG sites (p < 0.05, log2FC >1). Methylated sites in intron and intergenic regions were more compared to other regions of all DNA elements. GO and KEGG analysis indicated that differential methylation sites related to embryonic palatal fusion genes (HDAC4, TCF7L2, and PDGFRB) at the enhancer were located on CCWGG region of non-CpG islands. In addition, the results showed that the enhancer for HDAC4 was hypermethylated, whereas the enhancers for TCF7L2 and PDGFRB were hypomethylated. The methylation status of enhancer regions of HDAC4, PDGFRB, and TCF7L2, involved in the regulation of the EMT during palatal fusion, may enlighten the development of novel epigenetic biomarkers in the treatment of cleft palate.
Introduction
C
DNA methylation that occurs at the C5 position of cytosine within CpG and non-CpG (CpA, CpC, and CpT) in the genome is regarded as a critical component of epigenetic regulation (Barres et al., 2009; Law and Jacobsen, 2010). Moreover, DNA methylation plays a crucial role in many biological processes, such as embryogenesis, cellular differentiation, X-chromosome inactivation, genomic imprinting, and transposon silencing (Jaenisch and Bird, 2003; Levin and Moran, 2011; Peters, 2014), and has attracted attention because of its wide range of action, reversibility, and genetic characteristics. Methylation of CpG islands in gene promoter regions correlates with transcriptional silencing (Caiafa and Zampieri, 2005), by either inhibition of transcription factor binding (Geiman and Robertson, 2002) or interaction of methyl-CpG binding proteins associated with transcriptional repression (Deaton and Bird, 2011). Recent studies showed that methylation of CpG islands within the enhancer regions greatly influenced malignant transformation and progression (Aran and Hellman, 2013; Aran et al., 2013), which suggests that enhancers of CP-related genes (HDAC4, TCF7L2, and PDGFRB) in embryonic mice may be a new clue to epigenetic markers. However, patterns of methylation of CpG islands within the enhancer regions of genes underlying palate development, and their contribution to CP are still unclear. Moreover, identifying genes whose enhancers undergo differential methylation during palate development would be a significant step toward predicting and deciphering the pathogenesis of CP. Our work aims to elucidate the differentially methylated enhancers and regulatory mechanisms of EMT during palatal fusion by genome-wide DNA methylation analysis.
Although most of the epigenetic markers are involved in methylation of target promoter regions, more and more evidence suggests that methylation in enhancer regions correlates better with target gene expression than promoter methylation (Aran et al., 2013). Enhancers are 20-400 bp DNA sequences, located in CpG islands or non-CpG islands, which combine with tissue-specific transcription factors and regulate gene transcription at distant loci through chromosome looping (Petrascheck et al., 2005). Enhancers of their activity can be highly tissue specific, and the tight interplay between active enhancers and binding of their specific transcription factors (Feldmann et al., 2013; Kieffer-Kwon et al., 2013) are intricately dependent on enhancer methylation (Saluz et al., 1986). Hypomethylated enhancers allow transcriptional activation of target genes. Conversely, hypermethylated enhancers usually result in the silencing of target genes (Shlyueva et al., 2014). Nevertheless, details on the enhancer methylation patterns of EMT during palatal fusion are very limited. To explore the mechanisms of CP development during palatal fusion, we sequenced the embryonic mouse palatal tissues (E14.5), using MethylRAD combined with high-throughput sequencing (HiSeq X Ten), and generated the first genome-wide DNA methylation profile of embryonic mouse palatal tissues. Simultaneously, we screened the enhancer methylation levels of genes associated with the formation of CP, and subjected the genes with differentially methylated sites to Gene Ontology (GO) and KEGG pathway enrichment analysis.
HDAC4 has a central role in the formation of the skeleton (Vega et al., 2004), and controls the development of the palatal skeleton (Haberland et al., 2009). Hypermethylated HDAC4 can inhibit gene expression and transcription factor binding to target DNA during palatal fusion, and may lead to the formation of CP. TCF7L2 overexpression can inhibit EMT and palatal fusion. PDGFRA and PDGFRB interaction during palatogenesis in both zebra fish and mice had affected proper condensation of maxillary neural crest cells during palate formation (McCarthy et al., 2016). Hypomethylated PDGFRB can promote PDGFRB overexpression and inhibition of EMT during palatal fusion, contributing CP formation. These findings illustrated that HDAC4, TCF7L2, and PDGFRB are the candidate genes associated with palate development, and any abnormal expression of HDAC4, TCF7L2, and PDGFRB may lead to CP during palatal shelve fusion.
Subjects and Methods
Ethics, animals, and treatment
This study was approved by The Animal Ethics Committee of Shantou University Medical College (Guangdong, China). C57BL/6J mice were purchased from the Beijing Vital River Laboratory Animal Technology Co. Ltd. (Beijing, China), and were housed in the animal experimental center of Shantou University Medical College. Females were mated with fertile males overnight with similar weight and ages, and the embryonic day 0.5 (E0.5) was designated at 8 AM of the next day when a vaginal plug was found. Pregnant females at E10.5 were randomly divided into two groups. The case group was administered with at-RA (Sigma-Aldrich, MO) that was dissolved in corn oil, using gavage at 70 mg/kg, whereas the control group was given the equivalent volume of corn oil according to their weight. C57BL/6J mice at E14.5 were killed and palatal shelves were dissected using microbiological instruments. The palatal shelves were immediately frozen in liquid nitrogen and then kept at −80°C for further research.
MethylRAD library preparation and sequencing
Genomic DNA was extracted from embryonic mouse palatal shelves using the conventional cetyltrimethylammonium (cetrimonium) bromide (CTAB) method, and the genomic library was prepared using MethylRAD (in presence of an activator; D = A or G or T; S = C or G) (Cohen-Karni et al., 2011; Wang et al., 2015). Base quality values were calculated using a Phred quality score (Q sanger = −10log10
p). Input sequencing data before operation and computing were called raw data or raw reads. After operation, the data, including adapter reads and low-quality sequences, were removed from raw reads as clean reads. The clean reads were then subjected to Pair-End sequencing on a HiSeq X Ten platform by the Shanghai Oebiotech Co. Ltd (Shanghai, China). To improve the accuracy in the follow-up analysis, Pear software (v0.9.6) (Zhang et al., 2014) was used to refilter pair-end sequencing paired clean reads according to the following terms: (i) remove low quality reads (more than 15% of base mass lower than 30) and (ii) remove sequences containing too many N bases (N containing more than 8%). After mapping of the paired-end sequencing reads, quality control was conducted. Finally, the MethylRAD sequence data were obtained while the labels without target enzyme sites were filtered and deleted based on each sample's location in the library. Base distribution and quality distribution maps of clean reads were plotted (Fig. 1). [Reference genome:

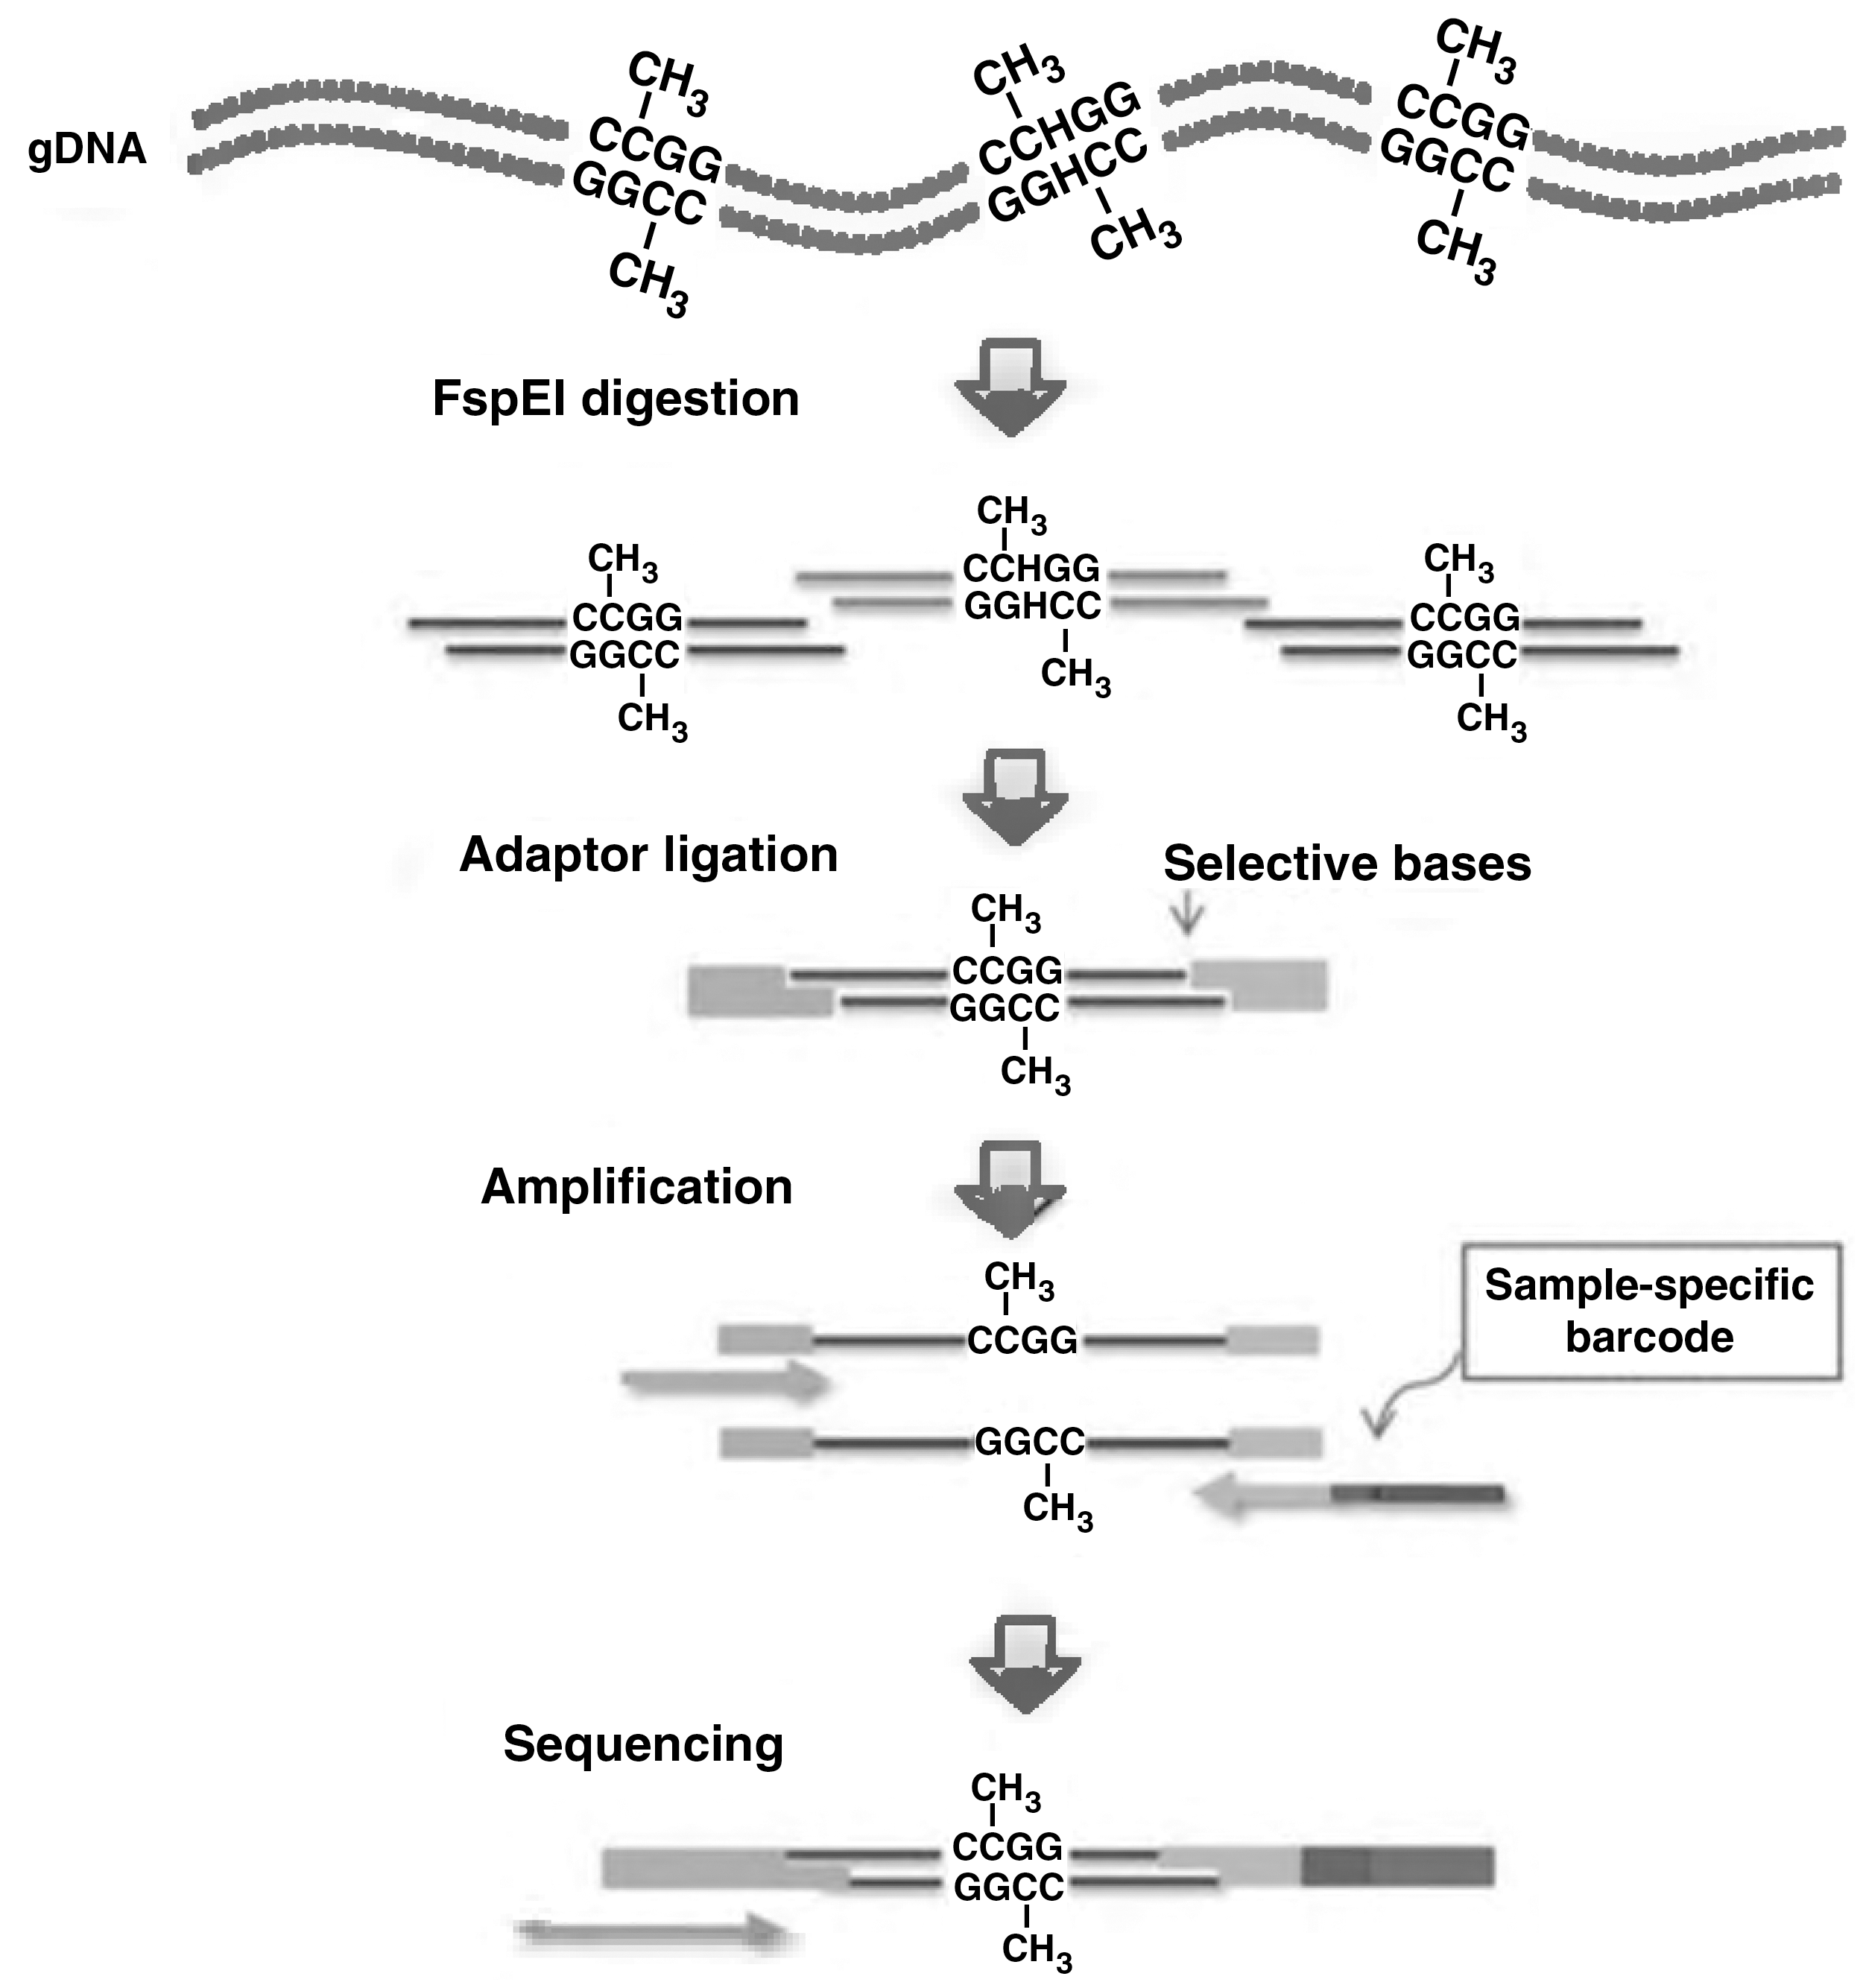
Schematic overview of the procedure for MethylRAD library preparation. Genomic DNA is digested with the restriction enzyme FspEI, producing 32-bp fragments, including four base 3’overhangs. Adaptors with compatible overhangs (NNNN) are ligated to each end of these fragments. Tag density can be adjusted using adaptors with selective overhangs (e.g., NNNG). The constructs are amplified and purified by gel extraction. Sample-specific barcodes are incorporated in each construct by PCR, and the products pooled for sequencing.
Distribution of DNA methylation sites
According to the genome sequence, a label containing CCGG/CCWGG sites was proposed as the reference sequence, and the individual enzyme reads were mapped to the reference sequence of the CCGG/CCWGG sites using the SOAP program (version 2.21, parameter: -M4-v2-r0) (Li et al., 2009). A reliable methylation site was determined by finding the sequencing depth of no less than 3 sites. Considering that there was a repetition region in the reference sequence, reads in the repetition region were simultaneously compared to a plurality of positions in the reference sequence. It was difficult to judge the actual position of the methylation site.
Using MethylRAD technology combined with high-throughput sequencing, the degree of methylation at a site could be determined by observing the sequencing depth of the methylation site. The density distribution map of methylation sites depicts the distribution density of CCGG/CCWGG sites and the actual detected methylation site density on each chromosome. Detecting the distribution of sites on the chromosome group using MethylRAD technology was more uniform. Moreover, by using the window sliding method to calculate the CCGG/CCWGG number on each window on the chromosome, the site distribution over the entire chromosome was described (Supplementary Fig. S1; Supplementary Data are available online at

Box plots showing the sequencing depths of the methylation sites (CCGG and CCWGG) in each sample (case (b1, b2, and b3) and control (B1, B2, and B3) embryonic palatal tissues). In the box chart, the box part is the main body of the box-shaped chart, and the middle of the black horizontal line is the median of the data; the upper and lower sides of the box is a quarter of the data that are greater than the upper quartile (Q3), and a quarter of the data are less than the lower quartile (Q1). The interval between Q1 and Q3 is called the interquartile range (IQR). The longitudinal lines in the upper and lower sides of the box are tentacle lines. The upper cutoff line of the tentacle line is “Q3 + 1.5 * IQR” and the lower one is “Q1-1.5 * IQR”.
The UTR region was calculated using snpEff software (version: 4.3p) (Cingolani et al., 2012), and was counted using bed tools software (v2.25.0) (Quinlan and Hall, 2010) according to the annotation document and the distribution of methylation sites in the different gene elements in each sample. The gene elements included the 3′UTR, 5′UTR, TSS2000, exon region, intron region, and intergenic region. The distribution of methylation sites on different functional elements of the genome is shown in Figure 4.
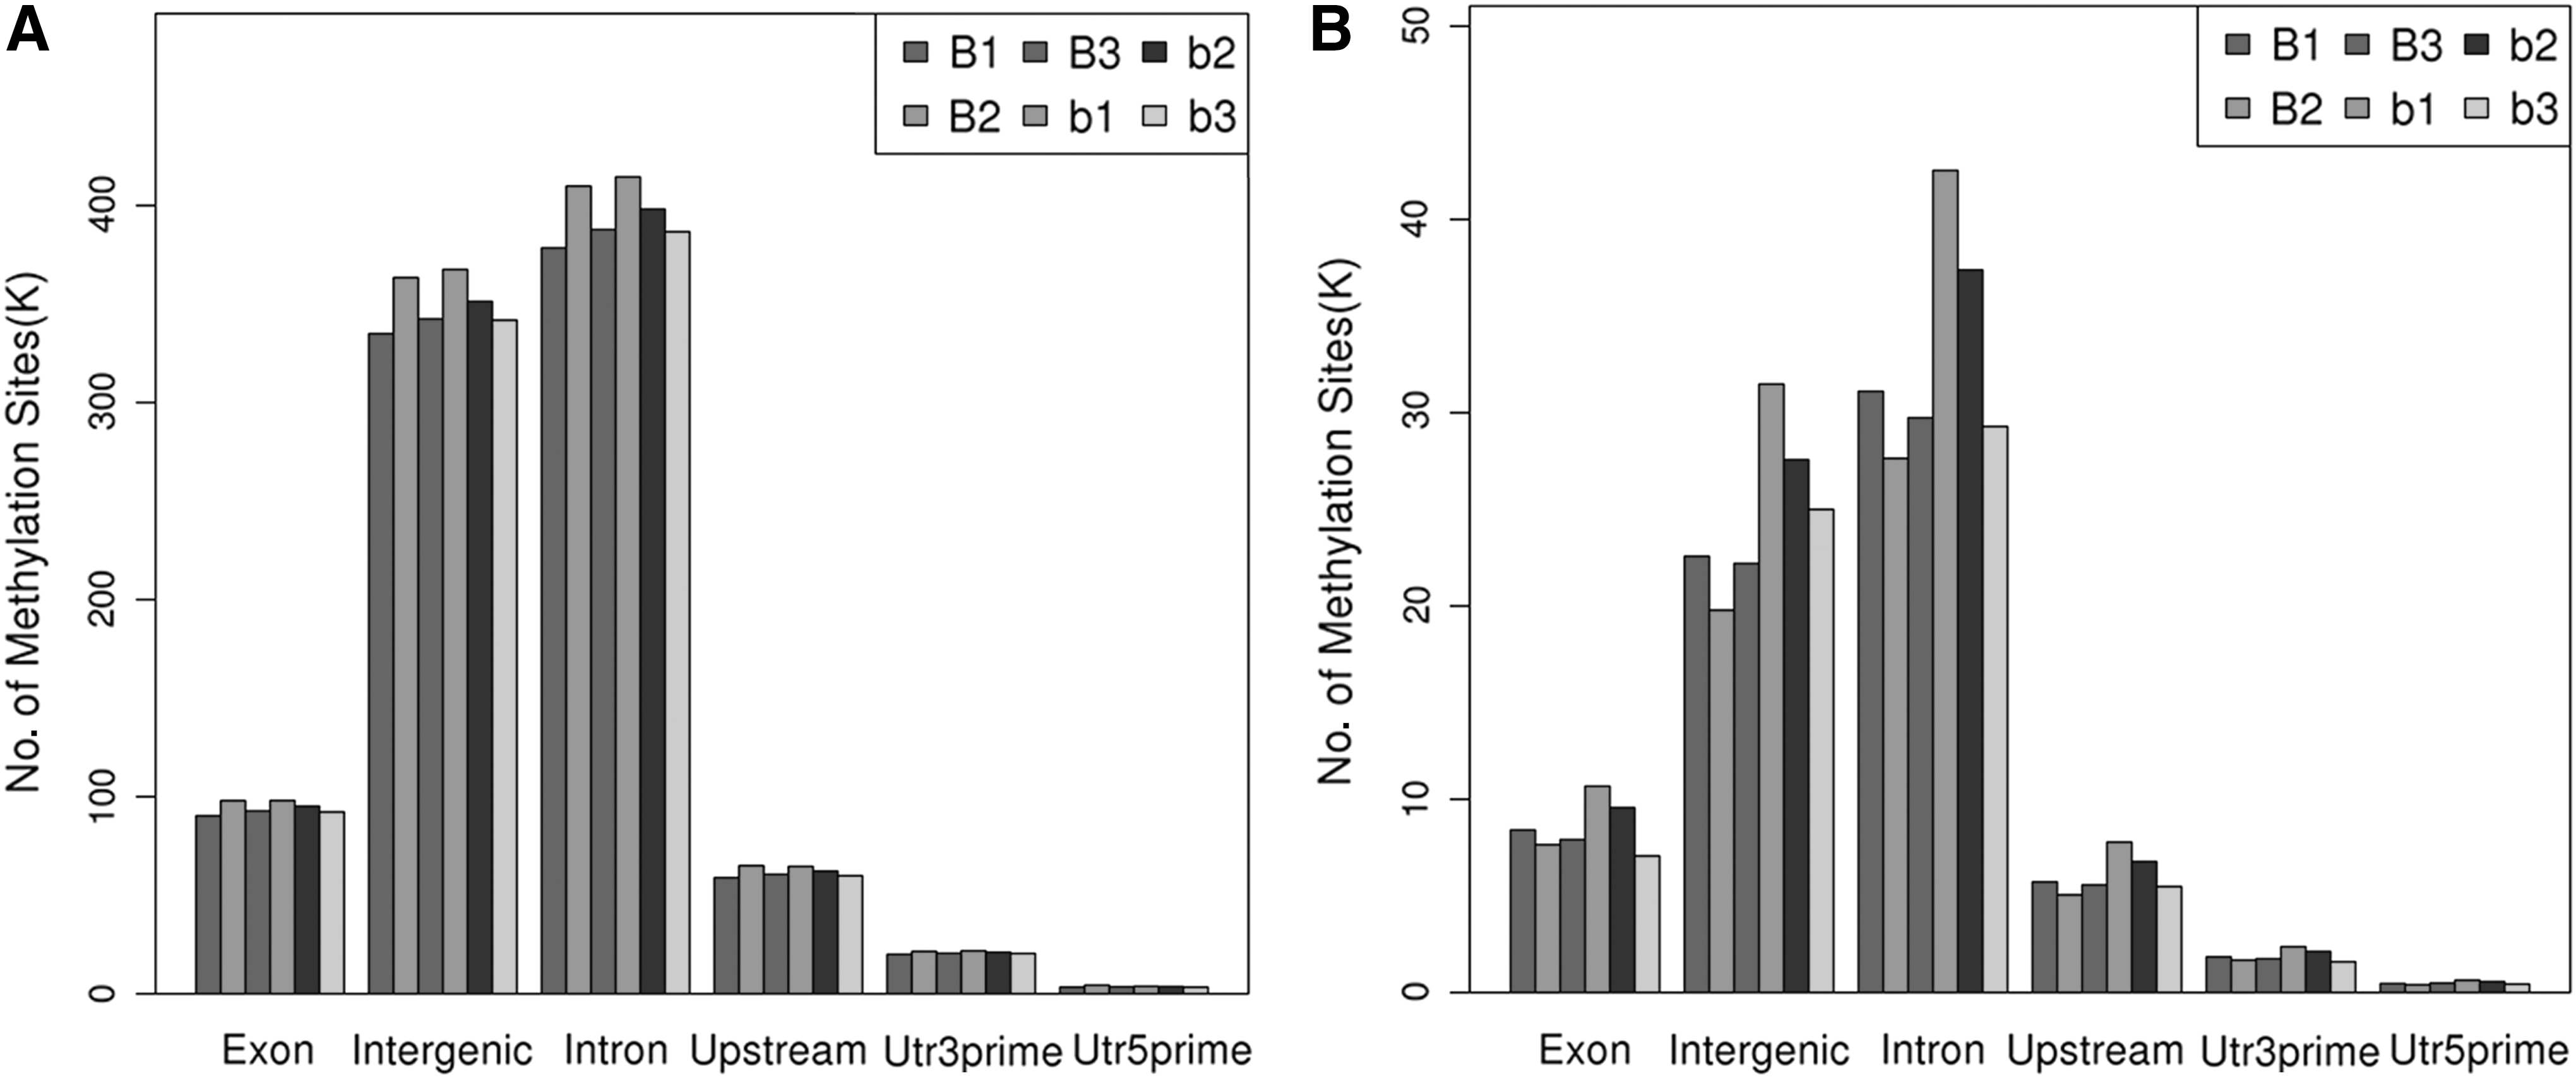
Distribution in different components of the genome.
Relative quantification of DNA methylation levels
According to the consistency of the equal-length sequence amplification efficiency, the sequencing depth of the methylation label can reflect the methylation level of the site (CCGG/CCWGG). The RPM (reads per million) is the unit of the quantitative value of methylation level at the site, which means the site methylation level quantitative value equal to site coverage reads number/library high quality reads multiplied by 1,000,000. The DNA methylation level in the gene region was calculated by the reads that were aligned on a distinct locus in the genome. We selected upstream and downstream of 2 kb sections of the gene body, TSS and TTS, and summarized the DNA methylation level of the distribution trend of sequencing reads in embryonic palatal shelve (Supplementary Fig. S2).
Comparison of methylation levels between groups
The change in methylation level was assessed based on the sequencing depth information of each site in the relative quantitative results of methylation, using R package edge R (Robinson et al., 2010). The differential p-value (p < 0.05) and fold change (log2FC >1) between different sites were given according to the sequencing data (Supplementary Data). For assessing the methylation level of differential methylation sites between case and control for the three biological replicates, we implemented cluster analysis to further reveal the changes in CCGG/CCWGG methylation levels between the groups. The cluster heat map is shown (p-value of differential methylation sites selected by the top 10,000) in Figure 5.
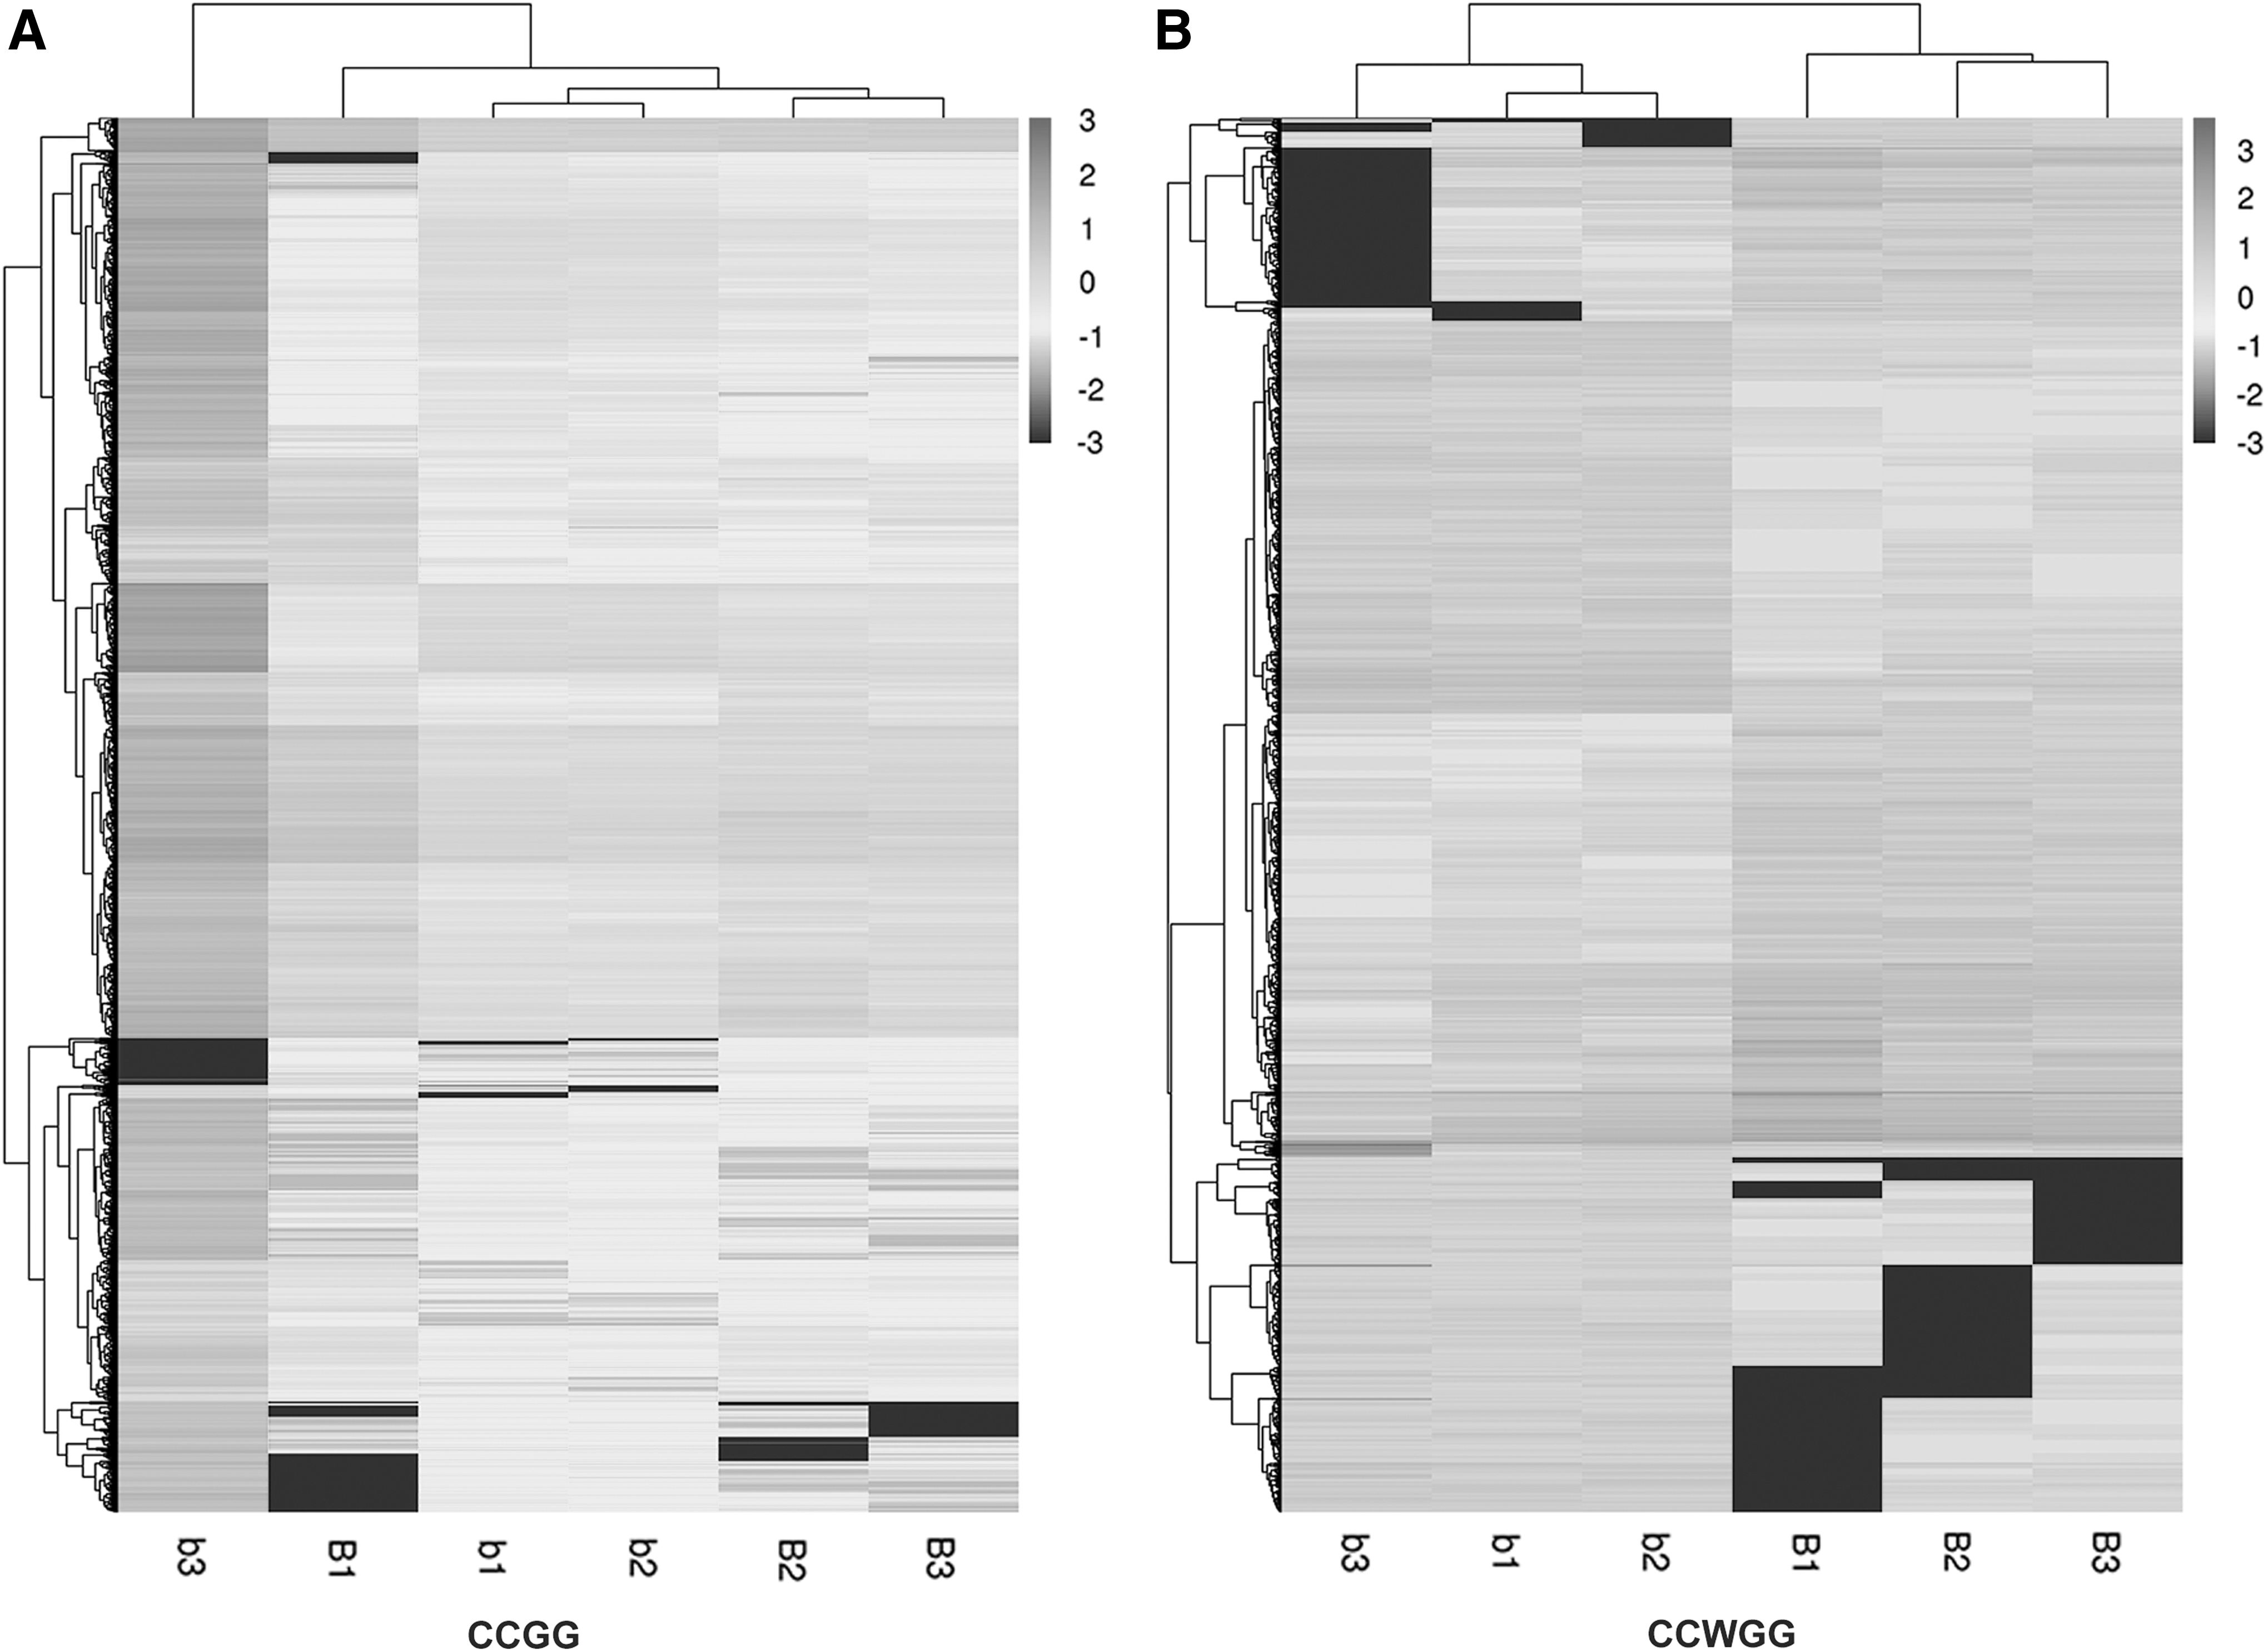
Hierarchical cluster analysis heat-map of differential methylation sites between groups.
According to the positional information of the differentially methylated sites relative to the chromosome, the distribution Circos of differential methylation sites on chromosomes was drawn and the results are shown in the Figure 6.
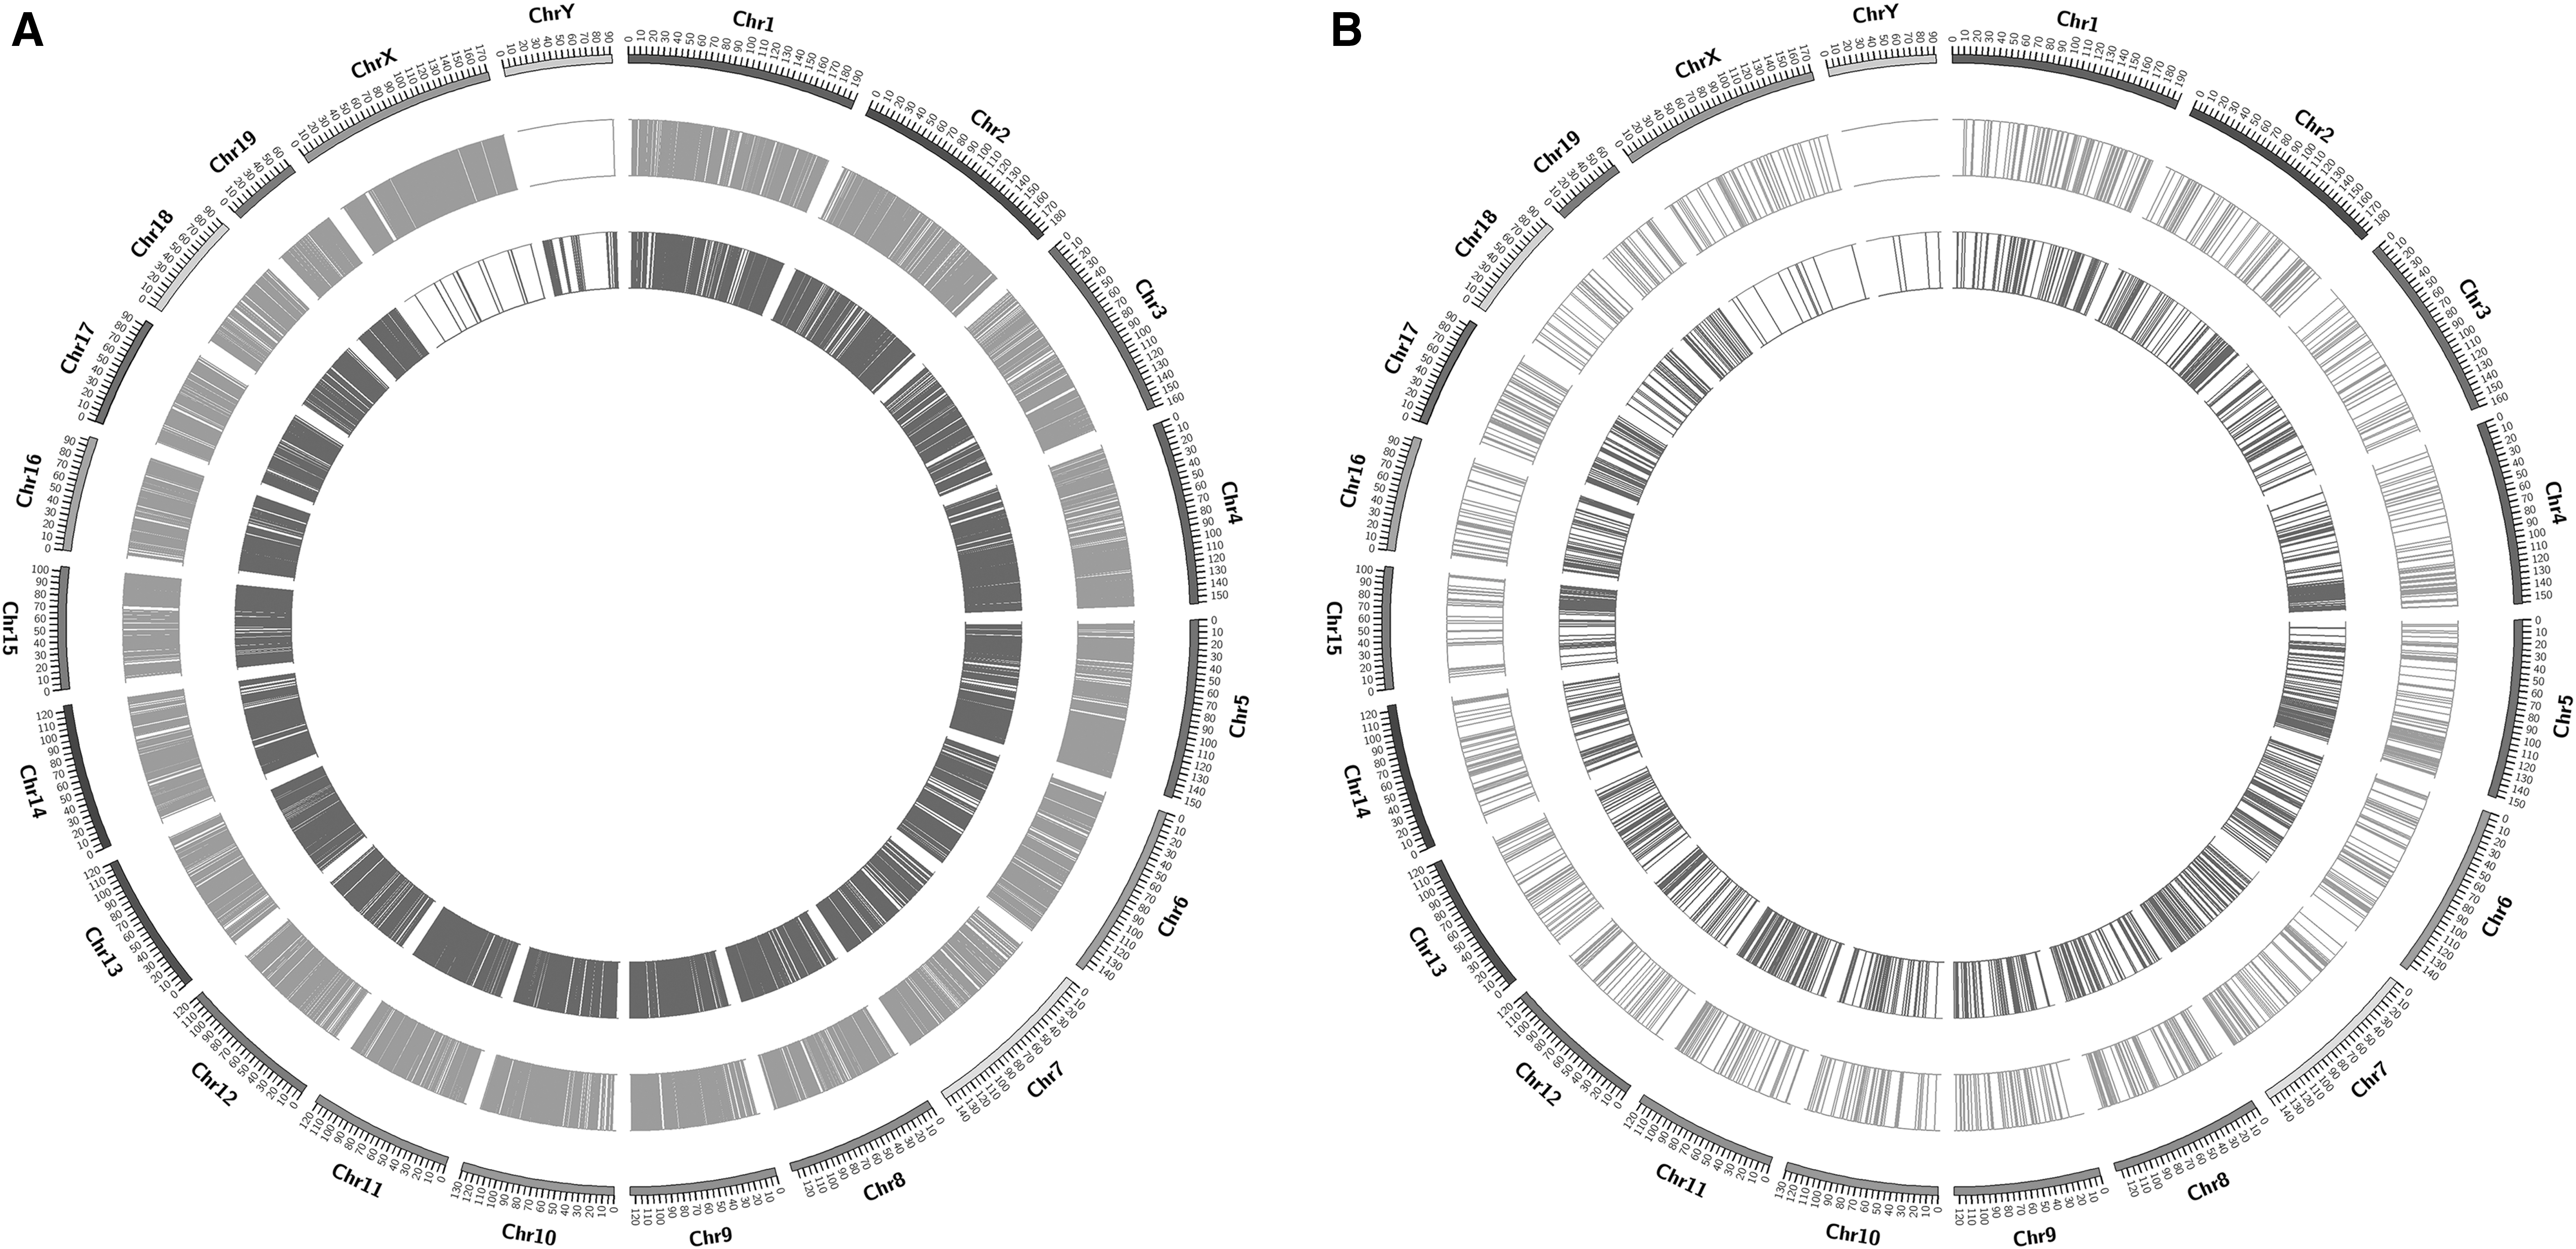
Distribution of differential methylation sites on chromosomes (
The pie map distribution of differential methylation sites on different functional components was drawn according to the positional information of the differentially methylated sites relative to the gene, and the results are shown in the Figure 7. The distribution of differential methylation sites on genes of different functional components showed that the CCGG/CCWGG is mainly in the intron and the intergenic regions.

Distribution of differential methylation sites on genes of different functional components,
GO and KEGG enrichment analysis
Differentially methylated sites related to genes involved in the formation of CP were screened for GO enrichment analysis. The numbers of genes included in each GO category were counted and the statistical significance of gene enrichment in each GO category was calculated using the hypergeometric distribution test. GO entries with the number of corresponding genes greater than 2 in three categories were screened and the GO enrichment analysis results (Top 30) are shown in Figure 8.
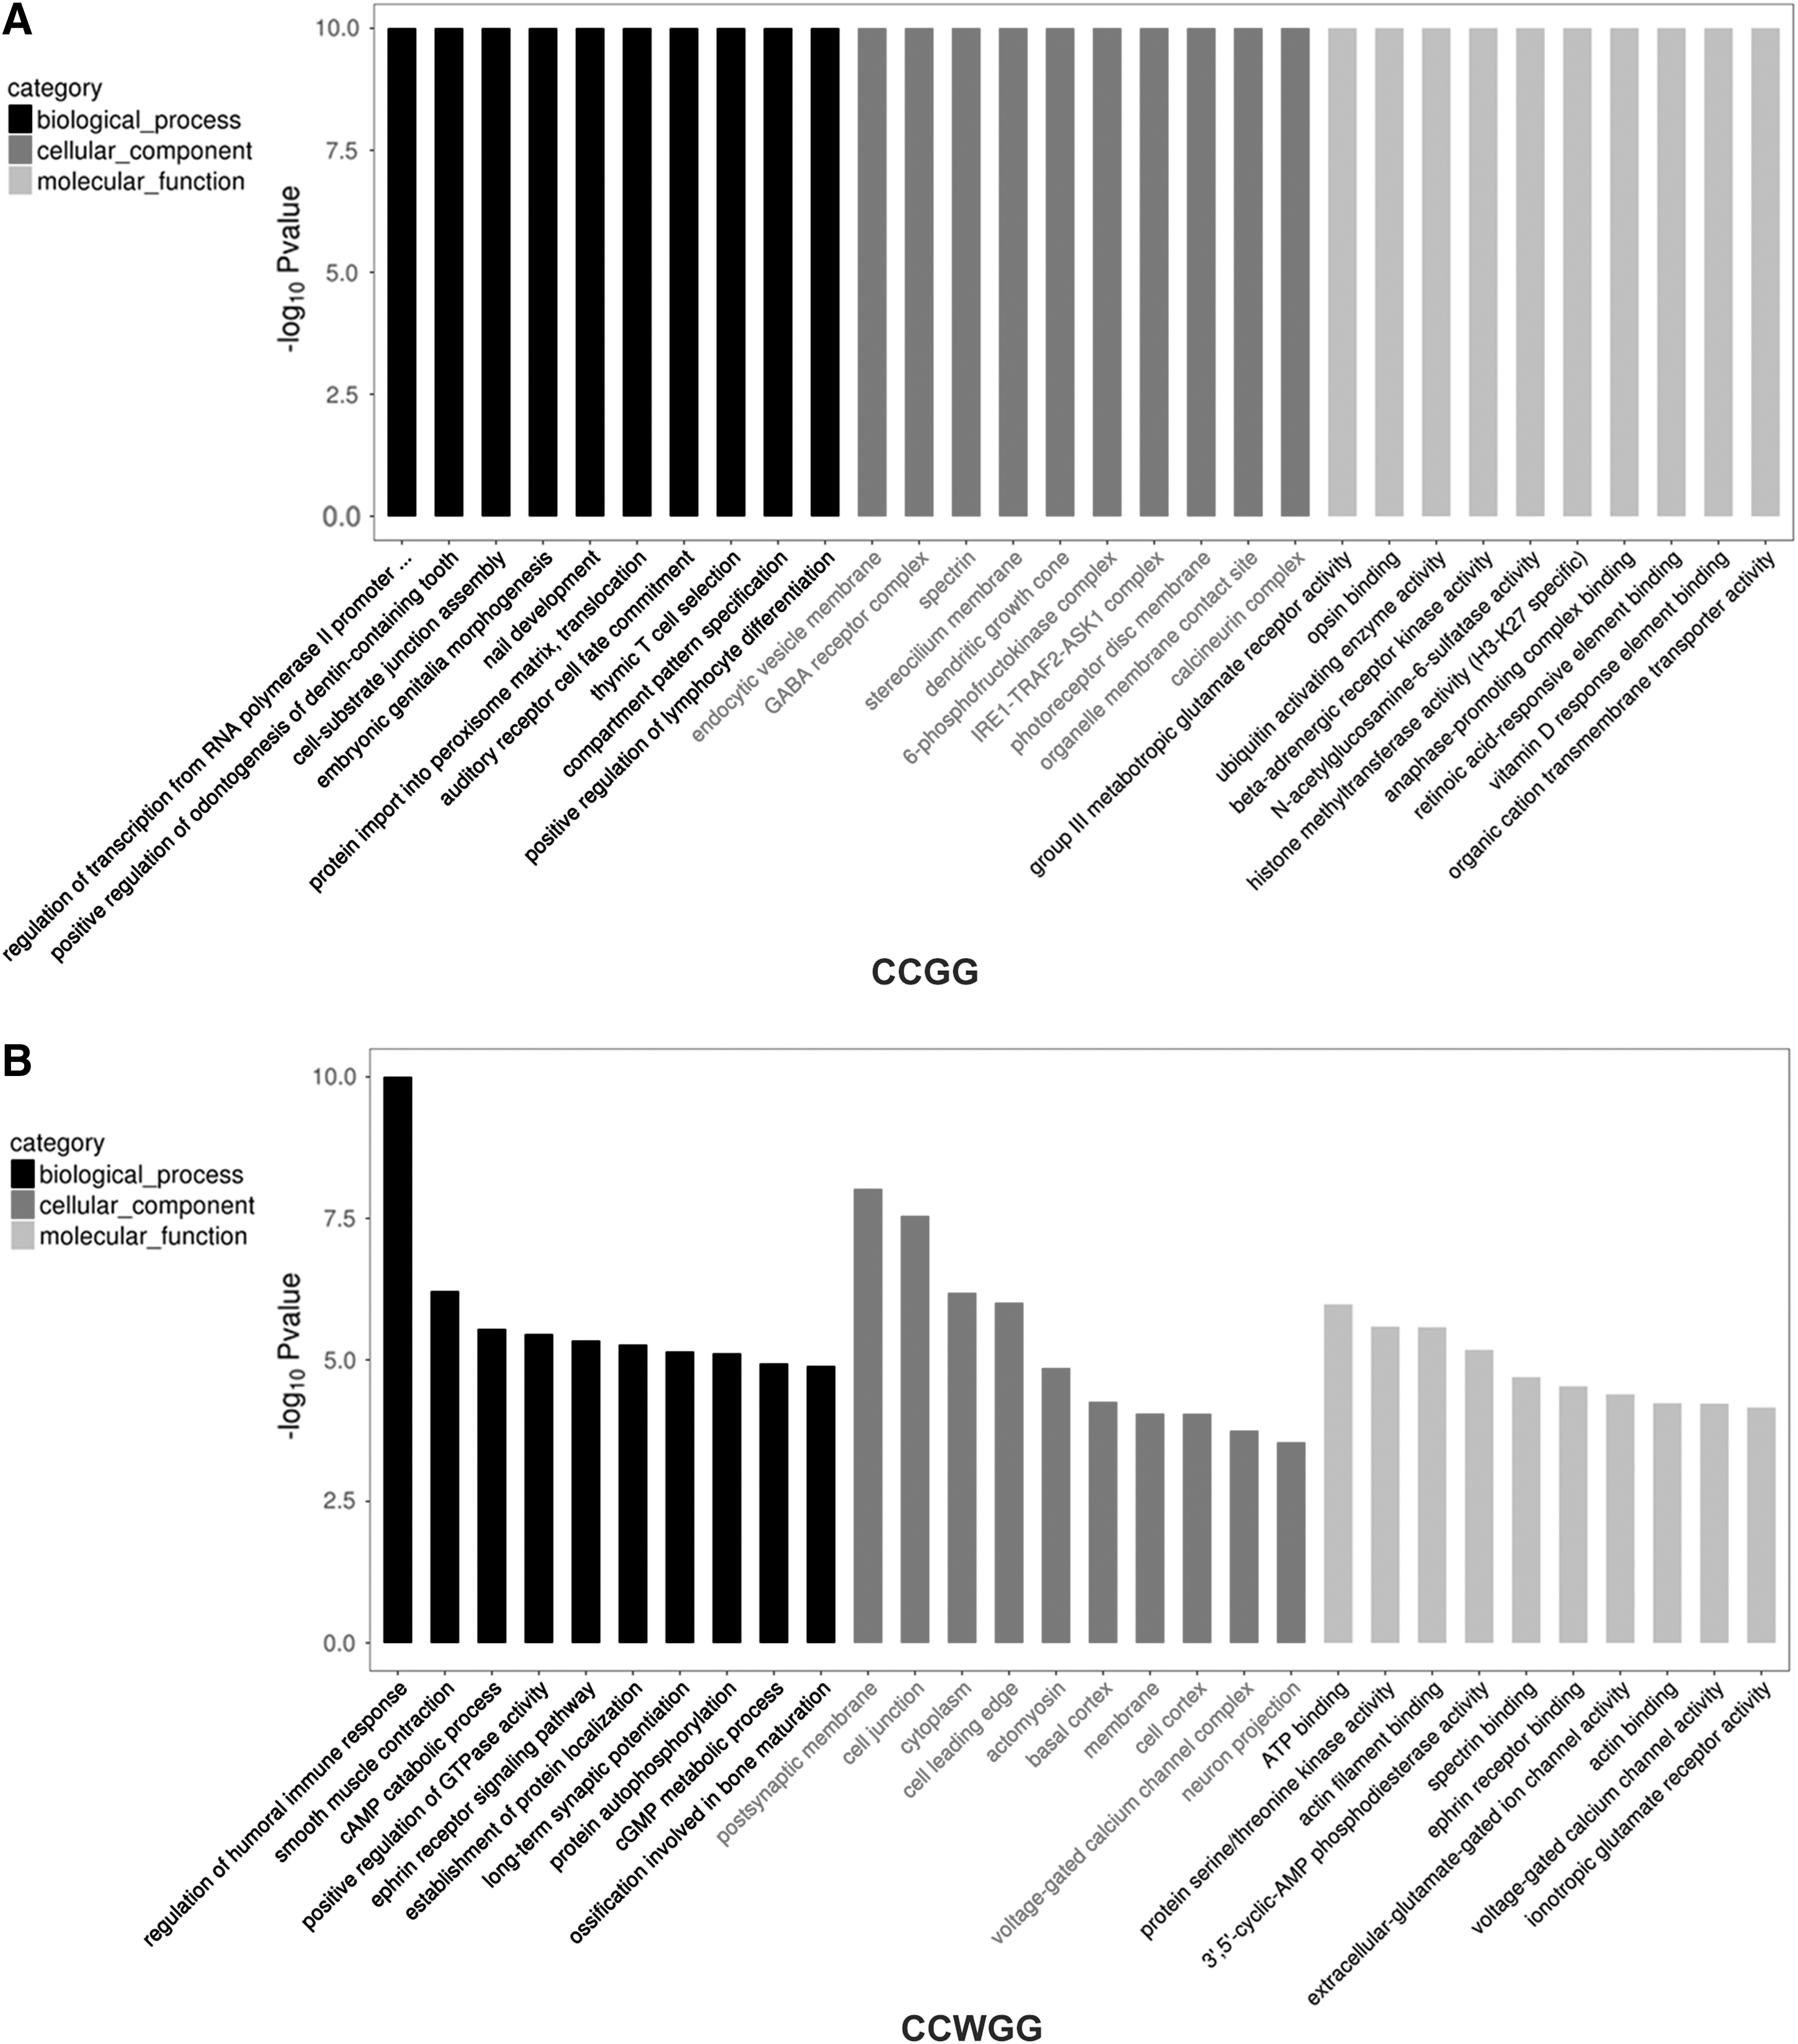
GO enrichment analysis of differentially methylated genes.
We also performed KEGG enrichment pathway analysis between the groups (mapping to annotate genes) and screened differentially methylated sites for KEGG enrichment analysis, and identified differentially methylated genes participating in cell signaling pathways (Fig. 9).
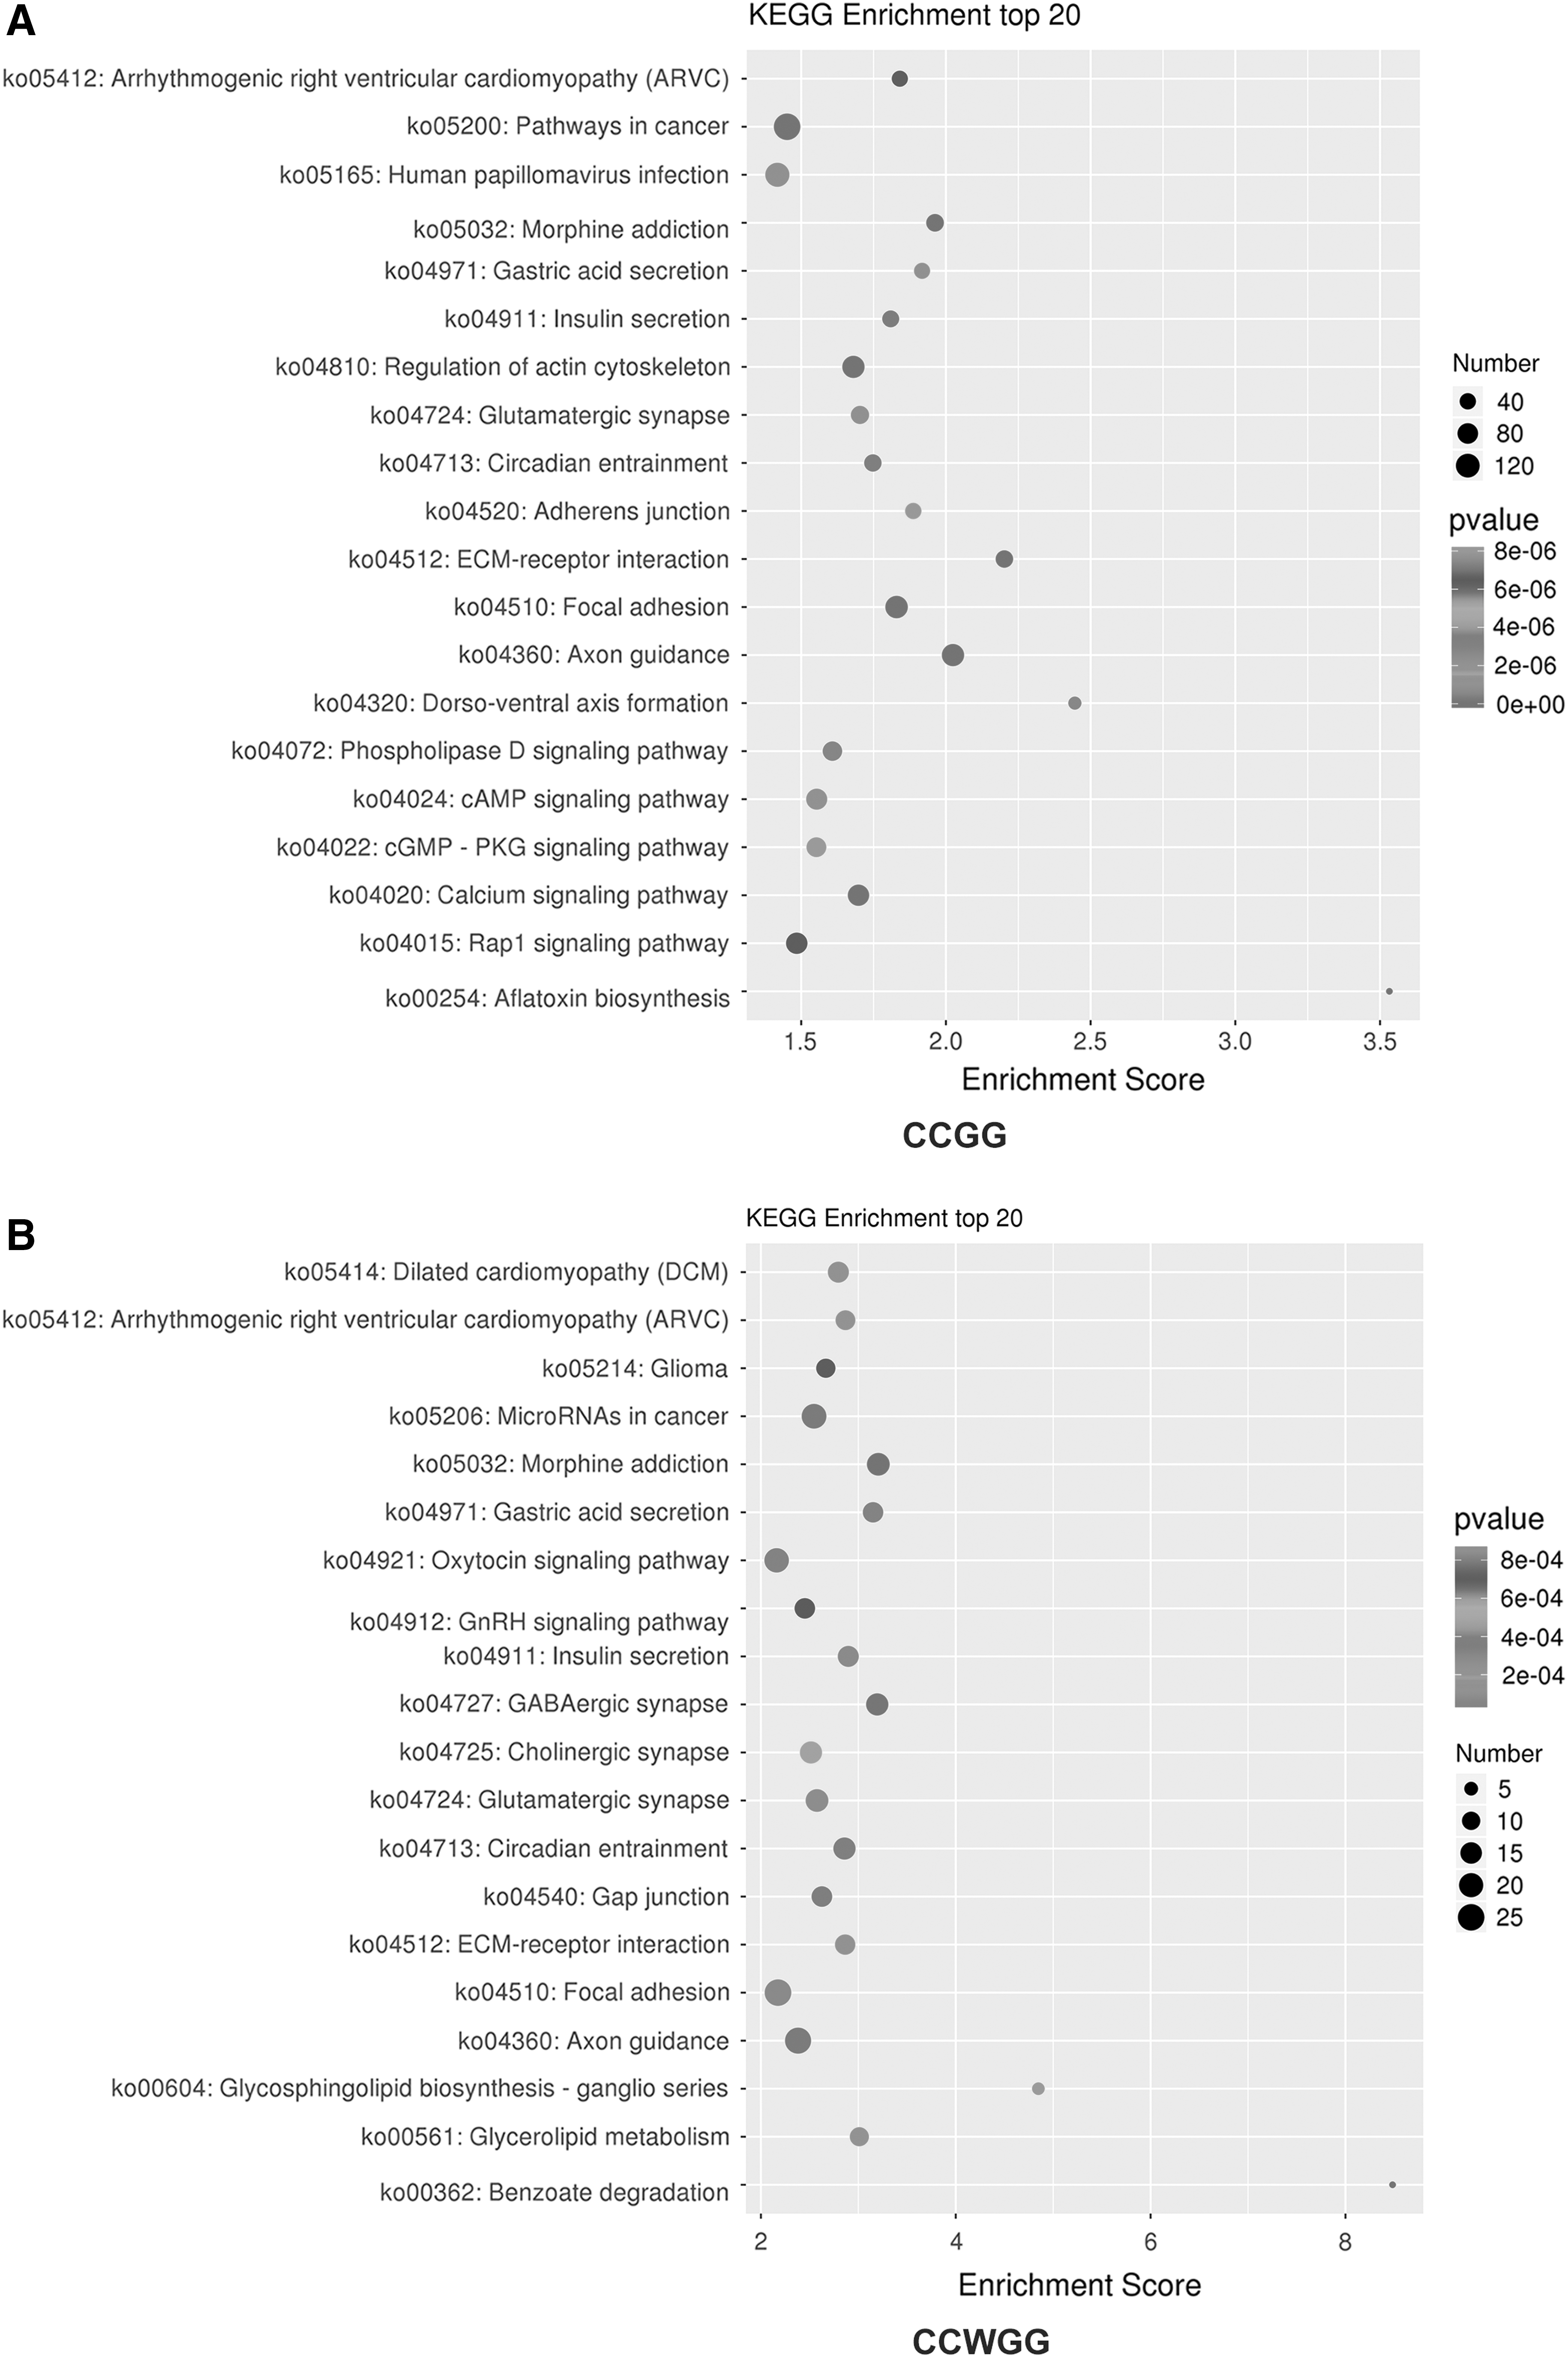
KEGG enrichment of top 20 bubble diagram of differential methylation-related genes.
Identifying potential enhancers
The BLAST Software (McGinnis and Madden, 2004) (
Statistical analysis
For the paired case and control of embryonic mouse palatal tissue, an unsupervised hierarchical clustering analysis was used to identify distinct subgroups based on the differentially methylated sites. Relative quantification of DNA methylation levels was performed using the normalized read depth (RPM) for each site. The correlation between samples of methylation levels was assessed using Pearson's correlation coefficient. The level of methylation between groups was assessed using R package edge R (Robinson et al., 2010). A p-value <0.05 and log2FC >1 were considered statistically significant.
Results
Identification of the distribution of methylated sites
We generated a total of over 800 million clean reads from six embryonic mouse palatal shelf samples. Of the total reads, 325 million enzyme reads and 234 million mapping reads were generated. The mapped ratio between cases and controls was 68.85–74.32% (Table 1), which included differentially methylated 17299 CCGG sites and 2363 CCWGG sites that were mapped to the reference sequence. The average sequencing depth of the methylation sites (CCGG/CCWGG) in each sample between the case and control embryonic palatal shelf is shown in Table 2.
Analysis of the methylation peaks among the chromosomal distribution of the CCGG/CCWGG site revealed that the number of methylation peaks among cases was greater compared with controls in most chromosomes (Supplementary Fig. S1). The distribution of methylation sites on different gene elements in each sample indicates that the onset of cases during palatal shelf fusion might be associated with global methylation: (i) methylated sites (CCGG/CCWGG) in intron and intergenic regions were more than other regions of all DNA elements; and (ii) among all genomic functional components, the methylation sites in the cases were significantly higher than those in the controls. Except for 5′UTR in CCGG, the methylation sites in the case group were significantly lower than those in the controls (Tables 3 and 4).
Cases (B1, B2, and B3) and Controls (b1, b2, and b3) embryonic palatal tissues.
EMT, epithelial mesenchyme transformation; RPM, reads per million.
Identification of methylation level
The results of DNA methylation level showed that (i) the DNA methylation level of the distribution trend of sequencing reads in cases were higher than controls; (ii) the DNA methylation level in gene body, TSS and TTS of CCGG/CCWGG, was dramatically increased in the 2 kb region upstream, except for gene body of CCWGG; (iii) the peak of DNA methylation level of CCGG was located on 300 bp in gene body of 1 kb in TSS and −1 kb in TTS, whereas the peak of DNA methylation level of CCWGG was located on start site in gene body of 200 bp in TSS and 600 bp in TTS; and (iv) the DNA methylation level in gene body and TTS of CCGG/CCWGG was dramatically dropped in the transcription termination site, whereas TSS of CCGG/CCWGG was dramatically increased and dropped to the lowest point before the TSS. However, MethylRAD technology is dependent on high sequences, such that only regions of relatively high CCGG/CCWGG abundance are obtained (Supplementary Fig. S2). Apparently, most of the genes with spaced methylation sites may not be detected by MethylRAD, even if few methylation sites present are actually methylated.
Hierarchical cluster analysis results indicate that the methylation levels of differential methylation sites among cases are higher than those of controls. Hypomethylated CCGG/CCWGG in cases and controls are clustered near the bottom, whereas hypermethylated CCGG/CCWGG in cases and controls are clustered near the top. Interestingly, we found that there were distinctive methylation patterns in cases and controls, and showed obvious interindividual and intraindividual differences in methylation profiles among groups (Fig. 5). The differential methylation sites on chromosomes of the brown track represented upregulated genes, whereas the blue track represented downregulated genes (Fig. 6).
Analysis of distribution of methylation sites in CCGG/CCWGG among genes of the different functional components showed the genome coverage in exon (9.54%), intergenic (39.4%), upstream (6.68%), 3′ UTR (2.07%), 5′ UTR (0.51%), and intron (42.82%) in CCGG; and exon (11.3%), intergenic (35.26%), upstream (7.1%), 3′ UTR (2.85%), 5′ UTR (0.67%), and intron (42.82%) in CCWGG (Fig. 7).
Screening for potential enhancer of gene related to CP
To evaluate differentially methylated genes that are related to CP during palatal shelf fusion, the enhancer within genes (HDAC4, PDGFRB, and TCF7L2) among the sequences of differentially methylated sites in the cases and controls was screened based on enhancer annotation and the method of sequence alignment (Tables 5 and 6). We thoroughly scrutinized the list of significantly differentially methylated loci for sites located within genes (HDAC4, PDGFRB, and TCF7L2) that are related to embryonic palatal fusion and responsible for regulating EMT. The position of differentially methylated site of HDAC4, PDGFRB, and TCF7L2 is located within CCWGG, non-CpG islands of intron region (Supplementary Fig. S3) (
GO and KEGG enrichment analysis for HDAC4, PDGFRB, and TCF7L2
GO enrichment analysis was performed to identify differentially methylated genes related to HDAC4, PDGFRB, and TCF7L2 and the results of enrichment (p < 0.001) were observed for GO biological process and molecular function, which are shown in Table 7. Up on KEEG pathway enrichment analysis, we further identified differentially methylated genes related to HDAC4, PDGFRB, and TCF7L2, and the results of enrichment are shown in Table 8.
Discussion
In this study, we performed a genome-wide DNA methylation analysis, after generating a genome-wide map of DNA methylation during palatal fusion that regulates EMT. Moreover, we further identified the genes with several differentially methylated sites and analyzed the pathways by comparison with case-matched control. The most striking finding in this analysis is the distinct and characteristic methylation pattern displayed in the enhancer region of intron, as reflected by the number of differentially methylated non-CpG sites and corresponding genes.
EMT plays a crucial part in the embryogenesis of palatal fusion. Particularly, in mesoderm formation, neural crest cell delamination, fibrosis, and wound healing, EMT is indispensable (Kalluri and Weinberg, 2009; Thiery et al., 2009). In the palate formation, the apposing shelves adhere to each other by adhesion junctions, then attached by desmosomes in the MEE cell. During EMT, the MEE seems disappearing, leads to the confluence of connective tissue across the palate. CP has a multifactorial etiology that often includes failure of adherence of opposing individual palatal shelves and/or EMT of the MEE (Nawshad, 2008). Failure of any of these evolutionarily late, finely orchestrated processes occurs relatively often and results in CP (Rice, 2005).
A considerable amount of data has established that enhancers are not merely a collection of TF binding sites but also have the capacity to drive transcription independence of their target promoters. This feature of enhancers suggests that they serve more regulatory functions than previously appreciated (Kim and Shiekhattar, 2015). Andersson et al. (2014, 2015) showed that enhancers are enriched in core promoter elements, but are CpG poor, whereas promoters are generally CpG rich. Beside the CpG content, enhancers and promoters have broad similarities and overlapping functional properties, and have been considered to form a single class of regulatory element (Andersson et al., 2015). Therefore, the non-CpG enhancer of intron region participates in the regulation of gene expression. Gene expression is precisely regulated by the combination of promoters and gene-distal enhancer regulatory regions (Vernimmen and Bickmore, 2015).
Aberrant DNA methylation of the susceptible genes, especially regulatory region can result in gene silencing; therefore, enhancers play pivotal roles in regulating gene expression during embryonic palatal fusion. Methylation-induced gene silencing can occur either by impeding the binding of transcription factors and/or the methyl group serving as a substrate for methyl-CpG binding proteins (Bogdanović and Veenstra, 2009). The latter may, in turn, recruit chromatin remodeling proteins, which affect various histone modifications to establish a repressive chromatin environment that results in dramatically altered levels of gene expression (Deaton and Bird, 2011).
Tissue-specific DNA methylation patterns are precisely programmed during embryogenesis (Kafri et al., 1992). Failure to establish correct methylation patterns may lead to embryonic lethality (Li et al., 1992) or result in developmental craniofacial malformations (Ohgane et al., 2001), including CP (Loenarz et al., 2010). All-trans retinoic acid (at-RA), an endogenous metabolite of vitamin A, is required for normal pattern formation during embryogenesis (Ackermans et al., 2011). Conversely, abnormally high concentrations in both experimental animals and humans result in fetal malformations, including CP (Cuervo et al., 2002; Ackermans et al., 2011). Campbell et al.'s (Campbell et al., 2004) research shows the maximum effect for limb defects, and total malformed fetuses were seen at 60 mg/kg and higher. The incidence of CP is increased over the entire range of administered doses, reaching a maximum of 74% (100 mg/kg). They have concluded that a single 100 mg/kg of at-RA to mice bearing E11 embryos has been shown to result in a 90–100% malformation frequency in mouse embryos. In our previous experimental work, the incidence of CP in the at-RA 70 mg/kg and 100 mg/kg treatment groups was 100%, and the incidence of CP in the at-RA30 mg/kg group was 40%. A rate of CP as assessed by our work appears consistent with the results of all earlier studies, that doses of 70 mg/kg or higher induce CP (Qin et al., 2014). Therefore, this study used 70 mg/Kg doses of at-RA to induce the CP model of embryo mice.
HDAC4 [histone deacetylase 4] encoding histone deacetylase 4 is a class II histone deacetylase that binds to other HDACs and myocyte enhancing factor-2 (Mef2) to inhibit transcription factor binding to target DNA (Haberland et al., 2009). Recent studies have suggested that HDAC4 has a central role in the formation of the skeleton (Vega et al., 2004) and controls the development of the palatal skeleton (Haberland et al., 2009). In this study, the differentially methylated non-CpG site of HDAC4, located in the enhancer region, was hypermethylated, which can inhibit gene expression and transcription factor binding to target DNA during palatal fusion, and may lead to the formation of CP.
TCf7L2 [transcription factor 7-like 2 (T cell specific, HMG-box)] plays a critical role in the Wnt signaling pathway (Sun et al., 2010). A previous study suggested that TCF7L2 is a member of the TCF lymphocyte enhancer factor (LEF) protein family (MacDonald et al., 2009), and the bipartite transcription factor β-catenin/TCF-LEF serves as an effector of cAMP-dependent protein kinase A (PKA) signaling. The TCF7L2-enhanced signaling mediates the physiological effects of peptide hormones, including glucagon-like peptide-1 (GLP-1), which utilizes cAMP as a second messenger (Jin et al., 2008; Liu and Habener, 2008). Yet, TCF4 (officially known as TCf7L2) is a candidate gene associated with CP (Essaoui et al., 2013). In this study, the differentially methylated non-CpG site of TCF7L2, located in the enhancer region, was hypomethylated in CP mice, and likely promotes TCF7L2 overexpression and negative regulation of the canonical Wnt signaling pathway to inhibit EMT and palatal fusion.
PDGFRB [platelet-derived growth factor receptor, beta polypeptide] encodes a receptor tyrosine kinase. Recent studies have suggested that PDGFRB can regulate epithelial-to-mesenchymal transition of epicardial cells (Smith et al., 2011). In addition, while loss of PI3K signaling through PDGFRB results in normal craniofacial development, the combined loss of PI3K signaling through PDGF receptors may result in craniofacial defects, as severe as a PDGFRA single mutant (Klinghoffer et al., 2002). Moreover, PDGFRA and PDGFRB are shown to interact during palatogenesis in both zebra fish and mice, and affects proper condensation of maxillary neural crest cells during palate formation (McCarthy et al., 2016). In our study, the differentially methylated non-CpG site of PDGFRB, located on the enhancer region, was hypomethylated, which can promote PDGFRB overexpression, and negatively regulates the PI3K-Akt signaling pathway to inhibit EMT during palatal fusion, leading to the formation of CP.
Although we obtained several enhancers showing differential methylation that regulates EMT during palatal fusion, we do not exclude that other factors may drive CP formation, nor are we suggesting a direct causality between enhancer methylation and CP; some limitations of our study must be taken into account. First, the sample size was relatively small. Second, palatal shelves were obtained directly from embryonic mouse and may be mixed with other tissues. Third, enhancers exhibit highly dynamic methylation patterns during embryo development, whereas our study is only the process of embryonic palatal fusion and lacks of the whole development of the embryonic palatal shelf. Fourth, due to DNA methylation is maintained by the activity of methyltransferase (Burgers et al., 2002), we cannot exclude the effect of at-RA and its endogenous small molecule metabolites on methyltransferase, which further affect the bias of experimental results. To evaluate the enhancer DNA methylation in complex tissues, laser capture microdissection must be employed, and the DNA methylation site and level of gene must be thoroughly verified. Therefore, DNA methylation site and gene-level verification need further evaluation and could be focused as an intending research direction.
Conclusions
Enhancer methylation leading to transcriptional silencing is a major reason for the inactivation of genes. Our results demonstrate that EMT during palatal fusion is dependent on the regulation of enhancer methylation status. The methylation status of enhancer regions of HDAC4, PDGFRB, and TCF7L2 well provides a foundation for future studies. The enhancer of HDAC4, PDGFRB, and TCF7L2 may serve as a future epigenetic target for development of novel therapeutics for CP.
Footnotes
Acknowledgment
This work was supported by The National Natural Science Foundation of China Project grant (number 81001284), Guangdong Province Natural Science Foundation Project grant (number 2015A030313431), and Shanghai Oebiotech Co. Ltd (Shanghai, China).
Disclosure Statement
The authors have declared that no competing interests exist.
References
Supplementary Material
Please find the following supplemental material available below.
For Open Access articles published under a Creative Commons License, all supplemental material carries the same license as the article it is associated with.
For non-Open Access articles published, all supplemental material carries a non-exclusive license, and permission requests for re-use of supplemental material or any part of supplemental material shall be sent directly to the copyright owner as specified in the copyright notice associated with the article.