




Abstract
Sirtuin 5 (SIRT5) belongs to the mitochondrial sirtuin family, which constitutes a highly conserved family of nicotinamide adenine dinucleotide NAD+-dependent deacetylases and ADP-ribosyltransferases that play an important regulatory role in stress resistance and metabolic homeostasis. SIRT5, a member of the mitochondrial sirtuins, has been confirmed to exhibit deacetylase, desuccinylase, and demalonylase enzymatic activities. First, we showed that SIRT5 was expressed at the highest level in the bovine testis, followed by longissimus thoracis and subcutaneous adipose tissue, using real-time quantitative PCR and mRNA levels of SIRT5 during adipocyte differentiation, which increased before the first day and then decreased rapidly. To explore the molecular regulation of bovine SIRT5 expression, we cloned a 2-kb fragment of the 5′-regulatory region and the functional proximal minimal promoter of bovine SIRT5. Electrophoretic mobility shift assays and luciferase reporter assays identified Kruppel-like factor 2 (KLF2), CCAAT enhancer binding protein beta (CEBPβ), peroxisome proliferator-activated receptor alpha (PPARα), myogenic differentiation 1 (MYOD), and nuclear respiratory factor 1 (NRF1) binding sites as transcriptional activators or repressors in the core promoter region of SIRT5. In brief, our study focused on the mechanism underlying the transcriptional regulation of SIRT5 expression in bovine adipocytes.
Introduction
S
Acetylation is a central regulatory factor of almost all cellular metabolic pathways in bacteria and mammals, and the vast majority of acetylated proteins are mitochondrial metabolic enzymes (Finley et al., 2011; Hebert et al., 2013; Park et al., 2013). As a member of the mitochondrial sirtuins, SIRT5 has been shown to exhibit deacetylase, desuccinylase, and demalonylase enzymatic activities, which can remove acetyl, succinyl, and malonyl groups from lysine residues (Du et al., 2011). Recent studies have suggested that SIRT5 promotes the urea cycle in liver mitochondria at the rate-limiting and first step by regulating carbamoyl phosphate synthetase (CPS1) (Nakagawa et al., 2009; Ogura et al., 2010). CPS1 has a critical function in the detoxification of excess ammonia, by removing the ammonia produced in the process of amino acid catabolism (Yefimenko et al., 2005). During fasting, with increasing amino acid catabolism, NAD increases in liver mitochondria, and SIRT5 deacetylates CPS1 and upregulates its enzymatic activity almost immediately to adapt to these physiological changes (Ogura et al., 2010). In addition, SIRT5 also interacts with and deacetylates cytochrome c (Schlicker et al., 2008), a protein located in the mitochondrial intermembrane space (IMS), and has a key function in oxidative metabolism and apoptosis (Neupert, 1997). Interestingly, the overexpression of FLAG-tagged mouse SIRT5 in COS7 cells was also exclusively detected in the IMS (Nakamura et al., 2008). Recent studies have also indicated that the deletion of SIRT5 in hepatocytes can significantly inhibit glycolytic flux, and SIRT5 also regulated the activity of glyceraldehyde-3-phosphate dehydrogenase (GAPDH), which is a key glycolytic enzyme (Nishida et al., 2015). Furthermore, the identified SIRT5 desuccinylation substrates suggest that SIRT5-mediated desuccinylation may be involved in energy metabolism (Park et al., 2013). Based on the above facts, SIRT5 is also crucial in the regulation of energy metabolism. Furthermore, the SIRT5-targeted chromosomal region has been confirmed to be associated with malignant diseases (Mahlknecht et al., 2006); therefore, the crucial role of SIRT5 in regulating cellular metabolism provides potential therapeutic targets for diseases such as metabolic syndrome, diabetes, and obesity.
Transcriptional regulation is the primary means through which cells regulate the conversion of DNA to RNA, thereby orchestrating gene activity (Miranda et al., 2015; Li et al., 2017). Transcriptional regulation allows the cell or organism to respond to a variety of intracellular and extracellular signals and thus adapt accordingly (Wei et al., 2017; Zhang et al., 2018). Transcription factors (TFs) can be divided into two main categories: activators and repressors (Yang et al., 2016). Adipose tissue development is a complex process regulated by a multitude of genes and sequence-specific TFs such as Kruppel-like factor 2 (KLF2), CCAAT enhancer binding protein beta (CEBPβ), peroxisome proliferator-activated receptor alpha (PPARα), myogenic differentiation 1 (MYOD), and nuclear respiratory factor 1 (NRF1), which are involved in the gene regulation of adipocytes. Sequence-specific TFs are coordinated, in part, by the action of adipocytes and regulated by transcriptional activation or inhibition by binding to the promoters of downstream genes. SIRT5 serves as an amino acid catabolism determination factor and also plays a crucial role in the regulation of energy metabolism; however, the transcriptional regulation mechanism of SIRT5 promoter activity during adipose differentiation remains unclear.
This study was conducted to elucidate the transcriptional regulatory mechanism of SIRT5 and the effect of TFs on transcriptional regulation by the 5′-regulatory region in bovine adipocytes. Furthermore, the relative mRNA expression pattern of bovine SIRT5 in tissues and its subcellular localization were also determined.
Materials and Methods
Ethics statement
All animal procedures were performed according to guidelines provided by the China Council on Animal Care, and the protocols were approved by the Experimental Animal Manage Committee (EAMC) of Northwest A&F University. Cattle were raised with free access to food and humanely slaughtered in the National Beef Cattle Improvement Center (Yangling, China).
Gene expressions by quantitative PCR analysis
Fifteen tissues (testis, longissimus thoracis, brain, subcutaneous fat, kidney, liver, heart, abomasum, large intestine, reticulum, rumen, omasum, small intestine, lung, and spleen) were obtained from three 18-month male Qinchuan cattle. Total RNA was extracted from the tissues using a Total RNA kit (Tiangen, Beijing, China) and cDNA was generated from the total RNA using PrimeScript™ RT Reagent kit with gDNA Eraser (Perfect Real Time; TaKaRa, Dalian, China) according to the manufacturer's instructions, respectively. Quantitative PCR (qPCR) was performed using a SYBR Green PCR Master Mix kit (TaKaRa) and 7500 System SDS V 1.4.0 (Applied Biosystems). Gene-specific primers used for the qPCR are listed in Table 1; β-Actin was used as the endogenous control gene. The expression of genes was analyzed using the 2−ΔΔCt method (Livak and Schmittgen, 2001).
Underlines indicate base mutations.
Immunofluorescence
Cells were incubated in 4% paraformaldehyde for 20 min and then permeabilized with 0.1% triton X-100 for 10 min. Nonspecific binding was blocked with 5% bovine serum albumin (BSA) for 30 min. Cells were incubated with 2 μg/mL primary antibody against SIRT5 (ab105040; Abcam) at 37°C for 2 h. Then, cells were incubated with 2% BSA and Cy3-conjugated Donkey Anti-Rabbit IgG (D110052; Sangon Biotech, China) at a 1:100 dilution for 30 min. All washes were performed in 1× phosphate-buffered saline. An anti-fade solution containing 4′,6-diamidino-2-phenylindole (DAPI) (C0065; Solarbio, China) was also used.
Generation of promoter luciferase reporter vectors
Gene-specific primers (SIRT5-PF/PR, Table 1) were designed to amplify a 2-kb promoter region upstream of the bovine SIRT5 transcriptional start site (NCBI accession AC_000180.1 from 42803986 to 42826920). PCR amplifications were performed using genomic DNA from Qinchuan cattle blood as a template, using KOD DNA polymerase (Toyobo, Osaka, Japan). For the generation of the luciferase reporter vector, the 2-kb bovine SIRT5 promoter fragment was ligated into the pGL3-basic vector, which was previously digested with the restriction enzymes KpnI and BglII (TaKaRa), and the resulting plasmid was named pGL3-P1. Plasmids pGL3-P2, P3, P4, P5, P6, P7, and P8, which contained unidirectional deletions of the promoter, were generated by PCR using specific primers (Table 1) with incorporated sequences for KpnI and BglII restriction sites, and pGL3−1979/+28 was used as template. Potential TF binding sites were analyzed using the Genomatix suite (
Cell culture and transfection
The 3T3-L1 and bovine adipocytes were maintained in Dulbecco's modified Eagle's medium/nutrient mixture F-12 (DMEM/F-12) (Gibco) supplemented with 10% fetal bovine serum (PAN-Biotech, South America) and antibiotics (100 IU/mL penicillin and 100 μg/mL streptomycin). The cells were incubated at 37°C with 100% humidity and 5% CO2, and passaged using standard cell culture techniques. Cells were grown overnight in 24-well plates in a growth medium without antibiotics until they reached 80–90% confluency, corresponding to a density of 1.2 × 10⁵ cells.
The transfection reagent for each well was mixed with 800 ng of the promoter luciferase reporter vectors (pGL3-P1, P2, P3, P4, P5, P6, P7, and P8), 10 ng of pRL-TK normalizing vector, 2 μL of X-tremeGENEHP DNA transfection reagent (Roche), and 100 μL of opti-DMEM (Gibco; Invitrogen). The samples were then incubated with the DNA-transfection reagent mixture (in triplicate), and the pGL3-basic vector served as a negative control. Six hours after the transfection, we replaced the media with DMEM/F-12 containing 0.5 mM 3-isobutyl-1-methylxanthine, 1 μM dexamethasone, and 5 μg/mL insulin, and then, the 3T3-L1 and bovine adipocyte cells were incubated for 42 h to induce differentiation. Cell lysates were collected 48 h posttransfection and used to measure the relative transcriptional activity of each fragment using the Dual-Luciferase Reporter Assay System (Promega) according to the manufacturer's instructions. Relative luciferase activities were determined using a NanoQuant Plate™ (TECAN, infinite M200PRO). Experiments were conducted in parallel and in triplicate.
Site-directed mutagenesis and knockdown of TFs
The potential TF binding sites for KLF2, CEBPβ, PPARα, MYOD, and NRF1 motifs were mutated with the corresponding primers (Table 1) using the QuikChange site-directed mutagenesis kit (Stratagene). PCR conditions were followed as per the kit instructions, and products were treated with DpnI, amplified with XL10-Gold competent cells (Stratagene), and then the resulting vectors were sequenced for confirmation. The siRNAs targeting KLF2, CEBP
Electrophoretic mobility shift assays
Bovine adipocytes were isolated from Qinchuan fetal bovine samples as described previously (Kamanga-Sollo et al., 2010). Nuclear extracts from bovine adipocytes were prepared using the Nuclear Extract Kit (Active Motif Corp., Carlsbad, CA) according to the manufacturer's protocol. The LightShift Chemiluminescent EMSA Kit (Thermo Fisher Corp., Waltham, MA) was used for this assay, in accordance with the manufacturer's protocol with modifications. All DNA probes (Table 1) were synthesized (Invitrogen) and labeled at the 5′ end with biotin. Briefly, 10 μg of nuclear protein extract were incubated with 2 μL of 10× binding buffer and 1 μL of poly (dI.dC) in 20-μL volume for 15 min on ice. Then, 200 fmol of 5′-biotin labeled probes were added and the reaction mixture was incubated at room temperature for 20 min. For the competition assay, unlabeled probes or mutated probes were added to the reaction mixture 15 min before adding the labeled probes. For the super-shift assay, 10 μg of each of the following antibodies were added to the reaction mixture, respectively, and then incubated on ice for 30 min before adding the labeled probes: anti-KLF2 (ab203591; Abcam), anti-CEBPβ (sc-746; Santa Cruz), anti-PPARα (D161086; Sangon Biotech), anti-MYOD (sc-31940; Santa Cruz), and anti-NRF1 (ab175932; Abcam). Finally, the DNA-protein complexes were separated on a 6% nondenaturing polyacrylamide gel by polyacrylamide electrophoresis using 0.5× tris-borate-EDTA buffer for 1 h. Images were captured using the ChemiDoc™ XRS+ system (Bio-Rad, Hercules, CA).
Statistical analysis
Statistical calculations were performed using the Statistical Analysis System (SAS) v8.0 (SAS Institute, Cary, NC). Statistical significance was determined using the one-way analysis of variance (ANOVA) test for gene expression and luciferase assay data. Data are expressed as mean ± standard deviation (mean ± SD); p < 0.05 was considered significant (* denotes p < 0.05 and ** denotes p < 0.01).
Results
Bioinformatics and protein structure analysis of bovine SIRT5
We first performed a bioinformatics analysis of bovine SIRT5. The phylogenetic tree revealed the relationship between SIRT5 in different species and the potential evolutionary process, and indicated that bovine SIRT5 was most related to the Bovidae family (bovine, goat, and sheep) and least related to Danio rerio out of all the species evaluated in this study (Fig. 1a). The bovine SIRT5 spans ∼22.934 kb on chromosome 23 (AC_000180.1 [42803986–42826920]) and contains 10 exons and 9 introns (Fig. 1b). For bovine SIRT5, an open reading frame of 933 bp was verified, which encoded 310 amino acids (aa), resulting in a protein with a molecular mass of 33.988 kDa and protein molecular formula of C1508H2371N427O435S17, as analyzed by the ExPASy program. The functional domain of bovine SIRT5 protein ranges from aa 51 to 301. Furthermore, the bovine SIRT5 protein comprised two putative domains: the transit peptide ranges from aa 1 to 36, the mat peptide ranges from aa 37 to 310 (Fig. 1b). We found that SIRT5 starts from the 50th amino acid and ends at the 74th amino acid. There is a typical 663-residue transmembrane structure (transmembrane structures consisting of >500 amino acids are considered significant transmembrane structures) (Fig. 1c). The tertiary structure, including the α-helix β-fold β-angle and first-order random curl of bovine SIRT5 protein, was predicted using the online tool SWISS-MODEL software (Fig. 1d).
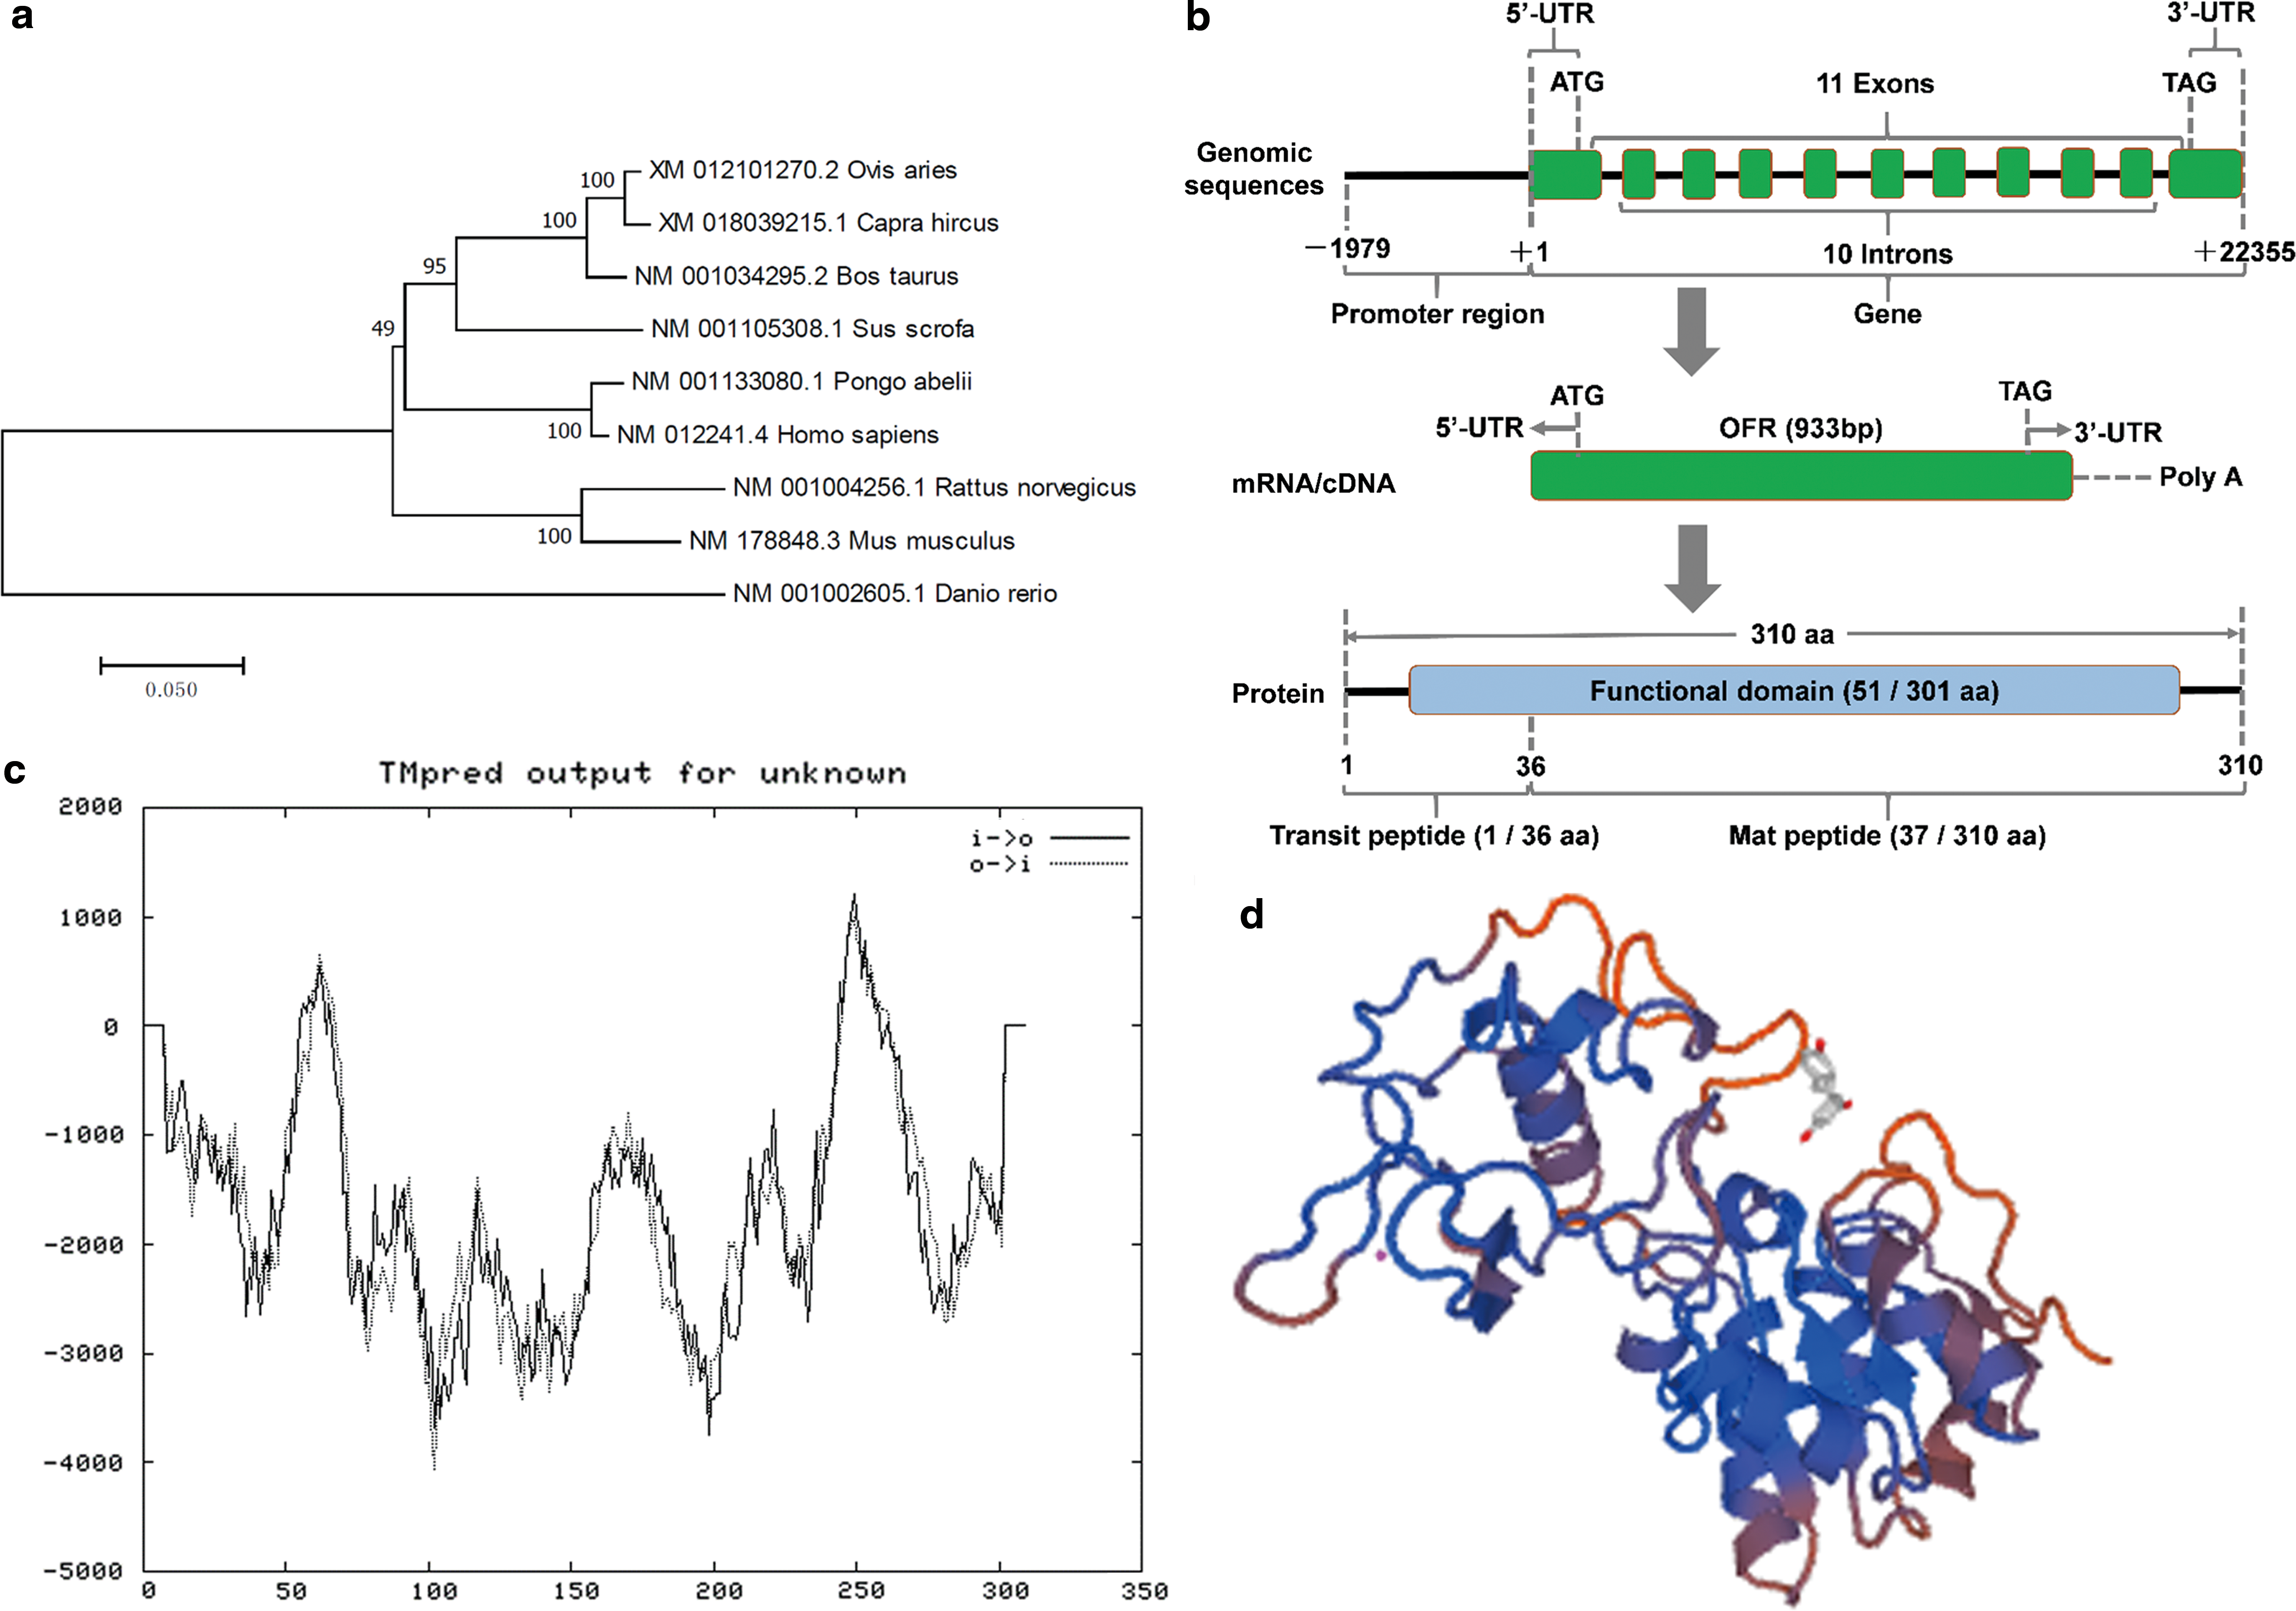
Bioinformatics and protein structure analysis of bovine SIRT5.
The gene expression pattern and subcellular localization of SIRT5 in bovine adipocytes
The spatial expression pattern of bovine SIRT5 was assessed; the results revealed that SIRT5 had the highest expression in the testis, followed by the longissimus thoracis (Fig. 2a; p < 0.05). To further explore the temporal expression pattern of SIRT5 in bovine adipocytes, we measured the mRNA levels of SIRT5 during adipocyte differentiation. We found that the expression increased before the first day of differentiation, and then decreased rapidly with the passage of differentiated time (Fig. 2b; p < 0.05). The cytoplasmic subcellular localization of bovine SIRT5 was confirmed using immunofluorescence experiments, and this protein was particularly expressed in adipocyte mitochondria (Fig. 2c). These results suggested that SIRT5 might be tightly associated with adipocyte development.
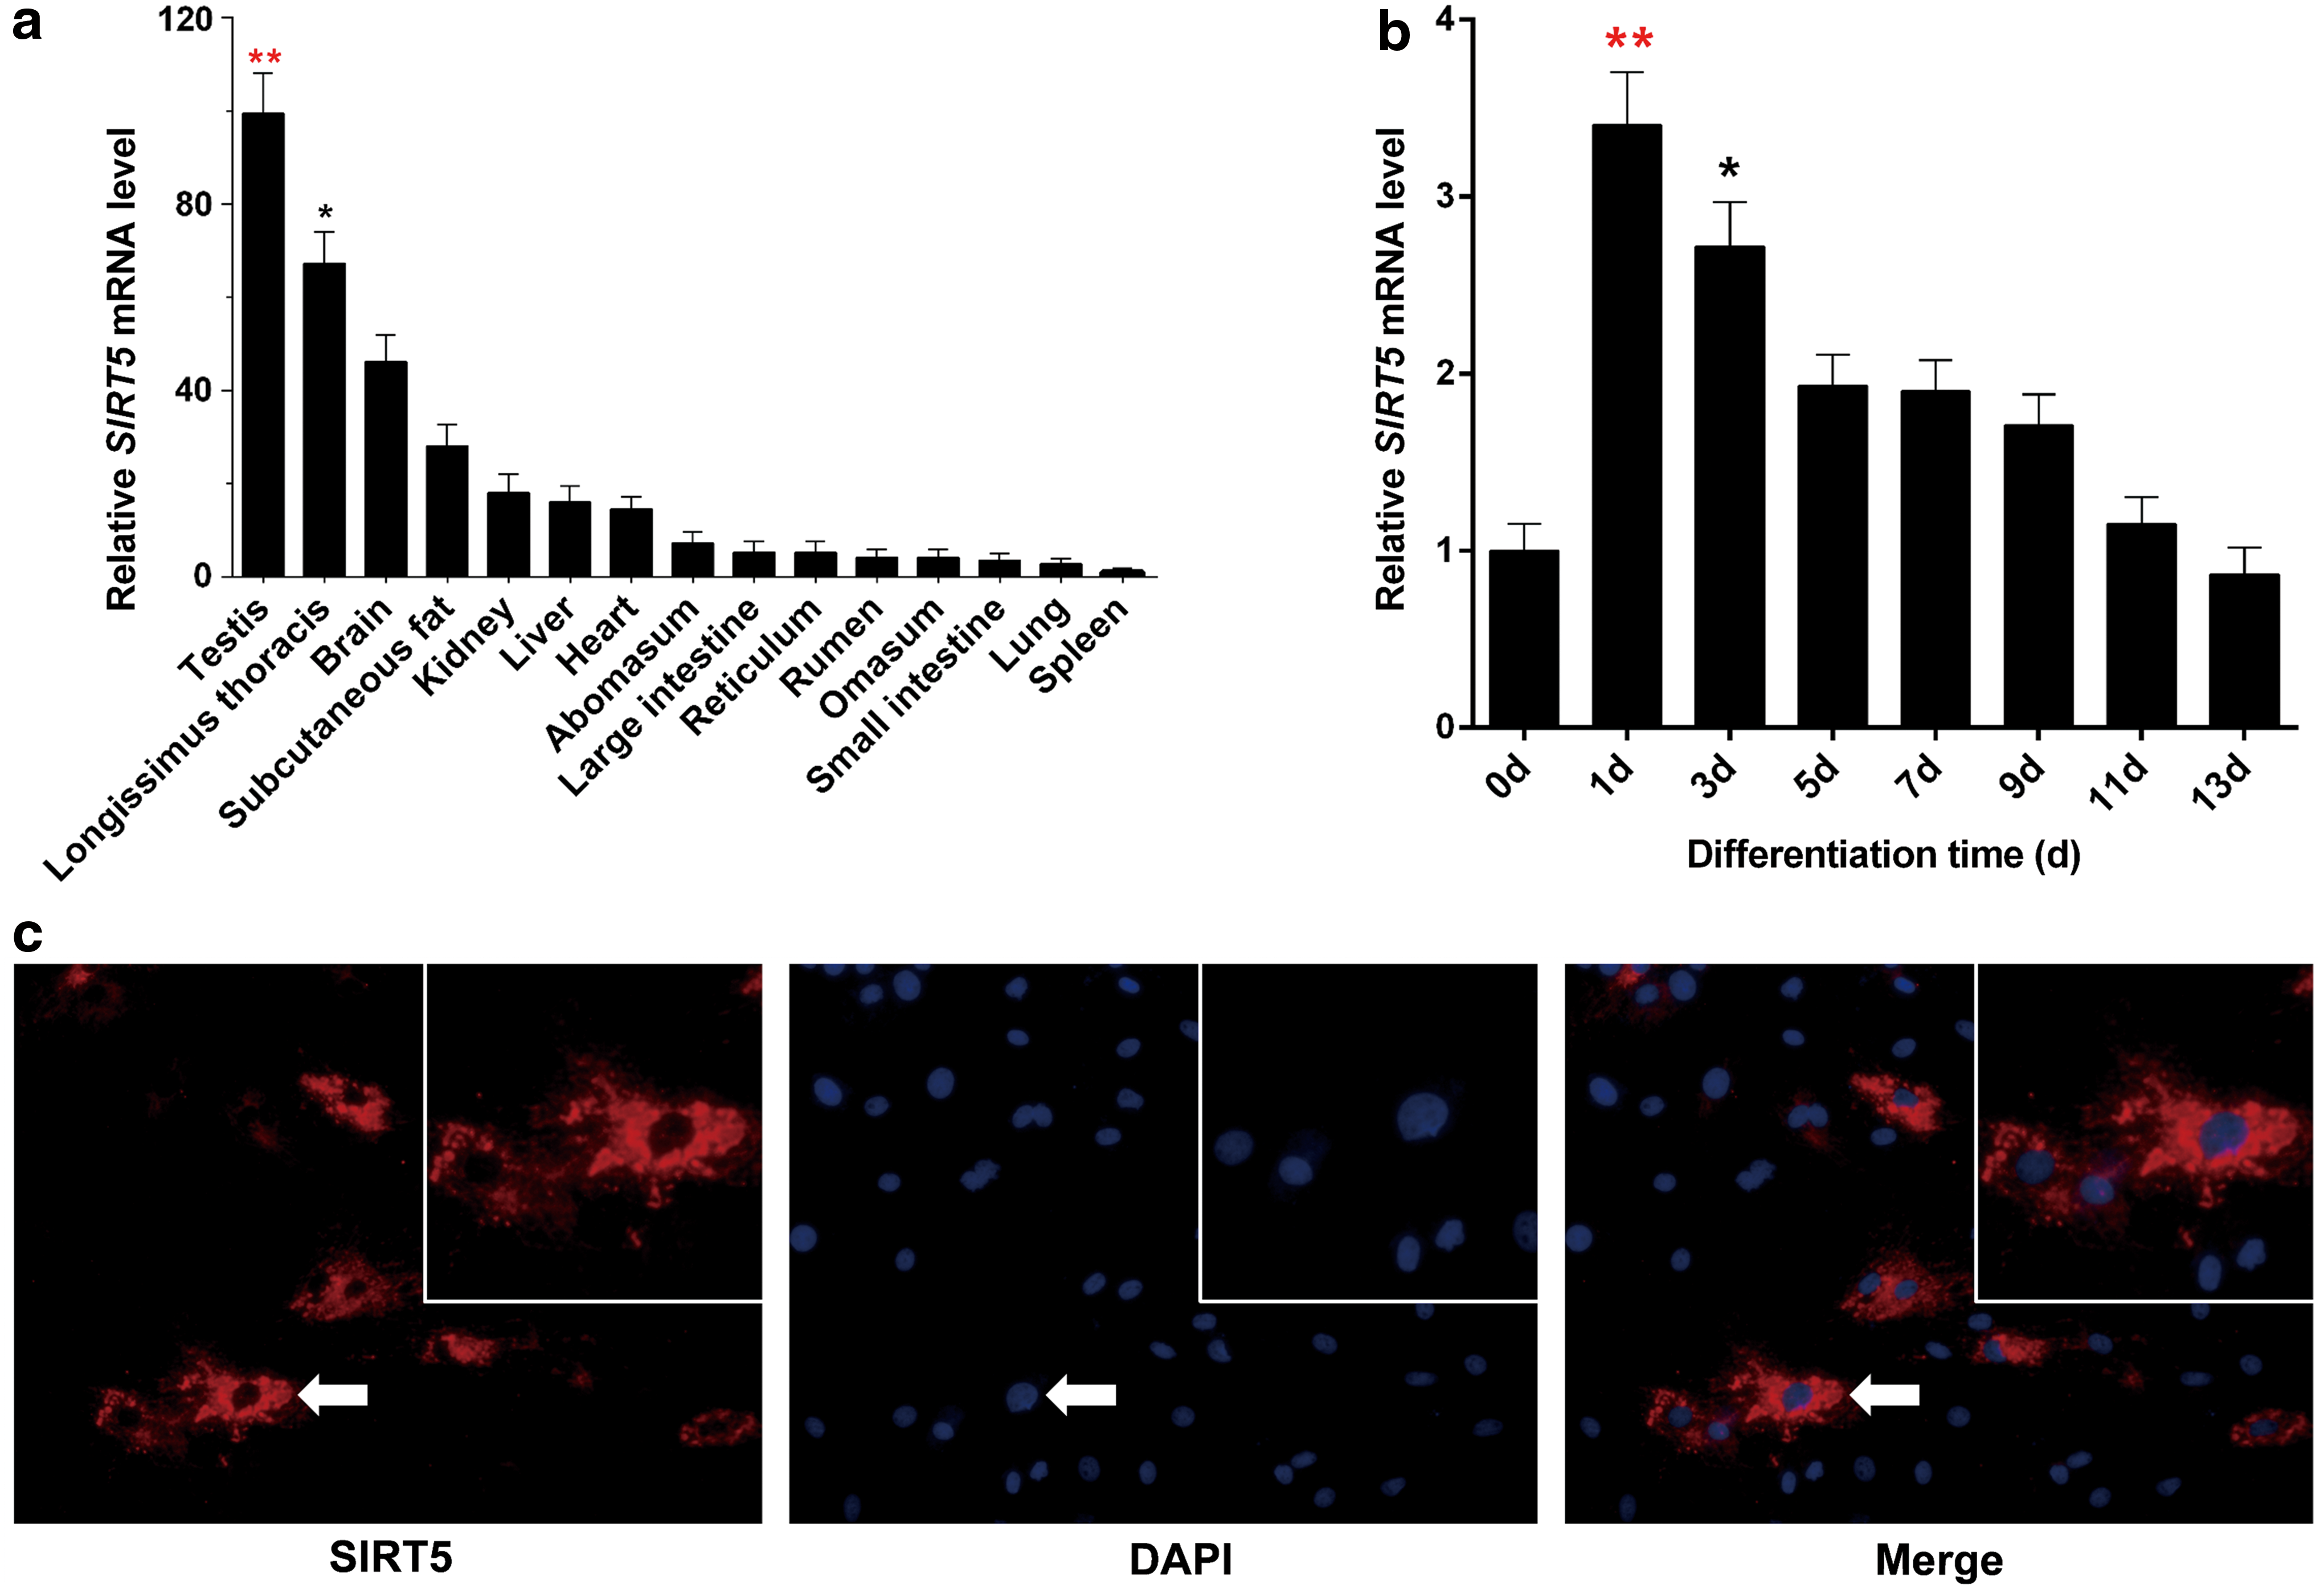
The gene expression pattern and subcellular localization of SIRT5.
Isolation and sequence analysis of the functional proximal minimal promoter of SIRT5 in bovine adipocytes
We further explored the activity of potential cis-acting elements and identified the key sequence required for activity. We constructed a series of reporter vectors with progressively larger deletions from the 5′ end of the promoter. The results of the luciferase reporter assays using 3T3-L1 and bovine adipocyte cells revealed a core promoter in the −343/−127 bp region of SIRT5 (Fig. 3a, b; p < 0.05). In addition, analysis with the MethPrimer program revealed three CpG islands located in the −509/−349, −305/−146, and −133/−29 bp regions, which contain the core promoter region of the −343/−127 bp region (Fig. 3c). We further analyzed regulatory elements in the SIRT5 promoter region at −1979/+28 bp using the Genomatix suite. Five motifs as TF binding sites for KLF2, CEBPβ, PPARα, MYOD, and NRF1 were identified in the core promoter region (Fig. 3d).
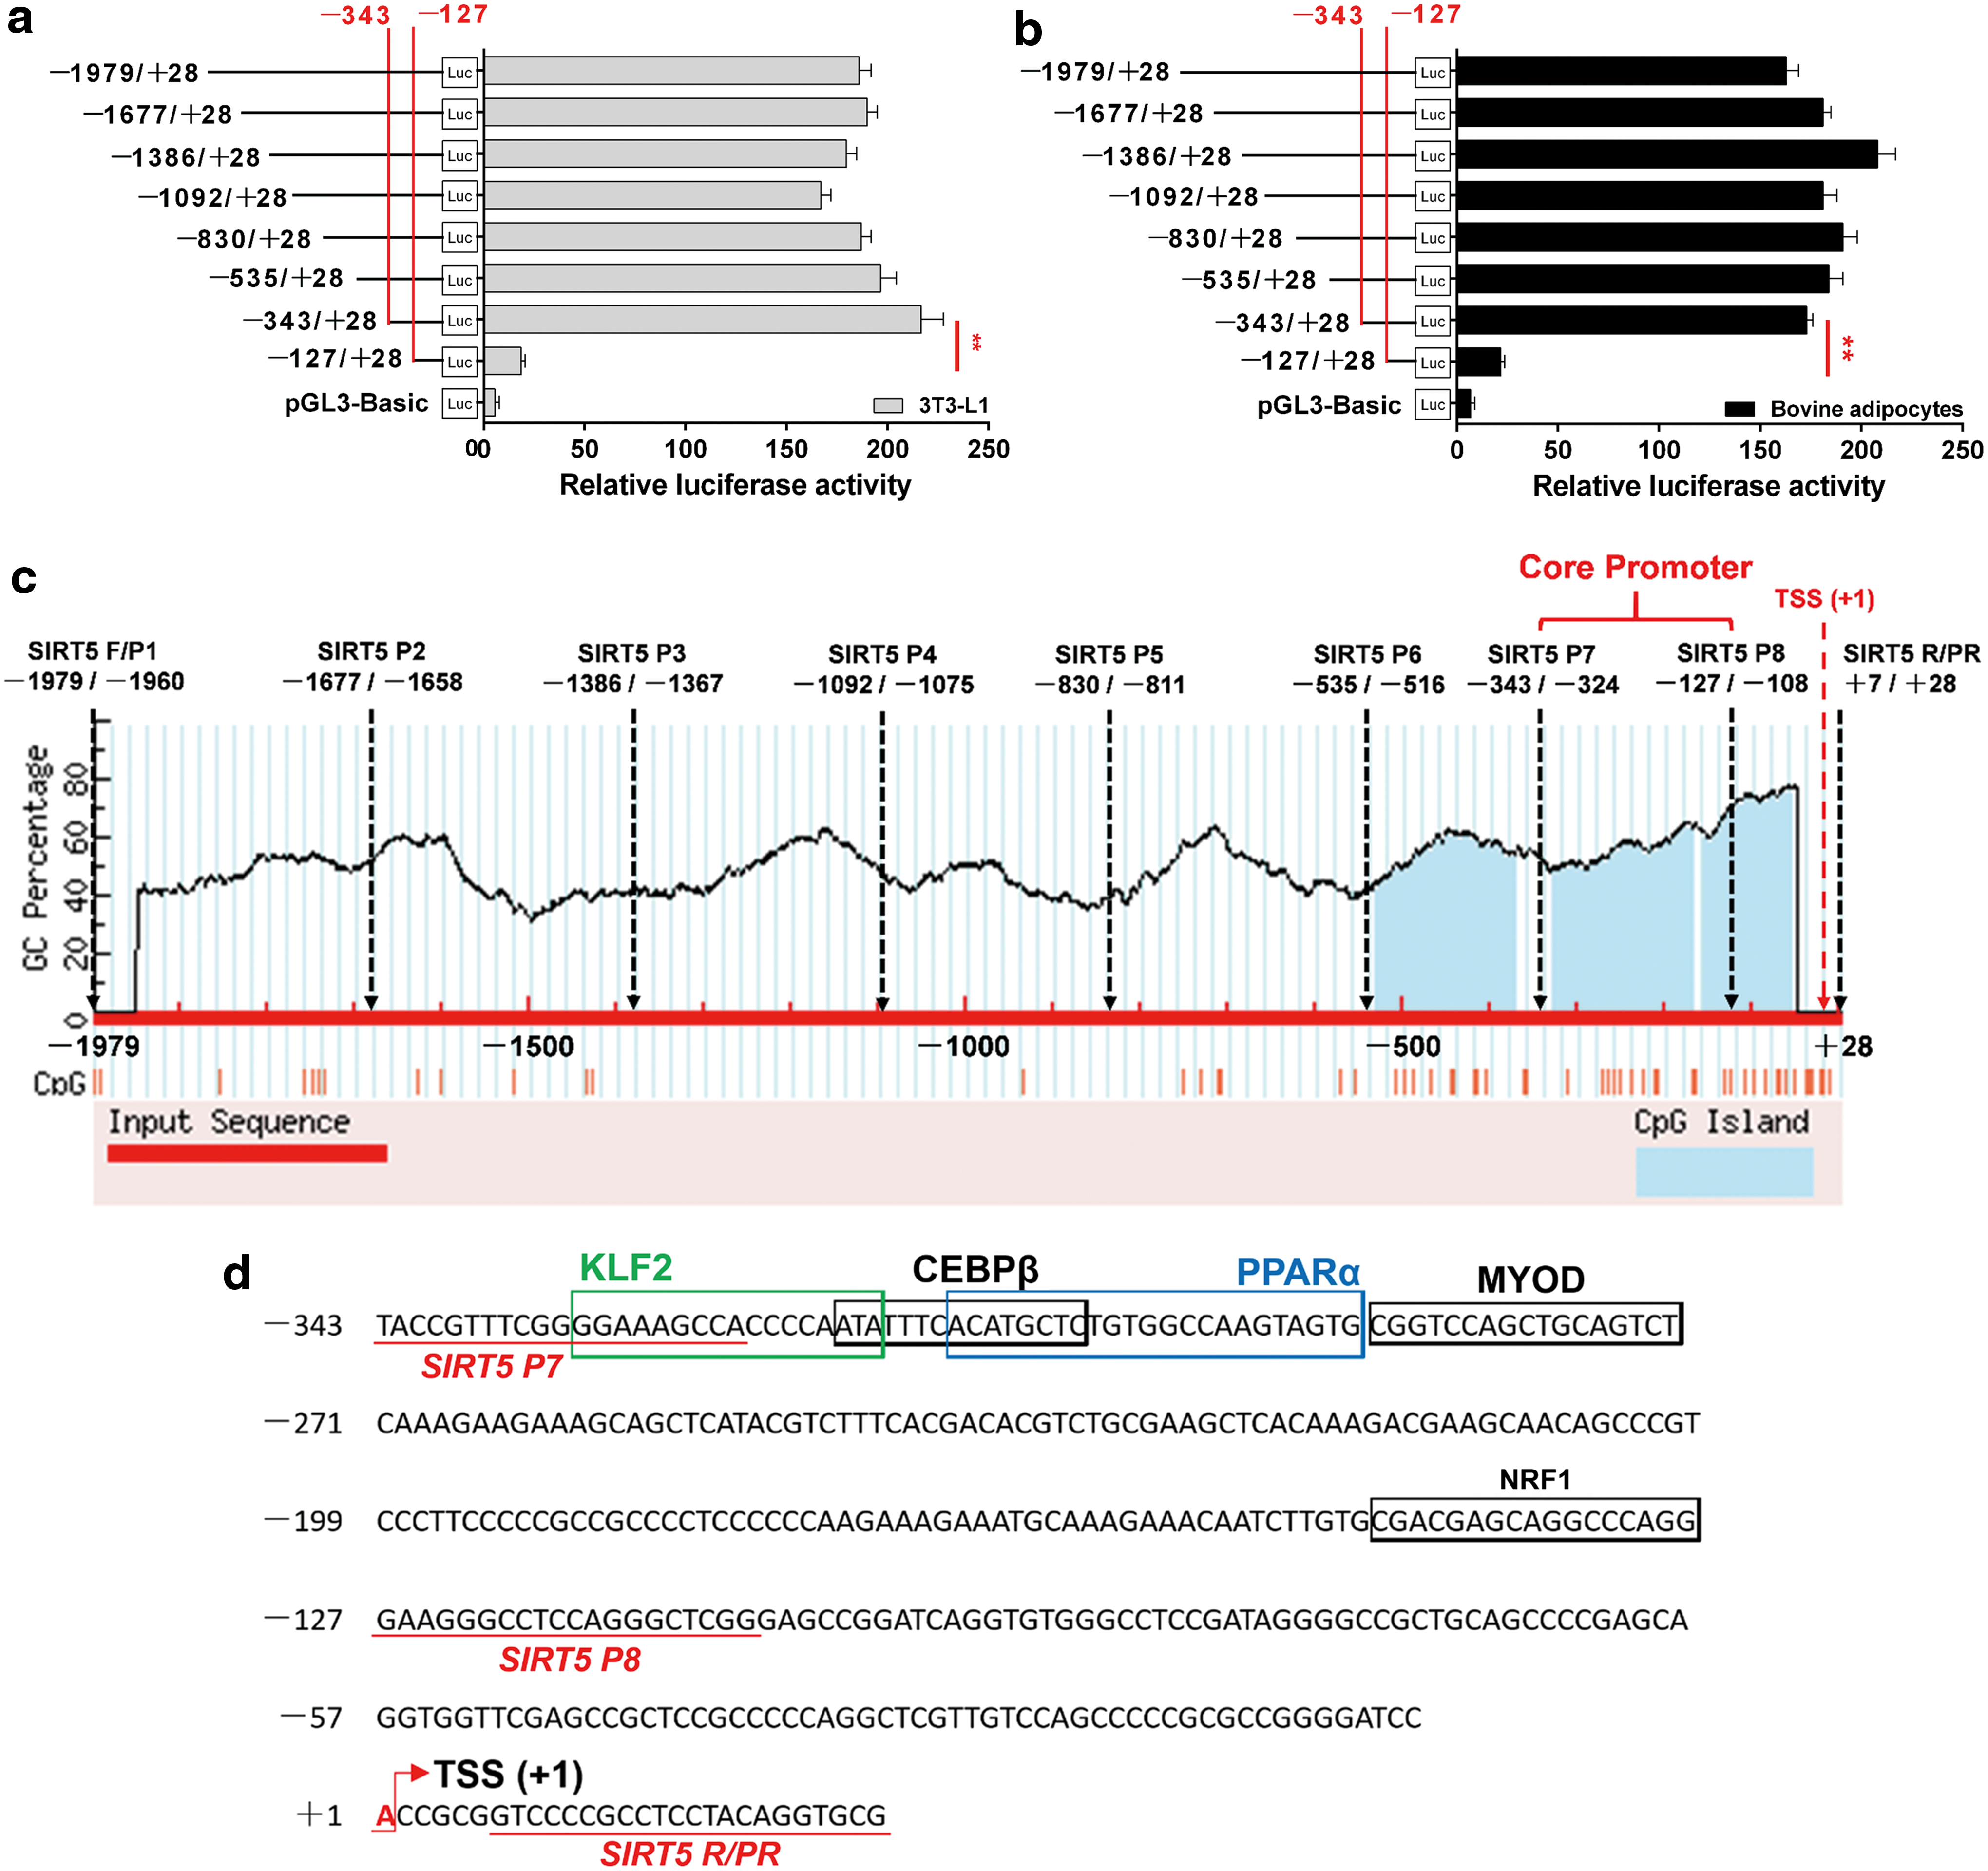
Isolation and sequence analysis of the functional proximal minimal promoter of SIRT5.
Identification of TF binding sites as transcriptional activators or repressors in the core promoter of SIRT5 in bovine adipocytes
To clarify the functions of TFs in the regulation of bovine SIRT5, we constructed a series of DNA plasmids with 4-bp point mutations in the TF binding sequence motif and transfected them into 3T3-L1 and bovine adipocytes, respectively. The results showed that a mutation in the CEBPβ site in the construct pGL-343/+28 resulted in a significant increase in SIRT5 promoter activity, while a mutation in the KLF2, PPARα, MYOD, and NRF1 sites in the construct pGL-343/+28 resulted in a significant decrease in SIRT5 promoter activity (Fig. 4a; p < 0.05).
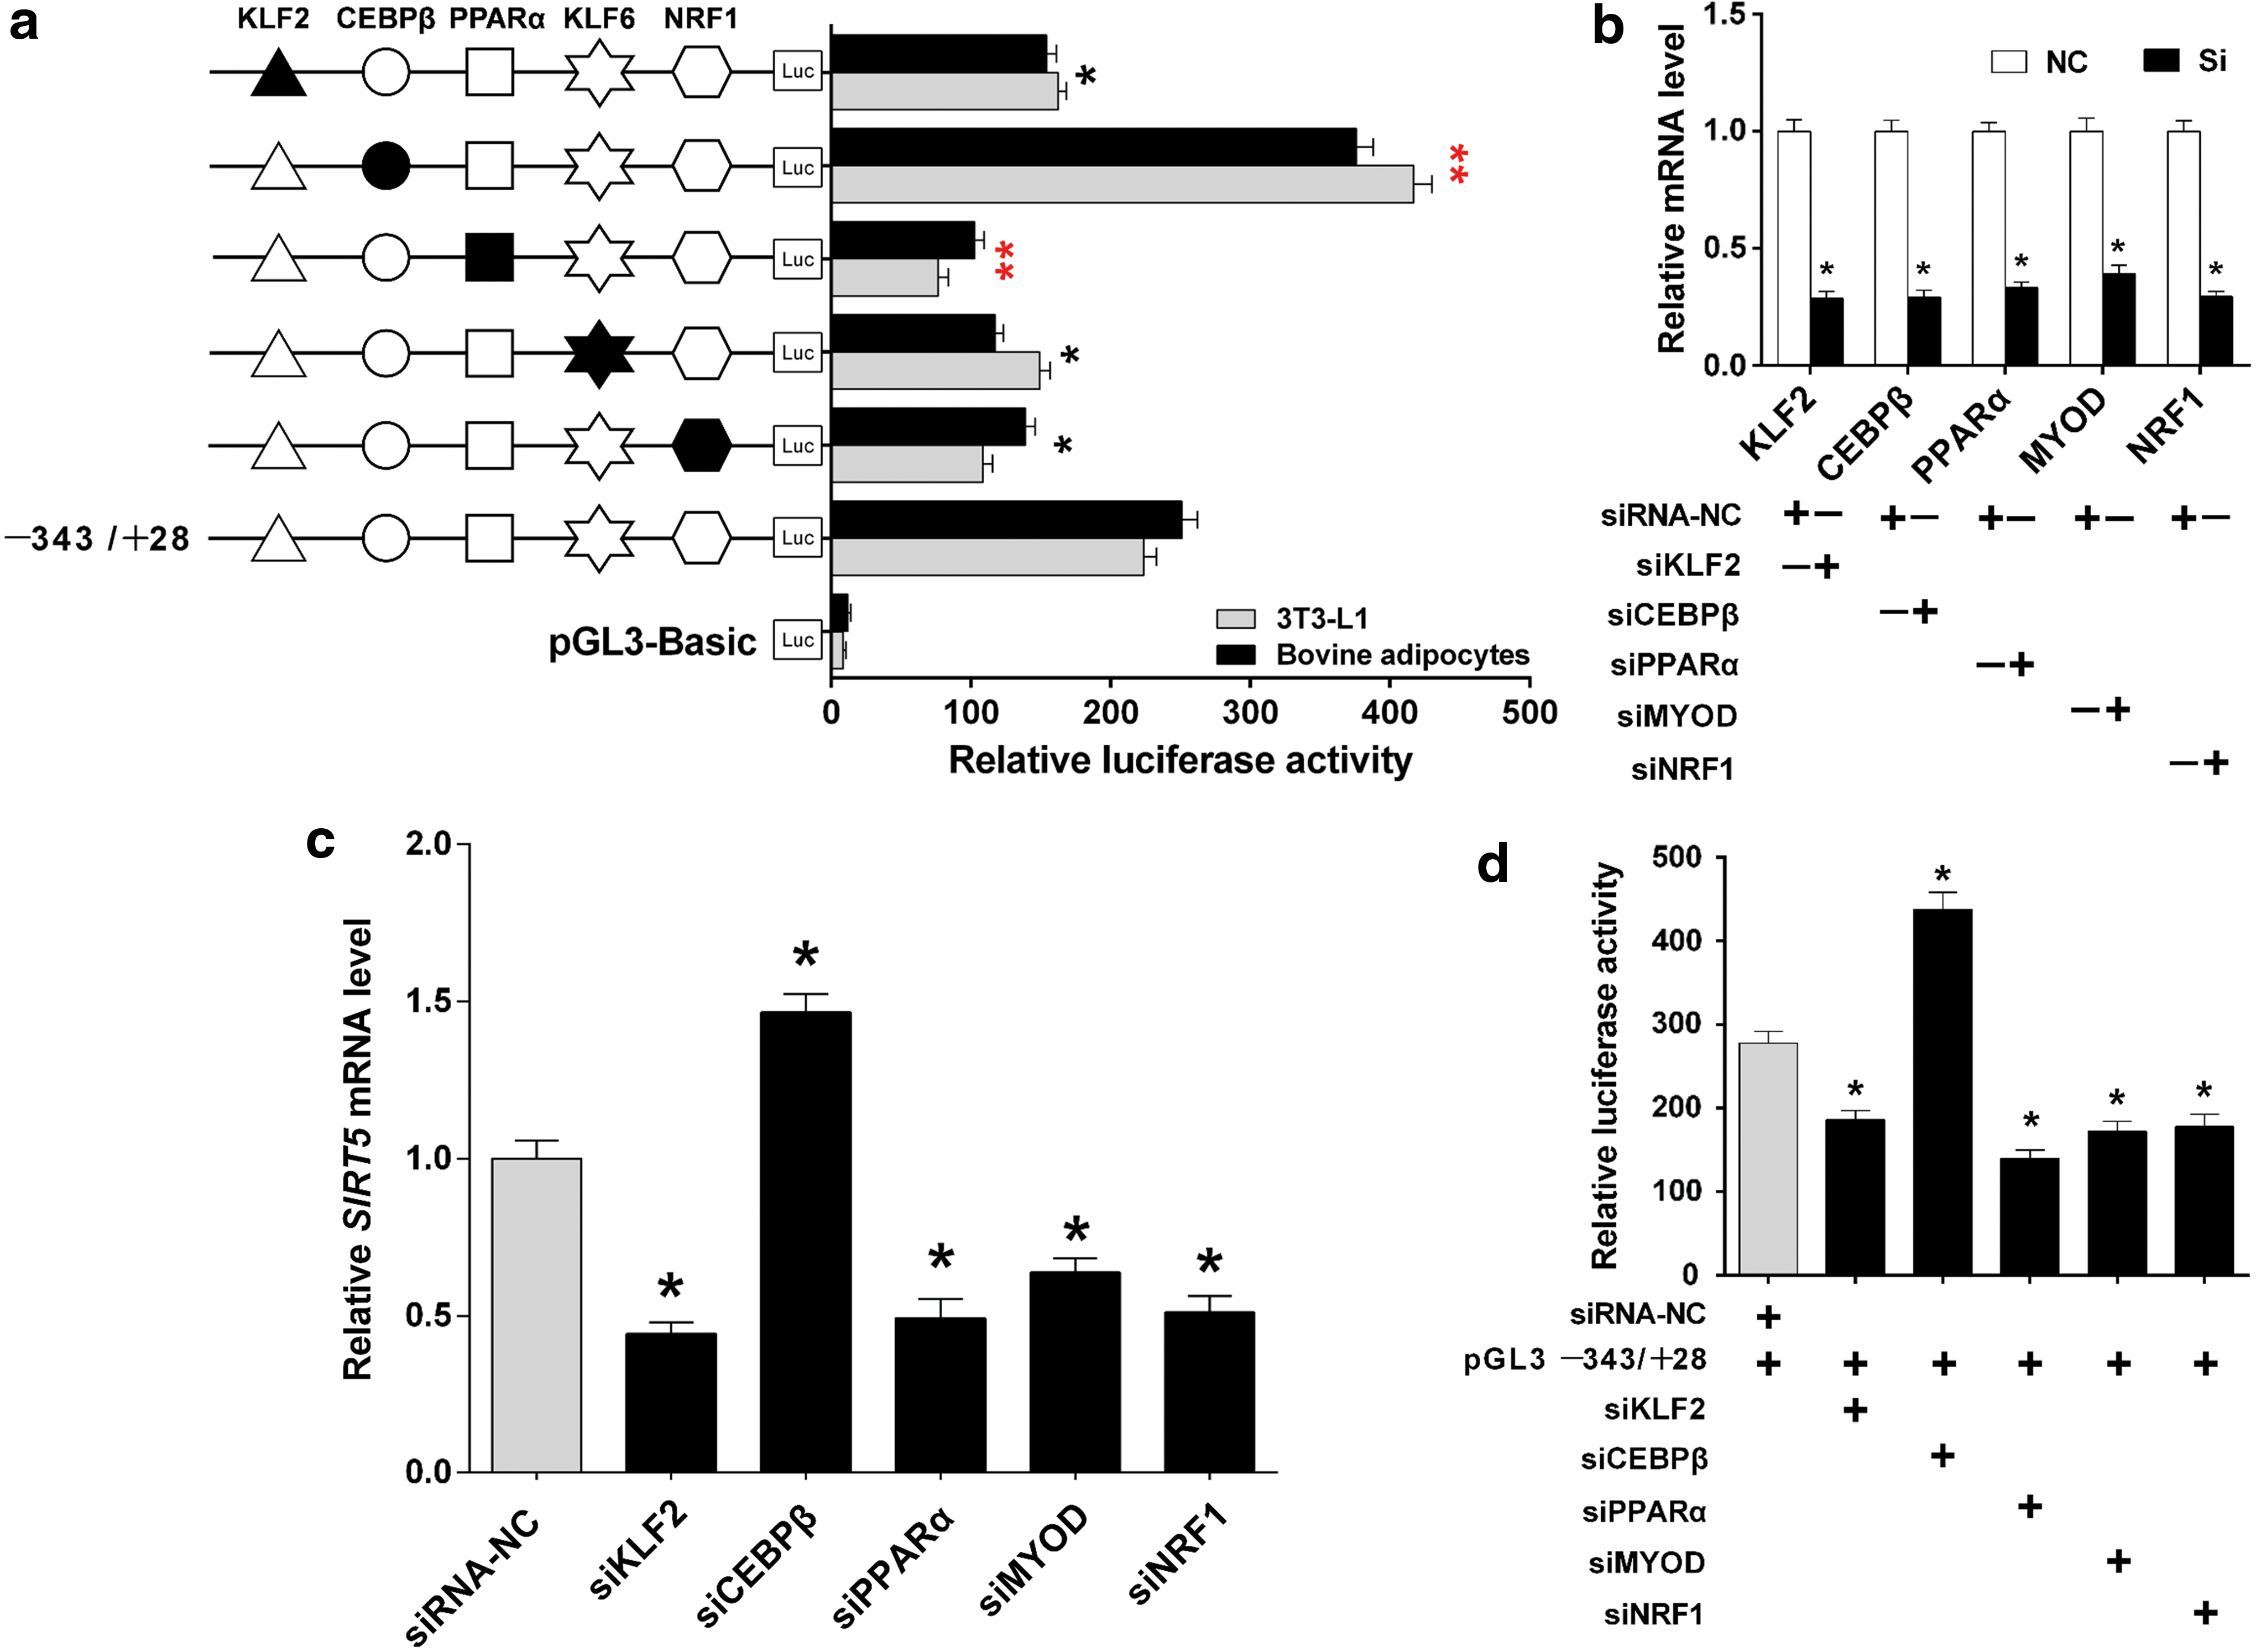
Identification of the KLF2, CEBPβ, PPARα, MYOD, and NRF1 binding sites for transcriptional activation or repression in the core promoter region of SIRT5.
Next, siRNAs targeting KLF2, CEBPβ, PPARα, MYOD, and NRF1 were designed and synthesized, and then transfected into bovine adipocytes to knock down the respective genes. The results indicated that the expression levels of these TFs were effectively reduced (Fig. 4b; p < 0.05). We then utilized these siRNAs to knock down the TFs to assess its effects on SIRT5 expression, respectively. The result showed that knockdown of KLF2, PPARα, MYOD, and NRF1 resulted in downregulated SIRT5 mRNA levels, while knockdown of CEBPβ upregulated SIRT5 mRNA level (Fig. 4c; p < 0.05). To further validate the potential TFs, siRNAs against the above TFs and pGL−343/+28 were co-transfected, which showed dramatically altered activity of the SIRT5 promoter. The transcriptional activity of the SIRT5 promoter was significantly decreased when KLF2, PPARα, MYOD, and NRF1 were knocked down, whereas it was increased when CEBPβ was knocked down (Fig. 4d; p < 0.05).
TFs bind to the proximal minimal promoter of SIRT5 in vitro
Electrophoretic mobility shift assays (EMSAs) were performed to determine the binding of KLF2, CEBPβ, PPARα, MYOD, and NRF1 on the SIRT5 promoter. As shown in Figure 5a, the nuclear protein from bovine adipocytes bound to the 5′-biotin-labeled KLF2 probes and formed one main complex (lane 2, Fig. 5a). Competition assays determined that the mutant probe had little effect on this complex (lane 3, Fig. 5a). Meanwhile, the specificity of the KLF2/DNA interaction was reduced by competition from excess nonlabeled DNA (lane 4, Fig. 5a). The last lane showed that the complex was supershifted upon incubation with KLF2-antibody (lane 5, Fig. 5a). CEBP
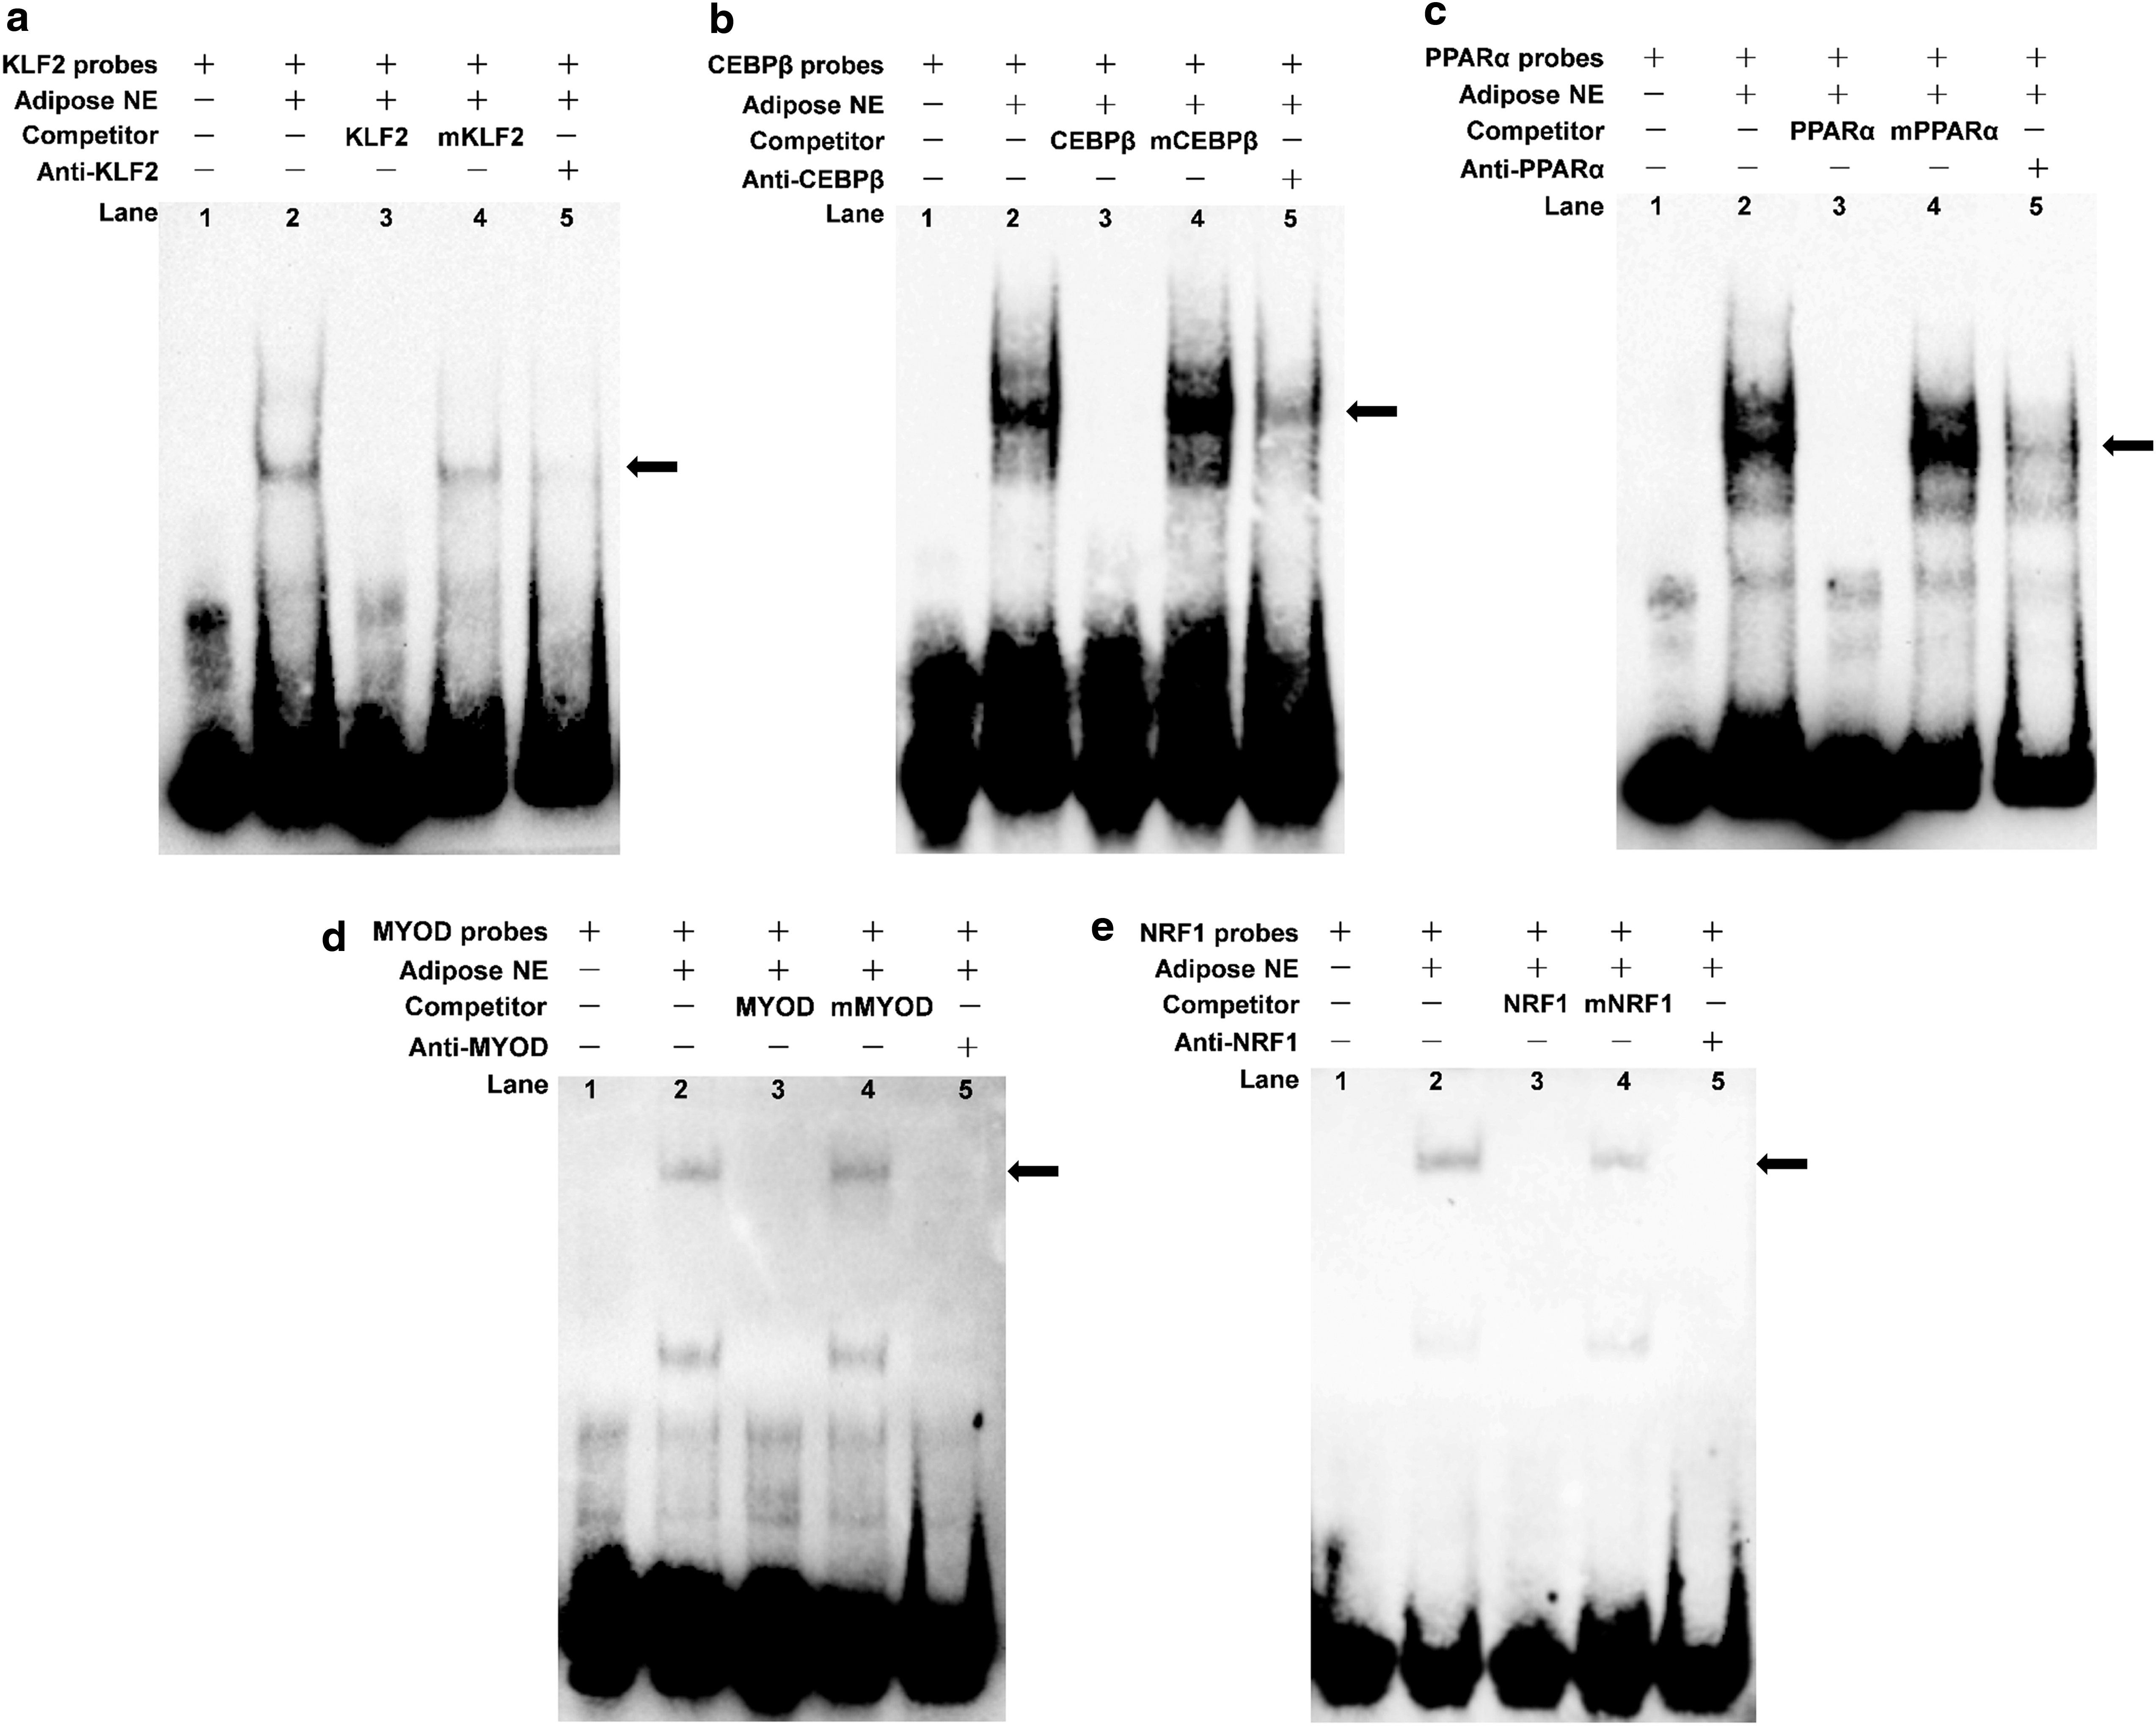
Evaluating the binding of
Discussion
Sirtuins have been reported to affect a variety of cellular processes such as aging, transcription, apoptosis, inflammation, stress resistance, and energy metabolism (Schlicker et al., 2008; Park et al., 2013). Most sirtuins are widely distributed in various tissues and organs, such as the liver, adipose tissue, bone muscle, and pancreas. For the regulation of metabolism, sirtuins directly interact with enzymes and alter enzymatic activities in metabolic reactions (Imai and Guarente, 2016). The dependence of sirtuins on NAD links their enzymatic activity directly to the energy status of the cell by the cellular NAD:NADH ratio (Imai and Guarente, 2016). However, since different TFs are expressed in different tissue or organ cells, certain sirtuins can exhibit different effects on metabolism (Ye et al., 2016).
Sirtuins can also control circadian clocks and mitochondrial biogenesis. Mitochondria function as the primary site of oxidative metabolism. Of the mitochondrial regulatory genes, the mitochondrial sirtuins (SIRT3, SIRT4, and SIRT5) play key roles in the regulation of basic mitochondrial functions (Vilkas, 2010). In addition to energy production, studies have indicated that mitochondria play critical roles in metabolism, cellular differentiation, apoptosis, and intracellular signaling (Finkel and Holbrook, 2000; Wallace, 2005), as well as in the maintenance and control of the cell cycle and cell growth (Du et al., 2011). Mitochondria are also the primary site of reactive oxygen species production, and the level of oxidative stress is one of the important regulatory factors of cell metabolism (Harman, 1956; Finkel and Holbrook, 2000). Mitochondrial biogenesis is in turn temporally coordinated with these cellular processes (Schlicker et al., 2008; Nakagawa et al., 2009). In different physiological conditions, mitochondria have the ability to alter their function, morphology, and quantity to adapt to changes in energy metabolism, temperature, and hormones (Scarpulla, 2002). The normal function of mitochondria is a prerequisite for the maintenance of metabolic homeostasis and cellular homeostasis; therefore, changes in mitochondria activity and quantity are tightly related to metabolic disorders and diseases, including aging, diabetes, obesity, cancer, and neurodegenerative diseases (Wallace, 2005).
We found relatively higher levels of SIRT5 expression in the testis, longissimus thoracis, brain, and subcutaneous fat. Furthermore, SIRT5 expression increased before the first day of differentiation and then decreased rapidly with the differentiation of bovine adipocytes. This result suggested that SIRT5 might play an important role in regulating the development of bovine adipose tissue. To clarify the regulatory mechanism of bovine SIRT5 expression, we analyzed the 5′ regulatory region of bovine SIRT5 using the Genomatix suite, and determined potential TF binding sites for KLF2, CEBPβ, PPARα, MYOD, and NRF1 at −343/−127 of the SIRT5 promoter. We then hypothesized that these potential TF binding motifs might play major roles in regulating the transcriptional activity of this gene.
Previous studies have confirmed that KLF2 is a negative regulator of adipocyte differentiation. Studies in 3T3-L1 and human primary cells showed that KLF2 was expressed in preadipocytes, but not in mature adipocytes. The overexpression of KLF2 inhibited adipocyte differentiation by inhibiting the promoter activities of genes encoding peroxisome proliferator-activated receptor gamma (PPARγ), CEBPα, promoter of genes encoding adipocyte determination- and differentiation-dependent factor 1 (ADD1), and sterol regulatory element binding protein 1c (SREBP1c) (Banerjee et al., 2003). KLF2 has been confirmed to prevent the differentiation of preadipocytes into adipocytes and has been shown to be involved in body weight control (Lee et al., 2010). CEBPs have been reported to be involved in cellular metabolism, proliferation, differentiation, inflammation, and numerous others, particularly in adipocytes, and are expressed in hepatocytes, adipocytes, hematopoietic cells, and many organs (Ramji and Foka, 2002). Recent studies have shown that, even in the absence of adipogenic stimuli, ectopic expression of CEBPβ in 3T3-L1 cells promoted adipogenesis (Cao et al., 1991; Yeh et al., 1995). How CEBPβ promotes adipogenesis greatly depends on the induction of the expression of master adipogenic TFs: PPARγ and CEBPα. PPARα is a major TF of lipid metabolism regulation in the liver, and it can be activated under conditions of energy deprivation, which is necessary for ketogenesis (Kersten et al., 1999). Activation of PPARα promotes the uptake, utilization, and catabolism of fatty acids by upregulation of genes involved in fatty acid transport, fatty acid binding and activation, and peroxisomal and mitochondrial fatty acid β-oxidation (Kersten, 2014). MyoD belongs to the family of myogenic regulatory factors, and plays a major role in regulating muscle differentiation (Rudnicki et al., 1993). Sustained expression of MyoD is necessary for retaining the expression of other muscle-related genes (Fong and Tapscott, 2013). The main function of MyoD in development is to commit mesoderm cells to a skeletal myoblast lineage and continue regulation (Hughes et al., 1997). MyoD also regulates muscle repair and might be an important effector for the fast-twitch muscle fiber phenotype (Ehlers et al., 2014). NRF1 has an important function in integrating the transcription of nuclear-encoded and mitochondrial-encoded genes, both essential for higher mitochondrial fatty acid β-oxidation capacity (Leal et al., 2012; Widenmaier et al., 2017). NRF1 also activates the expression of some key metabolic genes that regulate cellular growth, nuclear genes required for respiration, heme biosynthesis, and mitochondrial DNA transcription and replication, while also linking the transcriptional modulation of key metabolic genes to cellular growth and development (Lezza et al., 2001; Adam et al., 2010; Radde et al., 2016).
Conclusion
In this study, we found that SIRT5 was highly expressed in the bovine testis, followed by the longissimus thoracis and subcutaneous adipose tissue, and mRNA levels of SIRT5 in the process of adipocytes differentiation increased before the first day and then decreased rapidly. We identified the core promoter of the bovine SIRT5, and determined that SIRT5 was regulated by various TFs, including KLF2, CEBPβ, PPARα, MYOD, and NRF1. In addition, we found that KLF2, PPARα, MYOD, and NRF1 are novel transcriptional enhancers, while CEBPβ was a transcriptional suppressor of SIRT5 by binding to core promoter. These data provide a foundation for a better understanding of the temporal and spatial expression pattern, transcriptional regulation mechanism, and biological function of the bovine SIRT5 (Fig. 6).

Proposed schematic summary on the regulation of SIRT5 transcriptional activity in bovine adipocytes by TFs, including KLF2, CEBPβ, PPARα, MYOD, and NRF1. TSS, transcriptional start site. Color images available online at
Footnotes
Acknowledgments
This study is supported by the National Modern Agricultural Industry Special Program (No. CARS-37), National 863 Program of China (No. 2013AA102505), National Science and Technology Support Projects (No. 2015BAD03B04), Shaanxi Technological Innovation Engineering Program (No. 2014KTZB02-02-01), and the National Natural Science Foundation of China (No. 31501937).
Disclosure Statement
No competing financial interests exist.