




Abstract
Although the morbidity and mortality rates of prostate cancer (PCa) are considerably high, many PCas are characterized as indolent and slow growing, which do not require overtreatment. Overdiagnosis and overtreatment of early detected PCa are an emerging problem, owing to a lack of biomarkers that detect advanced disease at an earlier stage. In this study, RNA-Seq data of 57,045 genes for 495 PCa samples and 52 normal samples in the The Cancer Genome Atlas (TCGA) database were downloaded. Subsequently, we performed weighted gene coexpression network analysis to identify the Gleason score-related coexpression gene module, and further screened out oncogenes and tumor suppressors that were upregulated or downregulated in the early stage of PCa as well as those related to the clinical prognosis of PCa patients. Based on this study, some novel biomarkers were identified for the disease-free survival, which are helpful for fast diagnosis and prognosis.
Introduction
Prostate cancer (PCa) is the most common noncutaneous cancer among adult men, and the second most common cause of male cancer-related deaths in the Western world (Jemal et al., 2011; Thorne et al., 2011). In China, for the past few decades, the incidence of PCa has significantly increased in urban areas. Moreover, the mortality rate in rural areas has become high (Ye and Zhu, 2015). Although the morbidity and mortality rates of PCa are considerably high, a large number PCas are characterized as indolent and slow growing, which does not require intervention. Overdiagnosis and overtreatment of early detected PCa are emerging problems as a result of the lack of biomarkers that can be detected at early stages of advanced disease.
The current diagnosis method of PCa includes digital rectal examination, prostate-specific antigen test, and subsequent biopsies for histopathological staging. Nonetheless, each strategy has its deficiency and may result in overtreatment of low-risk patients and nonessential radical prostatectomies. It is challenging to distinguish between patients who benefit from active surveillance, those who need to be identified for primary treatment and those who need treatment upgrades; this is an issue that is gradually developing. It is urgent to identify early stage biomarkers that can also be used to predict the clinical prognosis of patients. The Gleason grading system is used to help evaluate the prognosis of patients with PCa by using samples from a prostate biopsy. Together with other parameters, it is incorporated into a strategy of PCa staging that predicts prognosis and helps to guide therapy.
In this study, we perform weighted gene coexpression network analysis (WGCNA) to identify the Gleason score related to the coexpression gene module (CEM), and further screen for oncogenes and tumor suppressors that are related to the clinical prognosis of PCa patients (Supplementary Fig. S1).
Materials and Methods
Publically available clinical data sets
RNA-seq (Illumina RNASeqV2, Level 3; Illumina, San Diego, CA) fpkm (fragments per kilobase of transcript per million mapped reads) of PCa were downloaded from The Cancer Genome Atlas (TCGA;
WGCNA
We matched the RNA-seq data to the clinical trait, and obtained 52 normal samples and 495 tumor samples. Genes with low expression in 547 prostate samples (mean + standard deviation <1) were discarded. We matched the samples to their clinical traits such as normal, Gleason ≤6, Gleason 3 + 4, Gleason 4 + 3, and Gleason ≥8. The top 5000 genes with the median standard deviation were used to perform WGCNA (Langfelder and Horvath, 2008; Langfelder and Horvath, 2012). The highest correlation modules enter our sight (red and yellow module). The genes with topological overlap matrix (TOM) value ≥0.1 were outputted to Cytoscape (Shannon et al., 2003).
Gene ontology and Kyoto Encyclopedia of Genes and Genomes analysis
Gene ontology (GO) and Kyoto Encyclopedia of Genes and Genomes (KEGG) pathway analysis were performed on genes in the identified modules separately by David. The p-values of GO terms and KEGG terms ≤0.05 were selected.
Oncogenes and tumor suppressor genes
We get the total oncogenes and tumor suppressor genes from the Oncogene and Tumor Suppressor Gene website. We overlapped the genes with significant survival curves and oncogenes or tumor suppressor genes, individually of red or yellow module.
Kaplan–Meier plotter analysis
The Kaplan–Meier plotter (Györffy et al., 2010) is a database that can be used to assess the effect of 54,675 genes on survival using 10,461 cancer samples (breast, ovarian, lung, and gastric cancer). Data were obtained before January 18, 2019. Patients were divided into high and low expression groups, based on the upper quartile and the lower quartile of the selected gene expression levels, and the overall survival was performed using log-rank test.
Statistical analysis
Kaplan–Meier curves of p-values calculated by log-rank test were used to represent the survival distributions between “high” and “low” expression groups (defined by median value of each gene expression). Log rank p-value, which calculated by R survival package, ≤0.05 were considered statistically significant. Spearman correlation analysis was used to estimate the filtered genes expression in differential clinical traits.
Results
Gleason score-related CEM analysis
To identify the Gleason score-related CEMs, we performed WGCNA. We selected the appropriate soft threshold power (SFT = 5) to construct scale-free coexpression networks (Supplementary Fig. S2). A total of 16 weighted coexpression modules were obtained. Figure 1A depicts the cluster dendrogram of 16 identified modules in different colors. Figure 1B shows the correlation between the identified modules and the clinical features such as the Gleason score, pathological T stage, pathological N stage, and disease-free survival (DFS) statues. The correlation pattern between each module and each feature is approximately similar. Green/yellow (0.39, 6e-22), red (0.37, 1e-18), magenta (0.38, 2e-19), and yellow (0.36, 2e-17) modules had the highest correlation coefficient between the modules and the Gleason score.
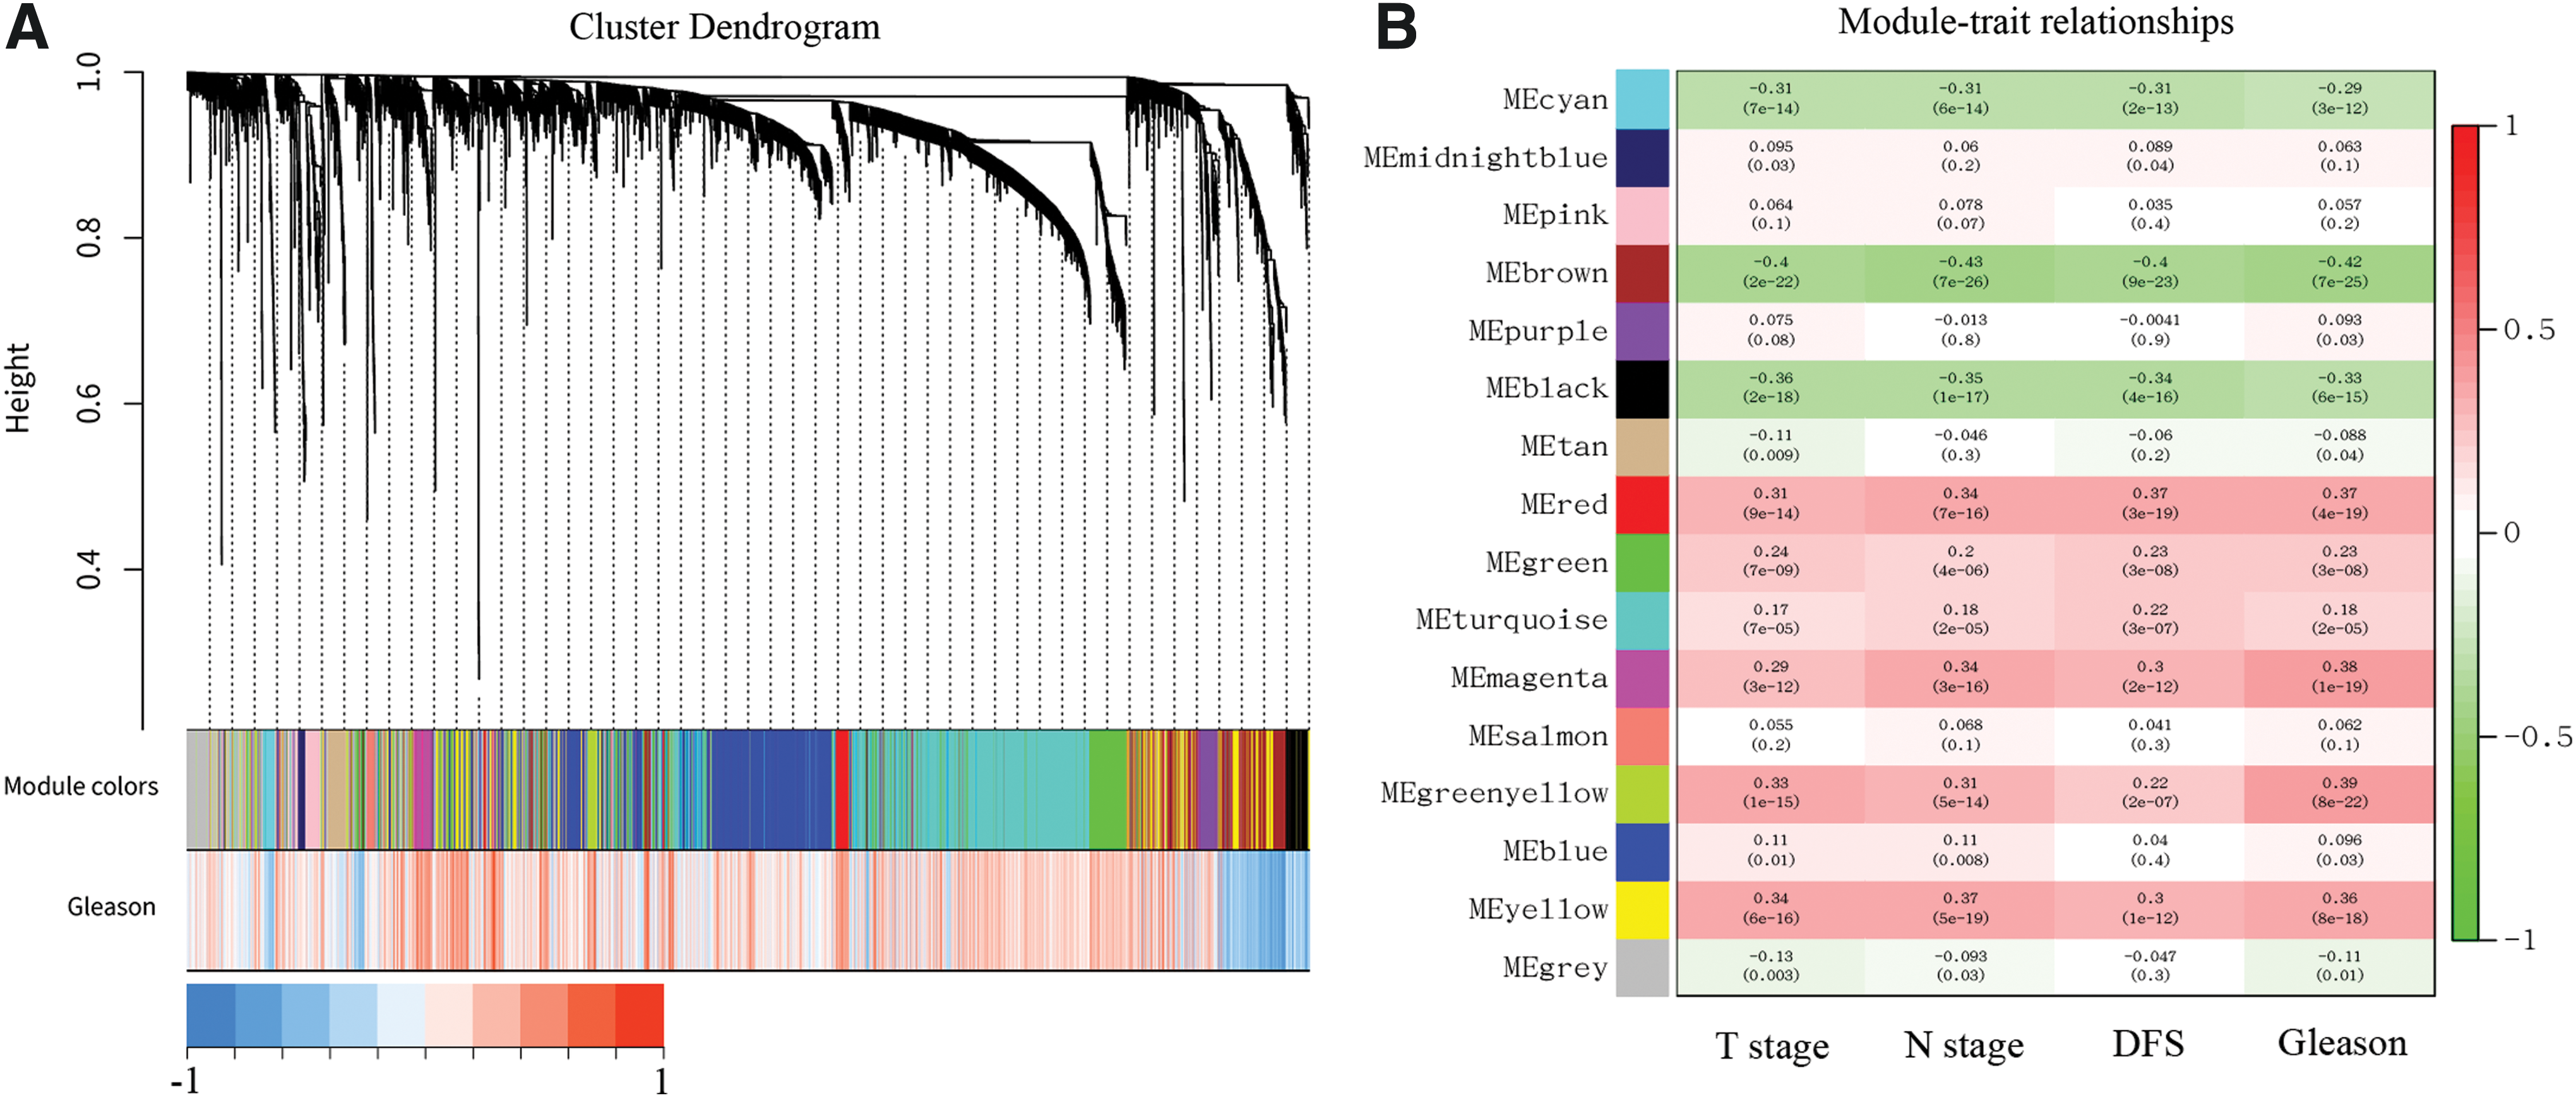
Gleason score-related CEM analysis.
GO and KEGG pathway analysis of the Gleason score-related CEMs
At this point, we focused on genes in green/yellow (92 genes), red (148 genes), magenta (103 genes), and yellow (431 genes) modules. GO and KEGG pathway analysis were performed on genes in the identified modules separately. Among the most enriched GO terms were cell proliferation (found in red and green/yellow modules) and RNA splicing (found in red and magenta modules) (Supplementary Table S1). KEGG analysis shows that genes in the red module are highly enriched in the Notch signaling pathway, genes in the yellow module are significantly clustered in amino acid and glucose metabolism-related pathways, and genes in the magenta module are considerably associated with herpes simplex virus (HSV) infection (Supplementary Table S2).
Hub genes analysis in identified modules
Furthermore, we explored correlations between gene significance (GS) and module membership (MM) for the identified modules. As a result, significant positive correlations between GS and MM were observed in red (cor = 0.77, p = 2.7e-30) and yellow (cor = 0.89, p = 2.1e-148) modules (Fig. 2A–D). Supplementary Figure S3A, B shows a Cytoscape plot among the most connected genes in the red and yellow modules (filtered hub genes by TOM value higher and equal 0.1).
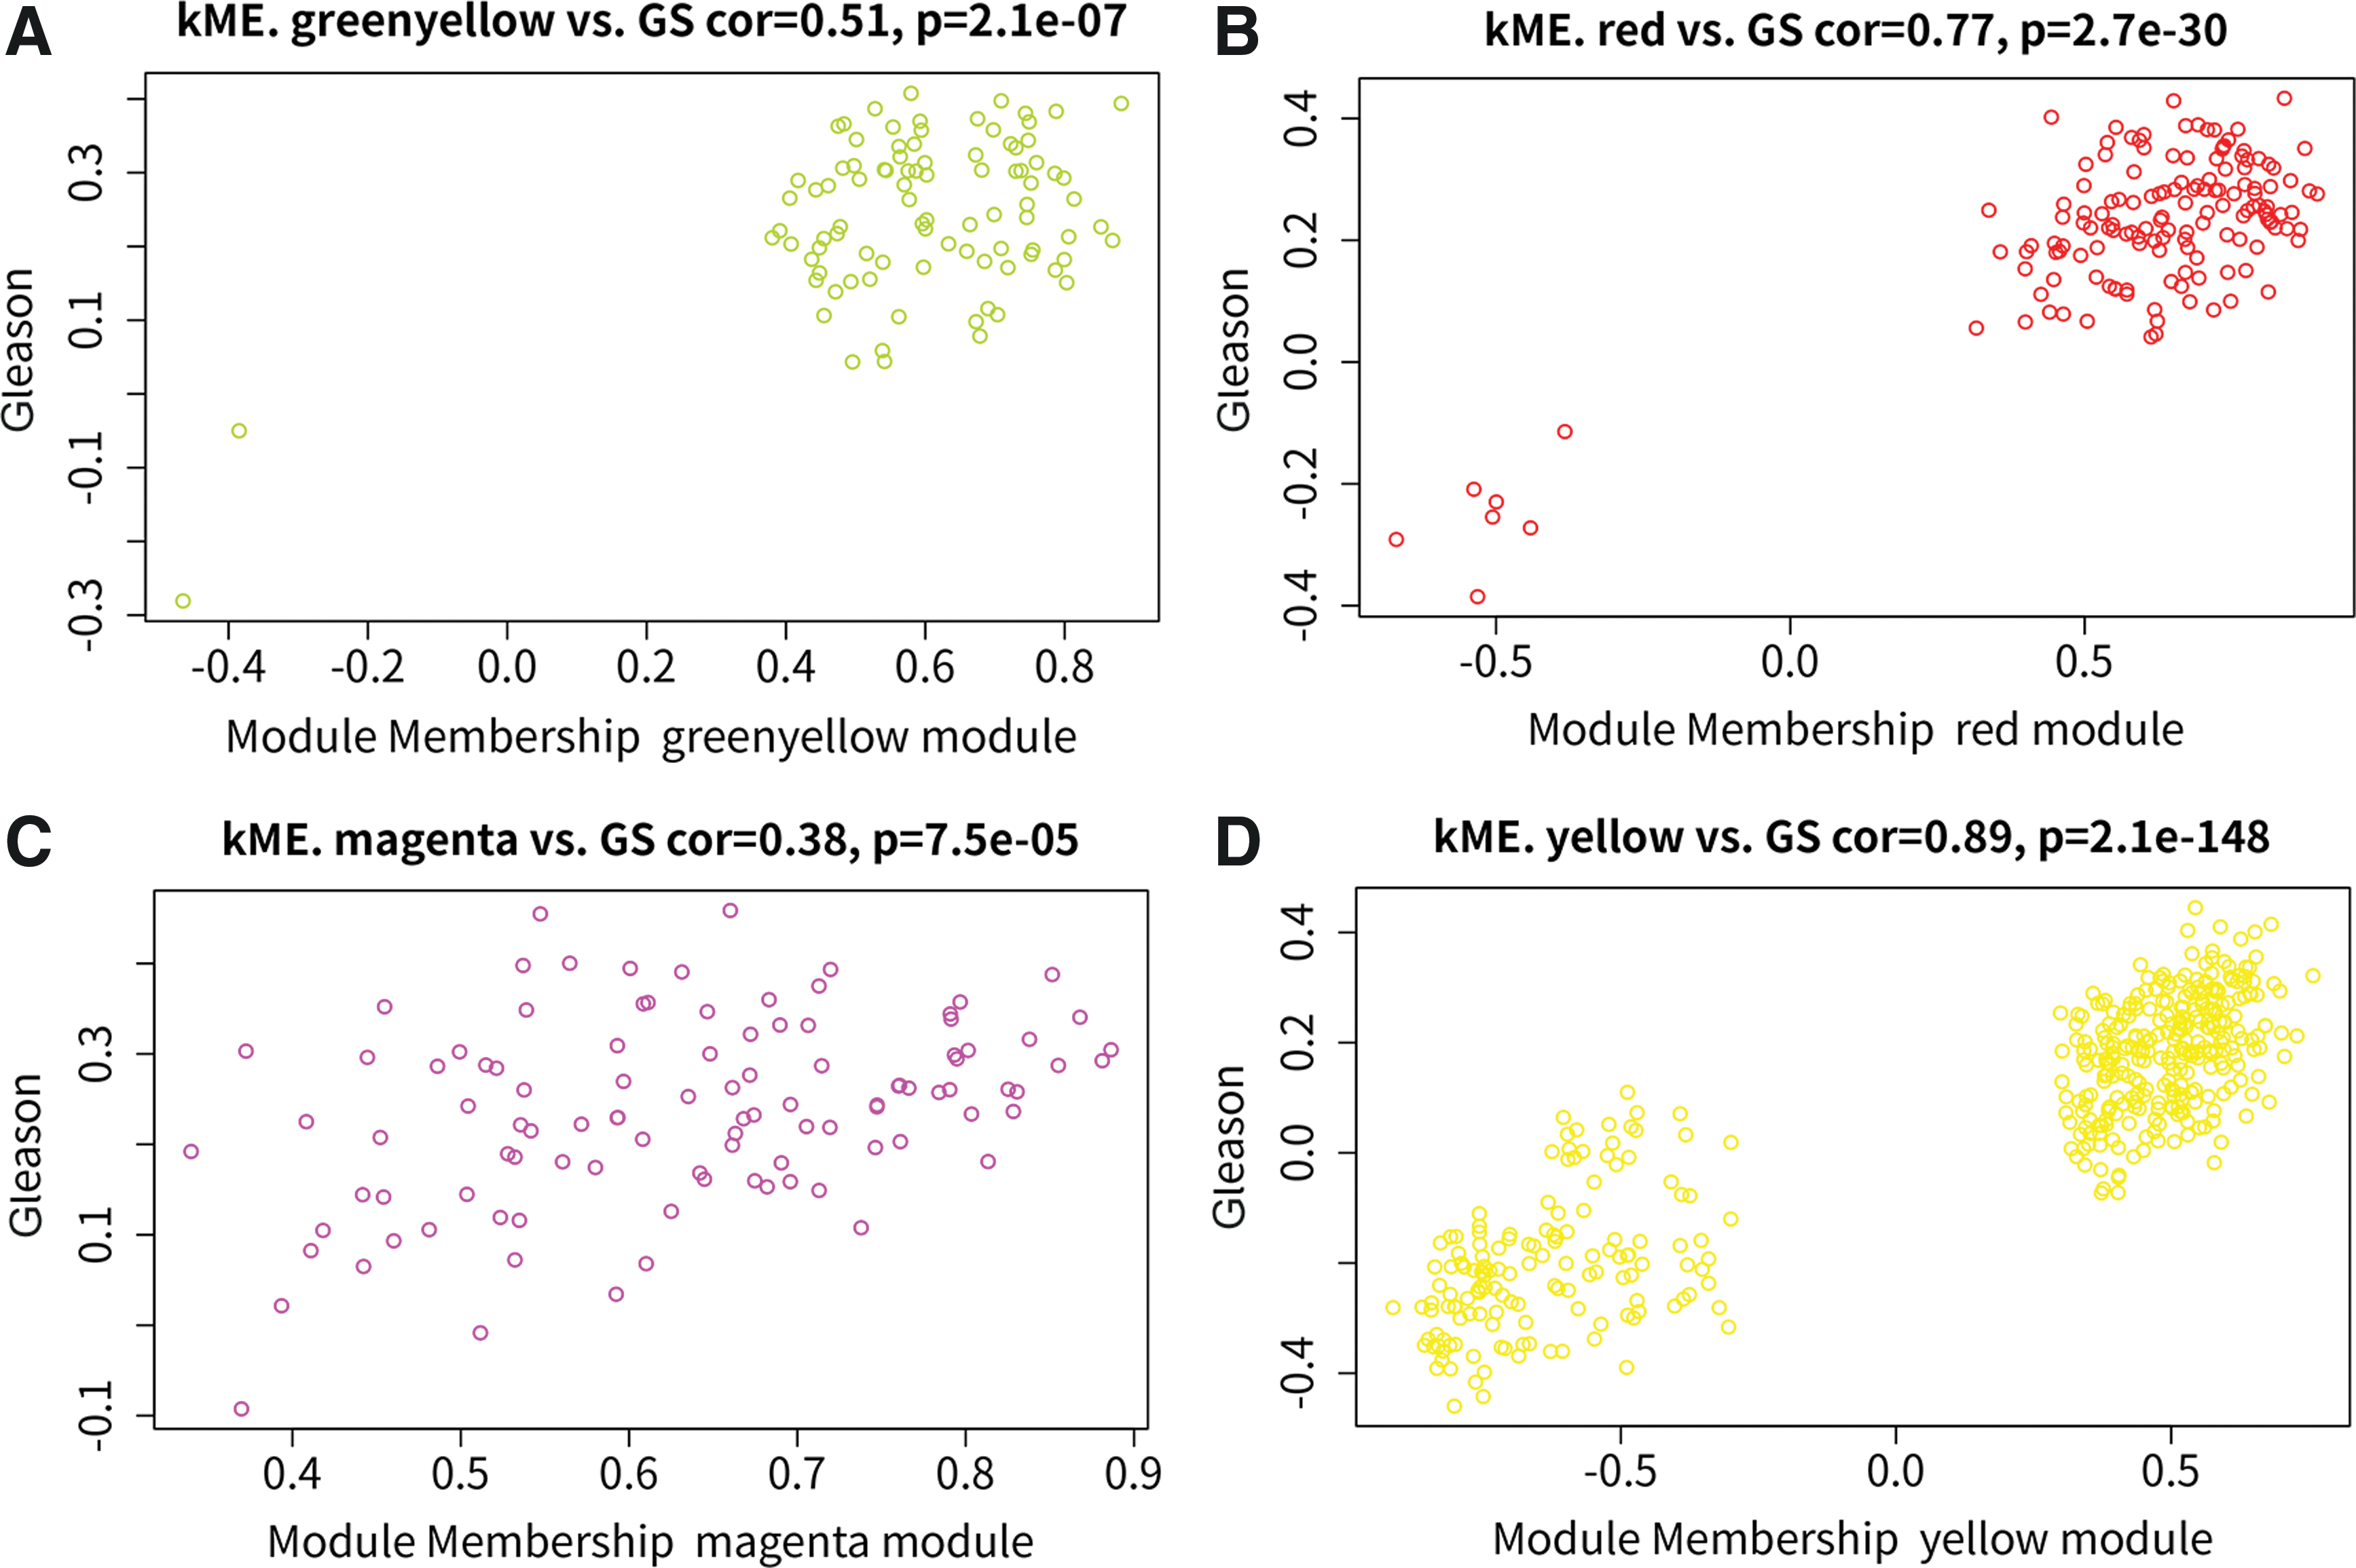
Hub genes analysis in identified modules. Correlations between gene significance and module membership of
Selection of oncogenes and tumor suppressors in Gleason score-related CEMs
Currently, 803 oncogenes and 1217 tumor suppressor genes have been defined by human cancer studies (
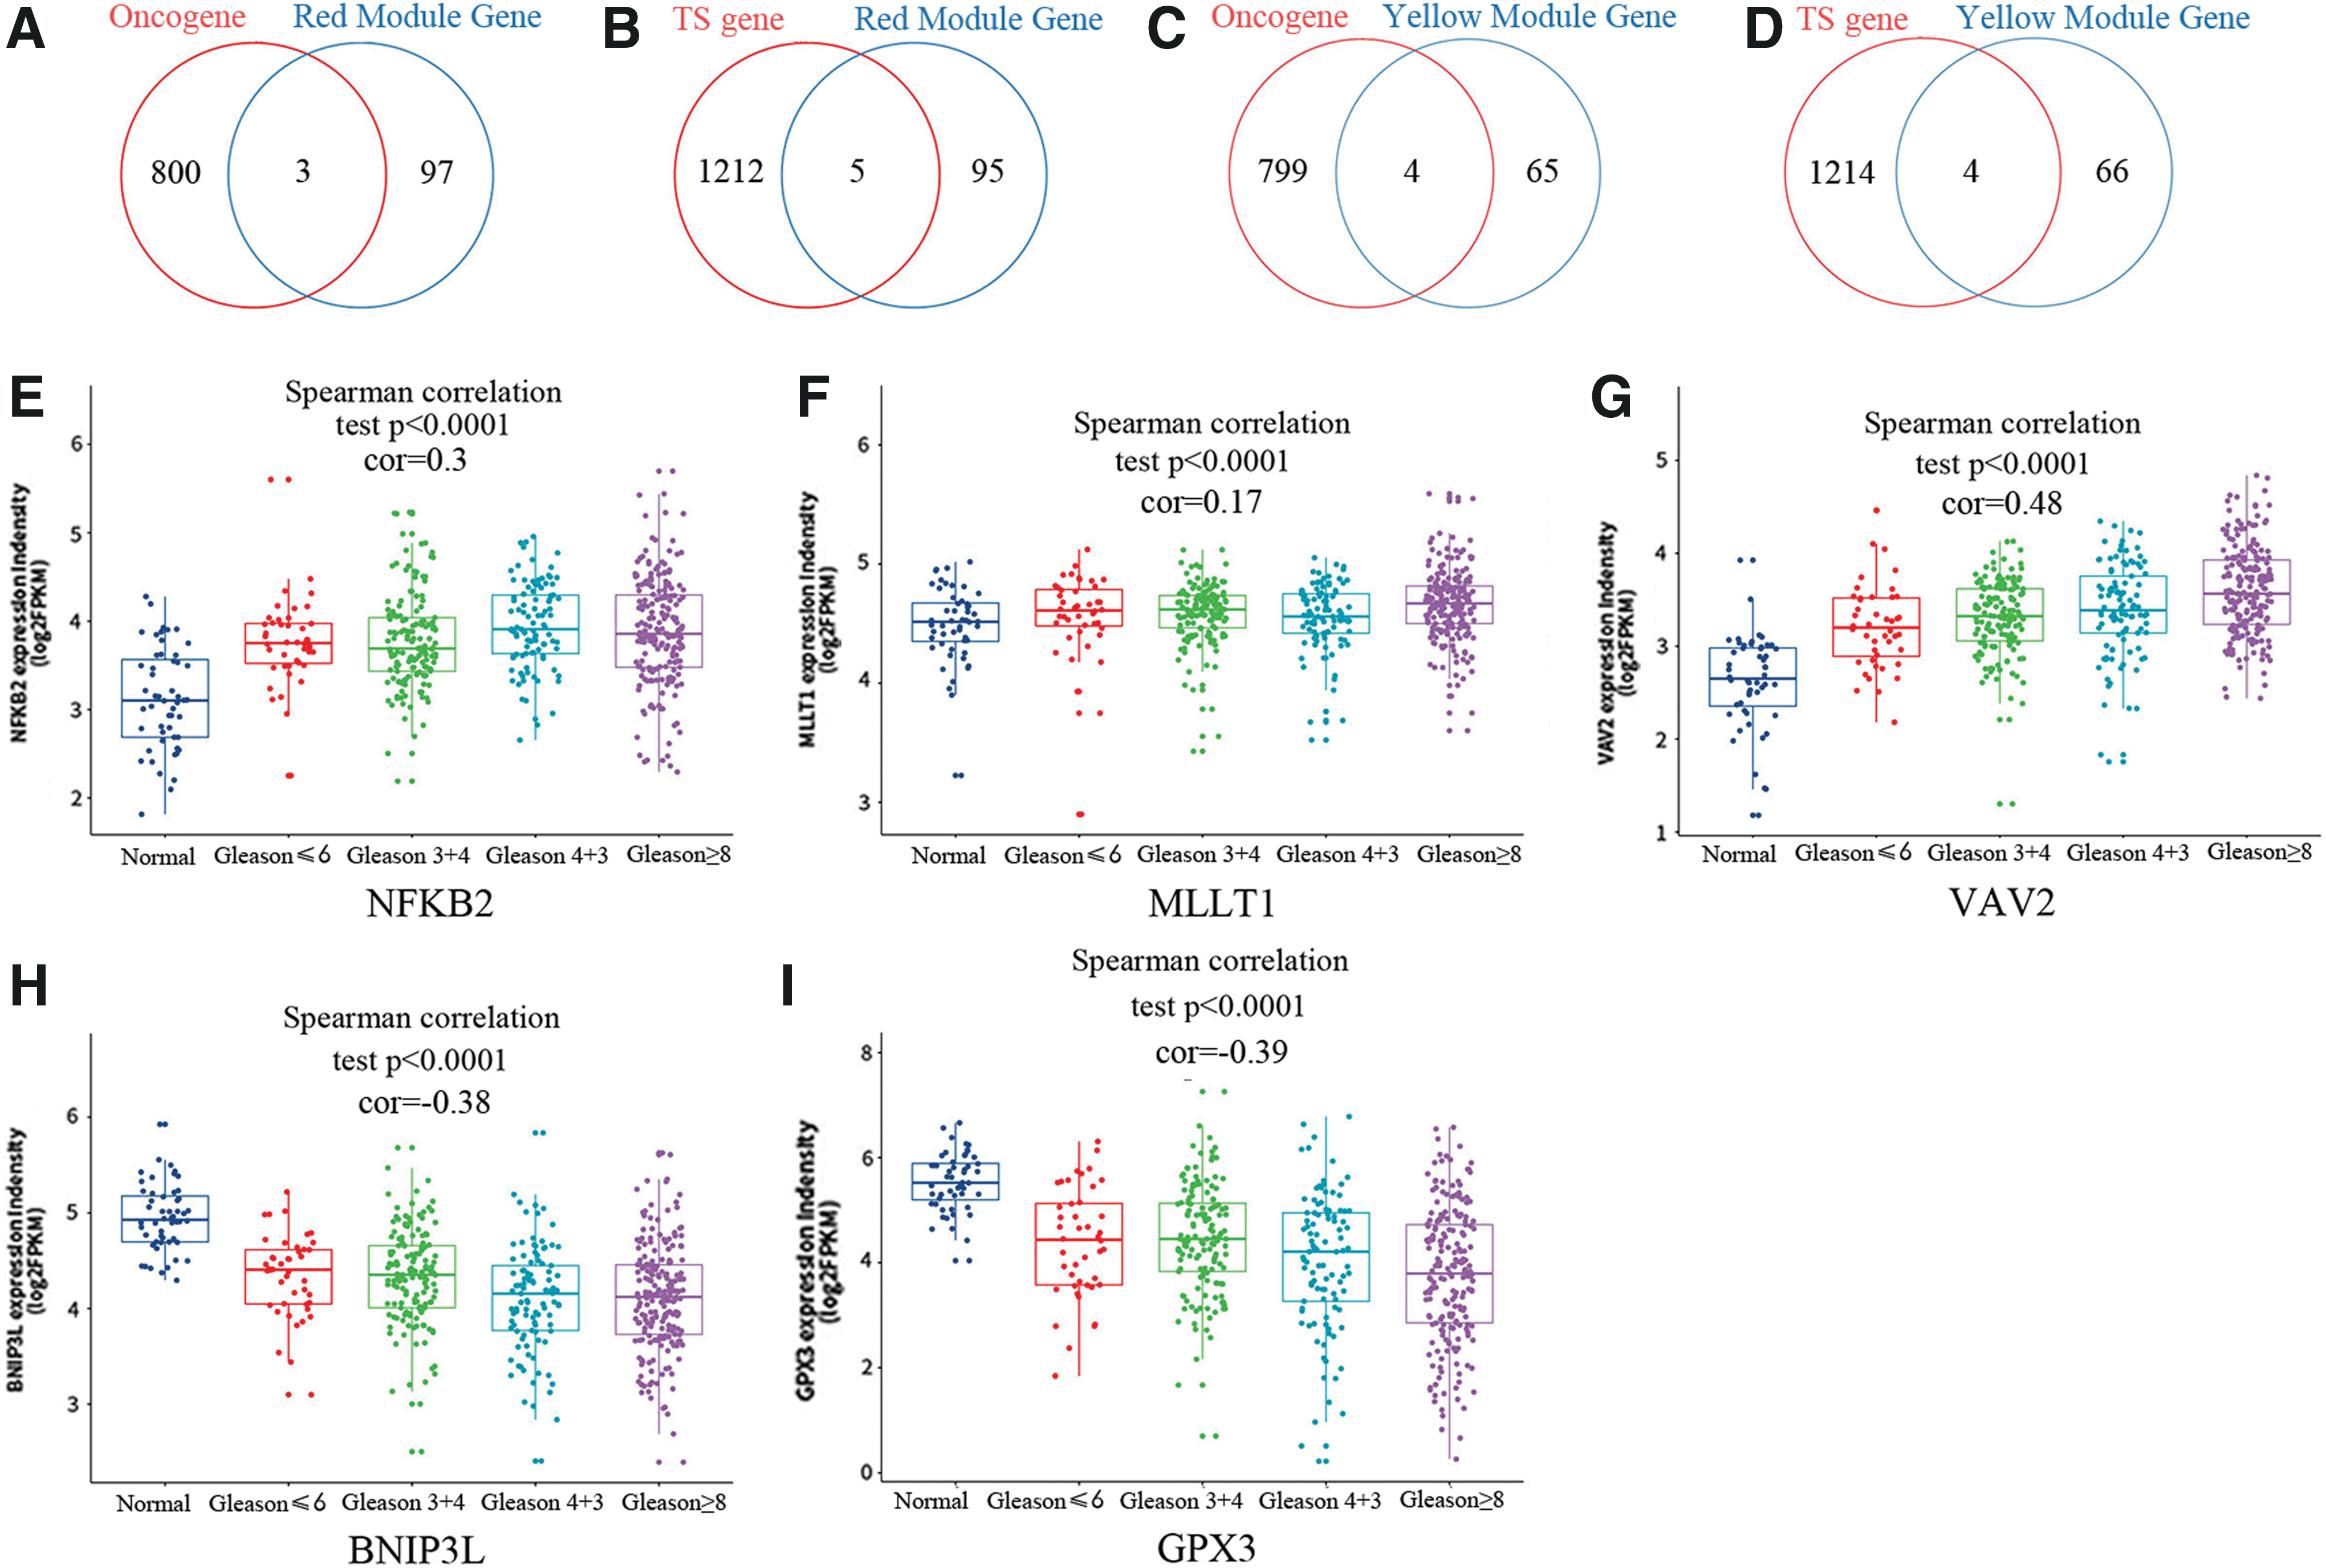
Selection of oncogenes and tumor suppressors (TSs) in Gleason score-related CEMs. Schematic diagram depicting the genes overlap between
Survival analysis of the three oncogenes and the two tumor suppressors
A total of 495 PCa patients were stratified into two groups (high expression vs. low expression) according to the median expression level. Kaplan–Meier survival analysis revealed that a lower expression of three oncogenes (NF-κB2, MLLT1, and VAV2) and a higher expression of two tumor suppressors (BNIP3L and GPX3) were associated with a better DFS (Fig. 4A–E). In addition, a univariate Cox proportional hazards regression analysis revealed that five genes were significantly associated with the survival of 495 PCa patients (Supplementary Table S3). Subsequently, we performed the same analysis on published data sets (GSE21034 and GSE54460) and further demonstrated that a lower VAV2 expression and higher expression of BNIP3L and GPX3 are associated with a better DFS in both Kaplan–Meier analysis (Supplementary Fig. S5A–F) and univariate Cox regression (Supplementary Tables S4, S5). The expression patterns of these genes are correlated with the Gleason score (WGCNA), and the gene expression levels are associated with prognosis. This suggests that the mentioned genes may play an important role in the pathogenesis of PCa.

Kaplan–Meier survival analysis of the three oncogenes and the two tumor suppressors. Kaplan–Meier survival analysis for the relationship between survival time and
Prognostic value of identified genes for other types of cancer
According to the newest incidence of cancer (Bray et al., 2018), we selected breast, gastric, lung, and ovarian cancers to further investigate the link between deregulated expression of the five identified genes and clinical outcome using a Kaplan–Meier plotter (Györffy et al., 2010). The results show that elevated VAV2 mRNA levels significantly correlated with lower overall survival of breast, gastric, lung, and ovarian cancer patients, as well as elevated NF-κB2 mRNA levels significantly correlated with lower overall survival of lung cancer patients (Supplementary Fig. S6). What is more, elevated BNIP3L mRNA levels significantly correlated with higher overall survival of breast and lung cancer patients, as well as elevated GPX3 mRNA levels significantly correlated with higher overall survival of gastric and lung cancer patients (Supplementary Fig. S6). Together, the results indicate that dysregulated VAV2, BNIP3L, GPX3, and NF-κB2 expression may also be prognostic of clinical outcome for other human cancers except for PCa.
Discussion
Currently, PCa is the second most common cancer in the world, responsible for 258,000 deaths each year (Jemal et al., 2011; Ren et al., 2013). According to recent reports, the incidence of PCa in China has reached 1.6/100,000 per year, ranking 170th among all countries (Kamangar et al., 2006). Its incidence in China has recently increased substantially (Jian et al., 2004). In the past decade, in China, the dramatic decline in PCa mortality rate has been closely linked to PCa screening. It is estimated that at least 50% of the reduction in mortality is due to screening. However, a large number of men with PCa suffer from overtreatment and nonessential radical prostatectomies. The crux of the issue relates to whether the benefits of early diagnosis and treatment outweigh its harmful side effects. Prognostic biomarkers (including genetic mutations, DNA methylation, transcriptomics, and epigenetic landscape) promise a more accurate prediction of individual tumor behavior. One approach is to use widely potential biomarkers to analyze the risk of PCa based on multiple factors, as well as to screen for patients with significant risk of high-grade disease. However, these have still not achieved widespread acceptance due to a lack of biomarkers that could detect advanced disease at an earlier stage.
WGCNA provides a comprehensive set of functions for performing weighted correlation network analysis, which could identify candidate biomarkers or therapeutic targets. Compared with the existing packages focused only on unweighted networks, WGCNA implements methods for both weighted and unweighted correlation networks. To screen out the genes that are associated with the Gleason score, we performed WGCNA, a systems biology method for describing the correlation patterns among genes across microarray samples. In our study, green/yellow (0.4, 6e-22), red (0.37, 1e-18), magenta (0.37, 2e-19), and yellow (0.35, 2e-17) modules that had the highest correlation coefficient modules were identified. Moreover, GO and KEGG pathway analysis were performed on genes in the identified modules separately. Among the most enriched GO terms were cell proliferation (found in red and green/yellow modules) and RNA splicing (found in red and magenta modules), suggesting that they are critical for the pathological mechanisms of PCa. Interestingly, a number of splicing regulator proteins changed expression patterns in PCa, such as Sam68 and Tra2β (Busà et al., 2007; Diao et al., 2015; Munkley et al., 2017). Furthermore, numerous studies reported that changes in mRNA splice patterns were related to key pathologic process in PCa (Haudenschild et al., 2002; Li et al., 2011; Munkley et al., 2017). GO terms are enriched in yellow module such as response to endoplasmic reticulum (ER) stress, response to stress and ER overload response have been reported to drive solid tumor behaviors including PCa (Segawa et al., 2002; Ryu et al., 2017). In the green/yellow module, the glucocorticoid receptor signaling pathway was found to have a significant role. This was consistent with previous studies, which reported that glucocorticoid receptors confer resistance to androgen deprivation therapy, and that various glucocorticoids exert distinct efficacy in castration-resistant PCa (Hu and Chen, 2017). KEGG analysis shows that genes in the red module are highly enriched in the Notch signaling pathway, which is in accordance with previous research findings. Notch1 expression is increased four to five times in osteoblastic skeletal prostate metastatic cancer cell lines compared with nonskeletal metastatic cell lines, which are important for the osteomimetic gene expression in PCa metastatic cell lines (Zayzafoon et al., 2004). In the yellow module, some enriched pathways were involved in metabolic pathways, N-glycan biosynthesis and tryptophan metabolism (Wolf et al., 1968), suggesting that amino acid and glucose metabolism are critical for pathological process of PCa. In magenta module, HSV infection was found to be significant. This was consistent with previous studies, which reported that HSV-2 infection was associated with increased PCa risk (OR = 1.209; 95% CI: 1.003–1.456) (Ge et al., 2013).
Furthermore, we explored correlations between GS and MM for the identified modules. As a result, significant positive correlations between GS and MM were observed in the red (cor = 0.77, p = 2.7e-30) and yellow (cor = 0.89, p = 2.1e-148) modules (Fig. 1C). Then, a total of three oncogenes (NF-κB2, MLLT1, and VAV2) and two tumor suppressors (BNIP3L and GPX3) were identified based on their expression trend in different stages of PCa patients. NF-κB2 encodes a transcription factor named nuclear factor-kappa-B, a subunit of the NF-κB complex. The NF-κB complex is expressed in a variety of cell types and functions as a central activator of genes involved in inflammation and immune function. Gao and his colleagues reported that NF-κB2 upregulates glucose metabolism and modulates enzalutamide resistance in castration-resistant PCa (Cui et al., 2014). Another study by professor Gao showed that NF-κB2:c-Myc:hnRNPA1 pathway plays a central role in the generation of AR splice variants and regulates enzalutamide sensitivity in PCa (Nadiminty et al., 2015). VAV2 is the second member of the VAV guanine nucleotide exchange factor family of oncogenes, which is associated with numerous types of cancer (Batson et al., 2014; He et al., 2014; Havel et al., 2015). In PCa, VAV2 regulates cell migration by modulating cancer cell–cell repulsion (Batson et al., 2014). GPX3 belongs to the glutathione peroxidase family and functions to protect cells from oxidative damage. Promoter hypermethylation and downregulated expression of GPX3 have been observed in a variety of cancers, including thyroid cancer (Zhao et al., 2015), hepatocellular carcinoma (Cao et al., 2015), and PCa (Yu et al., 2007). In our research, we also observed that the expression of GPX3 is downregulated in PCa patients. Furthermore, we also observed that the expression of MLLT1 was upregulated and the expression of BNIP3L was downregulated, which also was associated with the survival of PCa patients. However, few researchers focused on these genes. Based on our research, it is reasonable to believe that MLLT1 and BNIP3L could be novel diagnostic and prognostic markers for PCa patients.
In conclusion, we identified five genes (NF-κB2, MLLT1, VAV2, BNIP3L, and GPX3) as valuable diagnosis markers for PCa through the combined use of WGCNA and Kaplan–Meier survival analysis. This should be helpful for the timely diagnosis and prognosis improvement of PCa. However, we still require molecular biological experiments and large-scale clinical trials to prove our hypothesis.
Footnotes
Disclosure Statement
No competing financial interests exist.
Supplementary Material
Supplementary Figure S1
Supplementary Figure S2
Supplementary Figure S3
Supplementary Figure S4
Supplementary Figure S5
Supplementary Figure S6
Supplementary Table S1
Supplementary Table S2
Supplementary Table S3
Supplementary Table S4
Supplementary Table S5
References
Supplementary Material
Please find the following supplemental material available below.
For Open Access articles published under a Creative Commons License, all supplemental material carries the same license as the article it is associated with.
For non-Open Access articles published, all supplemental material carries a non-exclusive license, and permission requests for re-use of supplemental material or any part of supplemental material shall be sent directly to the copyright owner as specified in the copyright notice associated with the article.
